1–8
Supermassive Black Holes in Spiral Galaxies
Abstract
We have embarked in an HST program to determine the masses of black holes in spiral galaxies directly by measuring the line emission arising from an extended accretion disk. For each of the galaxies in our sample we have measured the rotation curve and determined the mass distribution within the inner 5–50 pc. We have modeled the stellar mass component using the photometric data from existing HST images and using both data sets we have derived the masses of the black holes in each galaxy. These results will be very important in clarifying the role of the black hole in powering the AGN, will shed light into the effectiveness of the accretion mechanisms and finally will be important in addressing the fundamental issue of unification for Seyfert 1 and Seyfert 2 galaxies.
in Galactic Nuclei††editors: Th. Storchi Bergmann, L.C. Ho & H.R. Schmitt, eds.
1 Introduction
It is widely accepted that Active Galactic Nuclei (AGN) are powered by accretion of matter onto massive black holes. AGN activity peaked at –2 (e.g., Maloney & Petrosian 1999) and the high (L⊙) luminosities of quasi stellar objects (QSOs) are explained by accretion onto super massive ( M⊙) black holes at or close to the Eddington limit. The observed evolution of the space density of AGN (Chokshi & Turner 1992, Faber et al. 1997, Marconi & Salvati 2001) implies that a significant fraction of luminous galaxies must host black holes, relics of past activity. Indeed, it is now clear that a large fraction of hot spheroids contain a massive BH (e.g., Magorrian et al. 1998; van der Marel 1999), and it appears that the BH mass is proportional to both the mass of the host spheroid (Kormendy & Richstone 1995) and its velocity dispersion (Ferrarese & Merritt 2001, Gebhardt et al. 2000, Merritt & Ferrarese 2001).
Several radio-galaxies, all associated with giant elliptical galaxies, like M87 (Macchetto et al. 1997), M84 (Bower et al. 1998), NGC 7052 (van der Marel & van den Bosch 1998) and Centaurus A (Marconi et al. 2001), are now known to host supermassive (– M⊙) BHs in their nuclei. The luminosity of their optical nuclei indicates that they are accreting at a low rate and/or low accretion efficiency (Chiaberge, Capetti & Celotti 1999). They presumably sustained quasar activity in the past but at the present epoch are emitting much below their Eddington limits (L/L–). The study of the Seyfert BH mass distribution provides a statistical method of investigating the interplay between accretion rate and BH growth. In order to achieve this it is necessary to directly measure the BH masses in Seyfert galaxies and to compare their Eddington and Bolometric luminosities using the hard X-ray luminosities. Similarly important will be the comparison between the BH masses found in Seyfert galaxies with those of non active galaxies. However, to date, there are very few secure BH measurements or upper limits in spiral galaxies. It is therefore important to directly establish how common are BHs in spiral galaxies and whether they follow the same -, - correlations as Elliptical galaxies.
To detect and measure the masses of massive BHs requires spectral information at the highest possible angular resolution—the “sphere of influence” of massive BHs is typically in radius even in the closest galaxies. Nuclear absorption line spectra can be used to demonstrate the presence of a BH, but the interpretation of the data is complex because it involves stellar-dynamical models that have many degrees of freedom. In Seyfert galaxies the problems are compounded by the copious light from the AGN. Studies at HST resolution of ordinary optical emission lines from gas disks in principle provide a more widely applicable and readily interpreted way of detecting BHs (cf. M87, Macchetto et al. 1997, Barth et al. 2001) provided that the gas velocity field are not dominated by non gravitational motions.
2 The Sample, Observational Strategy and Modeling
Prompted by these considerations, we have undertaken a spectroscopic survey of 54 spirals using STIS on the Hubble Space Telescope. Our sample was extracted from a comprehensive ground-based study by Axon et al. who obtained H and N ii rotation curves at a seeing-limited resolution of , of 128 Sb, SBb, Sc, and SBc spiral galaxies from RC3. By restricting ourselves to galaxies with recession velocities km/s, we obtained a volume-limited sample of 54 spirals that are known to have nuclear gas disks and span wide ranges in bulge mass and concentration. The systemic velocity cut-off was chosen so that we can probe close to the nuclei of these galaxies, and detect even lower-mass black holes. The frequency of AGN in our sample is typical of that found in other surveys of nearby spirals, with comparable numbers of weak nuclear radio sources and LINERS.
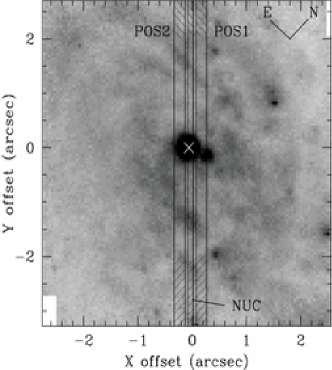
The observational strategy, used for all the galaxies in our sample, consisted in obtaining spectra at three parallel positions with the central slit centered on the nucleus and the flanking ones at a distance of 02. At each slit position we obtained two spectra with the G750M grating centered at H, with the second spectrum shifted along the slit by an integer number of detector pixels in order to remove cosmic-ray hits and hot pixels. The nuclear spectrum (NUC) was obtained with the 01 slit and no binning of the detector pixels, yielding a spatial scale of 00507/pix along the slit, a dispersion per pixel of Å and a spectral resolution of . The off-nuclear spectra (POS1 and POS2) were obtained with the 02 slit and on-chip binning of the detector pixels, yielding 0101/pix along the slit, 1.108 Å/pix along the dispersion direction and . The raw spectra were processed with the standard pipeline reduction software.
We derived rotation curves for each of the observed slit positions and applied our modeling code, described in detail in Marconi et al. (2003), to fit the observed rotation curves. Briefly the code computes the rotation curves of the gas assuming that the gas is rotating in circular orbits within a thin disk in the galaxy potential. The gravitational potential has two components: the stellar potential, determined from WFPC or NICMOS observations and characterized by its mass-to-light ratio, and a dark mass concentration (the black hole), spatially unresolved at HST+STIS resolution and characterized by its total mass MBH. In computing the rotation curves we take into account the finite spatial resolution of HST+STIS and we integrate over the slit and pixel area. The is minimized to determine the free parameters using a downhill simplex algorithm . The emission line surface brightness is modeled with a composition of two gaussians, the first reproducing the central emission peak while the second accounts for the brightness behaviour at large radii. Having fixed the line brightness distribution, the free parameters of the fit are the systemic velocity, , the impact parameter (i.e., the distance between the slit center and the center of rotation) , the position of the galaxy center along the slit , the angle between the slit and the line of nodes, , the disk inclination , the mass to light ratio, and the black hole mass . We perform a minimization allowing all parameters to vary freely.
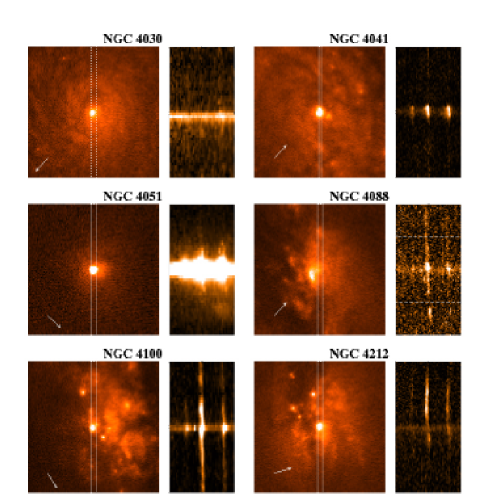
In this review I discuss the key results for two galaxies in our sample, namely NGC 4041 and NGC 5252, while in Fig. 1 I show a sample of the images and spectra for a subset of the other galaxies that we have observed.
3 NGC 4041
NGC 4041 is classified as a Sbc spiral galaxy with no detected AGN activity. Its average heliocentric radial velocity from radio measurements is becoming after correction for Local Group infall onto Virgo. With =75 -1 this corresponds to a distance of and to a scale of 95/.
The HST/STIS spectra were used to map the velocity field of the gas in its nuclear region. We detected the presence of a compact (), high surface brightness, circularly rotating nuclear disk cospatial with a nuclear star cluster. This disk is characterized by a rotation curve with a peak to peak amplitude of and is systematically blueshifted by –20 with respect to the galaxy systemic velocity.


The standard approach followed in gas kinematical analysis is to assume that (i) gas disks around black holes are not warped i.e., they have the same line of nodes and inclinations as the more extended components, and (ii) the stellar population has a constant mass-to-light ratio with radius (e.g., van der Marel & van den Bosch -1998; Barth et al. 2001). Using the emission line flux distribution derived from the imaging data, the inclination of the galactic disk can be fixed to = 20∘, i.e., The remaining free parameters can then be the fit with the procedure described earlier and we find that, in order to reproduce the observed rotation curve, a dark point mass [supermassive BH] of M⊙ is needed. However, the blueshift of the inner disk suggests the possibility that the nuclear disk could be dynamically independent. Following this line of reasoning we have relaxed the standard assumptions and model the curves by allowing variations in the stellar mass-to-light ratio and the disk inclination. We have found that the kinematical data can be accounted for by the stellar mass provided that either the mass-to-light ratio is increased by a factor of or the inclination is allowed to vary. This model resulted in a upper limit of M⊙ for the mass of any nuclear black hole.
Combining the results from the standard and alternative models, the present data only allow us to set an upper limit of M⊙ to the mass of the nuclear BH.
If this upper limit is taken in conjunction with an estimated bulge B magnitude of and with a central stellar velocity dispersion of , the putative black hole in NGC 4041 is not inconsistent with both the - and the - correlations.
4 NGC 5252
NGC 5252 is an early type (S0) Seyfert 2 galaxy at a redshift whose line emission shows a biconical morphology (Tadhunter & Tsvetanov 1989) extending out to 20 kpc from the nucleus along PA -15∘. On a sub-arcsec scale three emission line knots form a linear structure oriented at PA , close to the bulge major axis, suggestive of a small scale gas disk. For H Km s-1 Mpc-1 at the distance of NGC 5252 (92 Mpc), corresponds to 450 pc.

Fig. 4 shows the line central velocity, flux and FWHM for the central slit of our STIS observations. Emission, which is detected out to a radius of 6 corresponding to pc, is strongly concentrated showing a bright compact knot cospatial with the continuum peak. Two secondary emission line maxima are also present at from the main peak. They represent the intersection of the slit with emission line knots seen in our WFPC and STIS images. Two different gas systems are present in the nuclear regions of NGC 5252: the first shows a symmetric velocity field, with decreasing line width and can be interpreted as being produced by gas rotating around the nucleus. The second component, showing significant non circular motions, is found to be associated exclusively with the off-nuclear blobs.
Following the fitting procedure described earlier, the best fit to our data is obtained for a black hole mass M⊙. The model fitting of the nuclear rotation curve of NGC 5252 shows that the kinematics of gas in its innermost regions can be successfully accounted for by circular motions in a thin disk when a point-like dark mass (presumably a supermassive black hole) is added to the galaxy potential.


The central velocity dispersion of NGC 5252 (Nelson & Whittle, 1995) is . The correlation between velocity dispersion and black hole mass predicts a mass of M⊙ where the error is dominated by the uncertainty in . Therefore, the black hole mass we derived for NGC 5252 is larger by a factor than the value expected from this correlation! (see Fig. 5). This value however is in good agreement with the correlation between bulge and BH mass. As for its active nucleus, NGC 5252 is an outlier when compared to the available data for Seyfert galaxies, not only as it harbours a black hole larger than typical for these objects, but also as its host galaxy is substantially brighter than average for Seyfert galaxies. On the other hand, both the black hole and the bulge’s mass are typical of the range for radio-quiet quasars. Combining the determined BH mass with the hard X-ray luminosity, we estimate that NGC 5252 is emitting at a fraction of LEdd. This active nucleus thus appears to be a quasar relic, now probably accreting at a relatively low rate, rather than a low black hole mass counterpart of QSOs.
Acknowledgements.
The work described here is the result of a long standing collaboration with David Axon, Alessandro Capetti and Alessandro Marconi. They deserve the credit for the results.References
- [Barth et al. (2001)] Barth, A. J., Sarzi, M., Rix, H., Ho, L. C., Filippenko, A. V., & Sargent, W. L. W. 2001 ApJ 555, 685.
- [Bower et al. (1988)] Bower, G. A., et al. 1998 ApJ 492, L111.
- [Chiaberge et al. (1999)] Chiaberge, M., Capetti, A., & Celotti, A. 1999 A&A 349, 77.
- [Chokshi & Turner (1992)] Chokshi, A. & Turner, E. L. 1992 MNRAS 259, 421.
- [Faber et al. (1997)] Faber, S. M. et al. 1997 AJ 114, 1771.
- [Ferrarese & Merritt (2000)] Ferrarese, L. & Merritt, D. 2000 ApJ 539, L9.
- [Gebhardt et al. (2000)] Gebhardt, K. et al. 2000 ApJ 539, L13.
- [Kormendy & Richstone (1995)] Kormendy, J. & Richstone, D. 1995 ARA&A 33, 581.
- [Macchetto et al. (1997)] Macchetto, F., Marconi, A., Axon, D. J., Capetti, A., Sparks, W., & Crane, P. 1997 ApJ 489, 579.
- [Magorrian et al. (1998)] Magorrian, J. et al. 1998 AJ 115, 2285.
- [Maloney & Petrisian (1999)] Maloney, A. & Petrosian, V. 1999 ApJ 518, 32.
- [Marconi et al. (2001)] Marconi, A., Capetti, A., Axon, D. J., Koekemoer, A., Macchetto, D., & Schreier, E. J. 2001 ApJ 549, 915.
- [Marconi & Salvati (2001)] Marconi, A. & Salvati, M. 2001 astro-ph/0110698.
- [Marconi et al. (2003)] Marconi, A., et al. 2003 ApJ 586, 868.
- [Merritt & Ferrarese (2001)] Merritt, D. & Ferrarese, L. 2001 ApJ 547, 140.
- [Nelson & Whittle (1995)] Nelson, C. H. & Whittle, M. 1995 ApJS 99, 67.
- [Tsvetanov et al. (1996)] Tsvetanov, Z. I., Morse, J. A., Wilson, A. S. & Cecil, G. 1996 ApJ 458, 172.
- [van der Marel (1999)] van der Marel, R. P. 1999 In Galaxy Interactions at Low and High Redshift IAU Symp. 186, p. 333.
- [van der Marel & van den Bosch (1998)] van der Marel, R. P. & van den Bosch, F. C. 1998 AJ 116, 2220.