The Discovery of New Galaxy Members in the NGC 5044 and NGC 1052 Groups
Abstract
We present the results of neutral hydrogen (Hi) observations of the NGC 5044 and NGC 1052 groups, as part of a GEMS (Group Evolution Multiwavelength Study) investigation into the formation and evolution of galaxies in nearby groups. Two new group members have been discovered during a wide-field Hi imaging survey conducted using the ATNF Parkes telescope. These results, as well as those from followup Hi synthesis and optical imaging, are presented here. J, a new member of the NGC 5044 Group, has an Hi mass of and /L M⊙/ L⊙, with a radial velocity of . The optical galaxy is characterised by two regions of star formation, surrounded by an extended, diffuse halo. J, the new member of the NGC 1052 Group, has , /L M⊙/ L⊙and . The optical image reveals a low surface brightness galaxy. We interpret both of these galaxies as irregular type, with J possibly undergoing first infall into the NGC 1052 group.
keywords:
galaxies: clusters: individual: NGC 5044, NGC 1052 – radio lines: galaxies1 Introduction
Galaxy groups are the most common form of galaxy association, and also the most common environment in which galaxies are found (Tully, 1987). The size scales of groups lie between those of galaxy pairs and rich clusters. As such, they are an ideal environment in which to study the relationship between the formation and evolution of galaxies, and large scale structure.
Studies of galaxy groups and clusters at optical and infrared wavelengths select against low surface brightness and low luminosity objects (Impey & Bothun, 1997), which are predicted to be numerous in these environments (e.g. Moore et al., 1999). These optically-faint objects are often gas-rich and are thus more likely to be detected in neutral hydrogen (Hi) surveys. Hi is also a sensitive tracer of gravitational disturbances, such as tidal interactions and galaxy mergers, with the kinematic imprint of such encounters often being retained to distances larger than several galactic radii (Mundell et al., 1995; Hibbard, 2000). Studies of the content, distribution and kinematics of Hi in galaxy groups therefore provide an important probe of ongoing galaxy interactions and mergers and, in combination with X-ray and optical studies, provide a key indicator of the group’s evolutionary state and that of its constituent galaxies.
The Group Evolution Multiwavelength Study (GEMS) is a multi-wavelength investigation of the evolution of nearby galaxy groups. It compares the X-ray, Hi and optical properties of a sample of groups, selected on the availability of high-quality X-ray (ROSAT) data, with the aim of building up a comprehensive view of their evolutionary state and, ultimately, furthering our understanding of the processes which drive galaxy evolution within a group environment.
As part of GEMS we have completed a sensitive, wide-area Hi imaging survey of 17 nearby galaxy groups, using the Multibeam System on the ATNF Parkes Radiotelescope111The Parkes telescope is part of the Australia Telescope, which is funded by the Commonwealth of Australia for operation as a National Facility managed by CSIRO. Full details of this survey will be given in a later paper. With its long integration times and wide-area mapping, the GEMS Hi survey complements deep targeted studies of small areas of the sky (e.g. de Blok et al., 2002) and less sensitive Hi all-sky surveys, for example the southern HIPASS (Staveley-Smith et al., 1996) and northern HIJASS (Lang et al., 2003) which, although cataloguing a large number of new objects (Meyer et al., 2004), are less sensitive to emission from faint dwarf and LSB galaxies.
Here we report the discovery of Hi emission from two uncatalogued objects in the NGC 5044 and NGC 1052 groups and present higher angular resolution follow-up Hi synthesis imaging and spectroscopy, and optical imaging of these objects. In this paper we use distances of 33 Mpc and 20 Mpc to the NGC 5044 and NGC 1052 groups, respectively, taken from Osmond & Ponman (2004) in which a value of Mpc-1 was used.
2 Observations and data reduction
2.1 Parkes observations
Parkes observations were carried out on 2001 January 7–10 and July 14–18. The area imaged for each target group comprised a field centred on the group position and corresponding to a projected area ranging from Mpc to Mpc, depending on the distance to each of the groups in the sample. The observations and data reduction followed the method employed by Barnes & de Blok (2001). The spectra obtained were calibrated and corrected for bandpass on-line and formed into an image cube, composed of two spatial dimensions with velocity information as the third, using software developed for the HIPASS survey (Barnes et al., 2001). These final image cubes have a spatial resolution of 15.5 arcmin with a 4 arcmin pixel size and a spectral resolution of 1.6 . The Parkes survey parameters and the properties of the image cubes are summarised in Table 1.
| NGC 5044 | NGC 1052 | |
| Date of observation | 2001-Jan-07–10 | 2001-Jan-07–10 |
| 2001-Jul-15–17 | 2001-Jul-14–18 | |
| Centre of scanned field : | ||
| Right Ascension (J2000) | ||
| Declination (J2000) | ||
| Angular area imaged | ||
| Frequency of observation (MHz) | 1409.0 | 1413.5 |
| Bandwidth (MHz) | 8 | 8 |
| Spectral channels | 2048 | 2048 |
| Spectral channel width (kHz) | 3.8 | 3.8 |
| Integration time (s) | 5 | 5 |
| Data cube properties: | ||
| Linear dimensions (pixels) | ||
| Velocity channels | 1024 | 1024 |
| Velocity range () | 1565–3252 | 615–2302 |
| Spatial resolution | 15.5′ | 15.5′ |
| Pixel size | 4′ | 4′ |
| Spectral resolution () | 1.6 | 1.6 |
| RMS noise level (mJy beam-1) | 53.8 | 54.0 |
The two cubes were inspected visually for Hi emission, using the karma data visualisation package (Gooch, 1995). Potential detections were confirmed by extracting spectra through the cube at each candidate position, using the mbspect task of the miriad data reduction and analysis package (Sault et al., 1995). The area over which the spectra were extracted and the amount of Hanning smoothing used were optimised in each case, to obtain the spectrum with maximum signal-to-noise ratio.
2.2 ATCA observations
In order to characterise the properties and determine the more precise locations of the newly discovered Hi emission regions in the NGC 5044 and NGC 1052 groups, high-resolution 21-cm follow-up observations were carried out on 2002 January 8–9, using the Australia Telescope Compact Array222The Australia Telescope is funded by the Commonwealth of Australia for operation as a National Facility managed by CSIRO in its 750A configuration, which has baselines in the range 76.5–3750.0 m. The correlator was configured to provide two orthogonal linear polarisations, each with a bandpass of 8 MHz and divided into 1024 spectral channels, with the central observing frequency tuned to the known redshifted Hi frequency of the target source, yielding a velocity resolution of 1.5 km s-1 per channel. The pointing centre of each observation was chosen to be the location of the new Hi emission regions detected in the Parkes observations. These are listed in Table 2 along with a summary of other observing parameters.
| NGC 5044 | NGC 1052 | |
| Date of observation | 2002-Jan-08 | 2002-Jan-09 |
| Field pointing centre: | ||
| Right Ascension (J2000) | ||
| Declination (J2000) | ||
| Primary beam (arcmin) | 33′ | 33′ |
| Antenna efficiency | 68% | 68% |
| Frequency of observation (MHz) | 1408 | 1414 |
| Bandwidth (MHz) | 8 | 8 |
| Spectral channels | 1024 | 1024 |
| Spectral channel width (kHz) | 7.8 | 7.8 |
| Effective time on source (h) | 8.49 | 7.30 |
| Flux calibrator | PKS B, | PKS B |
| PKS B | ||
| Phase calibrator | PKS B | PKS B |
| Data cube properties: | ||
| Linear dimensions (pixels) | ||
| Velocity channels | 90 | 102 |
| Velocity range () | 2538 – 2837 | 1174 – 1510 |
| Channels imaged | 451 – 630 | 401 – 605 |
| Spatial resolution | 41″ 32″ | 420″ 50″ |
| Pixel size | 3″ 3″ | 15″ 15″ |
| Spectral resolution () | 3.3 | 3.3 |
| RMS Noise (mJy beam-1) | 2.6 | 3.8 |
The observing strategy followed the standard phase referencing technique, consisting of alternate observations of the target source (25 min) and a nearby phase calibrator (5 min), with this cycle repeated over each 12 hour run. PKS B was observed at least once during the observation of each target, to determine the bandpass correction and calibrate the absolute flux scale, assuming a flux density for this source of 14.9 Jy at 1384 MHz (Reynolds, 1994).
The data reduction was carried out using the NRAO Astronomical Image Processing System (aips), with the calibration following the standard procedure outlined in the aips Cookbook (2000). The editing and calibration of the data were carried out using a “channel 0” dataset, generated by averaging the visibilities in the central 75% of the bandpass.
The NGC 5044 Group dataset suffered from narrow-band interference at 1.408 GHz, due to the 11th harmonic of the telescope’s 128 MHz sampler clock (Killeen, 1995). This interference was limited to a single channel and was excised by flagging the affected channel, prior to creation of the “channel 0” dataset.
Calibration of the NGC 5044 Group dataset used PKS B and the phase calibrator PKS B. Gain and phase solutions for the calibrators were derived and applied to the spectral-line dataset. After bandpass correction, the pure continuum dataset was extracted (by averaging together line-free channels 100450 and 630950), imaged and used to further self-calibrate the target field. The final corrections were then applied to the spectral line data.
Similar data editing and calibration methods were used for the NGC 1052 Group dataset. However, due to instrumental problems, data from antenna CA06 had to be discarded, resulting in an usable uv-range of 0 – 3.5 k for this dataset.
On-line Doppler tracking is not used by ATCA, so calibrated spectral line datasets were corrected for the Earth’s motion using the task cvel. Finally, the emission in the line-free channels (100–450 and 630–950 for the NGC 5044 dataset and 200–430 and 605–850 for the NGC 1052 dataset) was used, with the task uvlin, to model and subtract the continuum, in the u-v plane.
An image cube of each target field, employing 2-channel spectral averaging (resulting in a velocity resolution of 3.3 ) was then generated using imagr, to Fourier transform and deconvolve the calibrated, spectral-line datasets. Natural weighting (Briggs’ robustness parameter 5) was used, to maximise sensitivity to low surface-brightness, extended structure (Briggs, 1995), and line-free channels (i.e. those chosen to produce the continuum dataset) were excluded from the imaging process. Finally, a correction was applied to the image cubes, using pbcor, to account for primary beam attenuation. Spectral-line cube properties are given in Table 2.
The minimum detectable Hi mass per channel in the NGC 5044 cube ( detection), of an object of angular size equal to that of the synthesised beam and located at the pointing centre, is M⊙. Similarly, a detection of an object with the largest angular extent imageable by the array ( arcmin) is M⊙.
For the NGC 1052 dataset, the minimum detectable Hi mass per channel is M⊙, assuming a detection at the pointing centre, of an object the size of the synthesised beam. Similarly, a detection of an object with the largest angular extent imageable by the array ( arcmin) is M⊙.
2.3 Optical observations
Examination of images from the Second Digitized Sky Survey (DSS II – Lasker & McLean, 1994) revealed faint optical emission coincident with the Hi-detected objects in the NGC 5044 and NGC 1052 groups (see Section 3). Subsequently, follow-up broad-band images were obtained using the Wide Field Imager (WFI) on the MPG/ESO 2.2-m telescope in 2001 August 7-10. Conditions were photometric with 1 arcsec seeing. The exposure times were s and s respectively, for the B- and R-band observations of the NGC 5044 group, and s for the R-band observation of the NGC 1052 group.
Data were taken at several dither positions, in order to eliminate the gaps between the individual CCD chips of the WFI instrument, when mosaicing the dithered images together after basic reduction of the individual images. The data reduction was carried out using IRAF software as well as dedicated IDL scripts, and galaxy photometry was performed using Sextractor (Bertin & Arnouts, 1996; see Miles et al., 2004 for further details). The Sextractor detection threshold for galaxies detected in the mosaiced R-band image of the NGC5044 field was .
3 Results
Regions of Hi emission from positions previously uncatalogued in both optical and radio positional databases (e.g. the NASA-IPAC Extragalactic Database (NED333The NASA/IPAC Extragalactic Database (NED) is operated by the Jet Propulsion Laboratory, California Institute of Technology, under contract with the National Aeronautics and Space Administration.)) are detected in the NGC 5044 and NGC 1052 groups. In the NGC 5044 Group, Hi is detected North-East of the group centre, whilst in the NGC 1052 Group Hi emission is detected 14 arcmin South of the edge-on galaxy NGC 1110, itself located from the group centre. Optical emission is also detected from these two Hi-emission regions.
| NGC 5044 | NGC 1052 | |
|---|---|---|
| Group centre: | ||
| Right Ascension (J2000) | ||
| Declination (J2000) | ||
| Systemic velocity () | ||
| Velocity dispersion () | ||
| Distance to group (Mpc) | 33 | 20 |
| (kpc) | 620 | 360 |
3.1 NGC 5044 Group: J1320–1427
Hi emission
Fig. 3 shows the Parkes spectrum of the previously uncatalogued source of Hi emission, discovered North-East of the NGC 5044 Group centre (see Table 3), to which we refer as “J” after its refined position. The spectrum was extracted using a spatial box width of 5 pixels and Hanning smoothing over 7 channels; a second-order polynomial was fitted to line-free channels and subtracted to correct the non-zero baseline. The line has a width, at 50% intensity, of . The integrated Hi flux is Jy km s-1 which, assuming optically thin emission and a distance to J of 33 Mpc (the adopted distance to the NGC 5044 Group), implies a total Hi mass of .
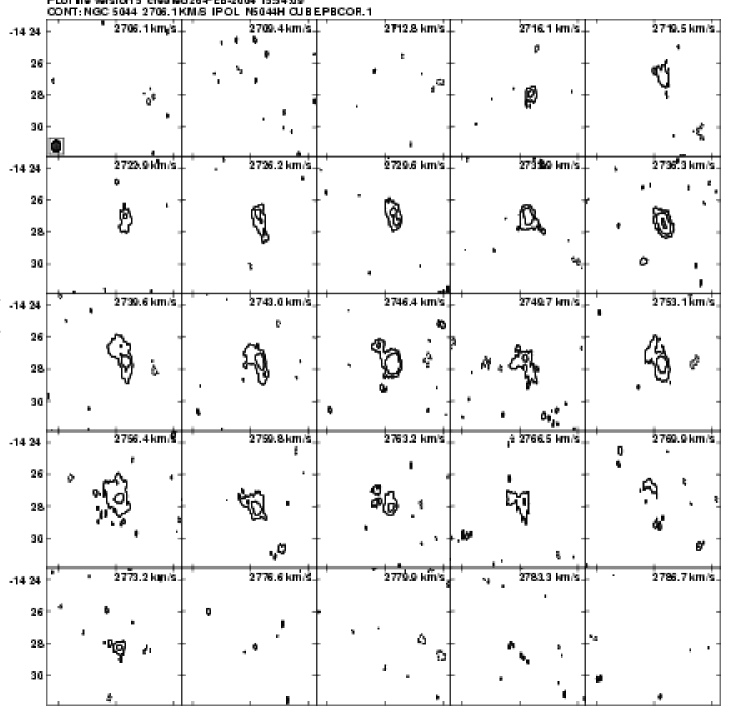
ATCA imaging of J reveals Hi emission from a region centred on , , with a deconvolved size of and a velocity range of 2716–2773 . Channel maps for this object are shown in Fig. 4.
Maps of line intensity integrated over velocity ( moment, Fig. 5) and intensity-weighted velocity ( moment, Fig. 6) were produced using the Brinks “conditional blank” method (Taylor et al., 1993) where a mask, created by excluding fluxes below on each spatially smoothed channel map, was used to filter noise from the full resolution image cube, prior to calculating the moments with xmom. The total Hi intensity map (Fig. 5) shows the emission to be elongated in the north-south direction, with emission extending to the north-east. The contour of this map was used to define the spatial area over which the average spectrum, shown in Fig. 3, was taken.
We measure a peak Hi column density of atoms cm-2 (9.0 M⊙), which is a lower limit of this quantity, due to the large beam size. The integrated total Hi intensity is Jy km s-1, from which we calculate an Hi mass M⊙. The projected size of the Hi emission, measured to a column density of 1.6 M⊙ (), is kpc.
Despite the narrow range in velocity covered by the Hi emission ( - see Fig. 3), the velocity field (Fig. 6) is relatively well-ordered, showing a smooth change in velocity of 30 over 1.5 arcmin (14 kpc) from the north-west to south-east.
Several background radio continuum sources lie within the field of view but no continuum emission above the level of 0.3 was detected at the position of J.
Optical data
| J | ||||||
|---|---|---|---|---|---|---|
| Component 1 | Component 2 | Component 3 | Component 4 | LSB | Total | |
| (i) | (ii) | (iii) | (iv) | (v) | (vi) | |
| mB (mag) | ||||||
| B R (mag) | ||||||
| (Galactic) (mag) | 0.37 | 0.37 | 0.37 | 0.37 | 0.37 | - |
| (Galactic) (mag) | 0.23 | 0.23 | 0.23 | 0.23 | 0.23 | - |
| (intrinsic) (mag) | 0.68 | 0.85 | 0.57 | 0.82 | 0.63 | - |
| (intrinsic) (mag) | 0.38 | 0.48 | 0.32 | 0.46 | 0.35 | - |
| MB (mag) | ||||||
| MR (mag) | ||||||
| (mag arcsec-2) | - | - | - | - | 26.91 | 25.81 |
| (mag arcsec-2) | - | - | - | - | 25.02 | 25.59 |
| LB ( L⊙) | ||||||
| LR ( L⊙) | ||||||
| / LB ( M⊙/ L⊙) | - | - | - | - | 1.37 | 1.64 |
| / LR ( M⊙/ L⊙) | - | - | - | - | 1.05 | 2.56 |
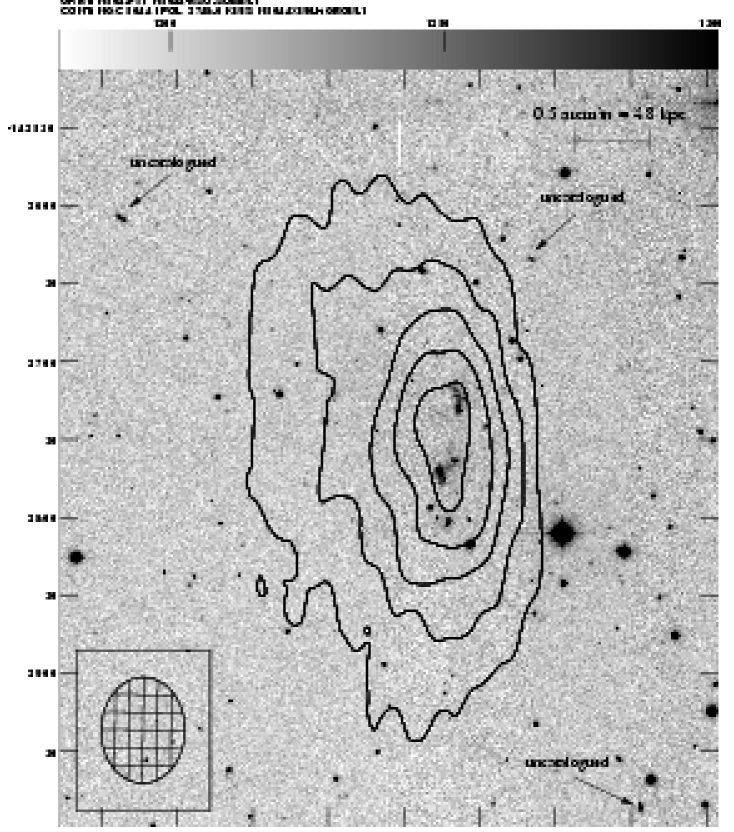
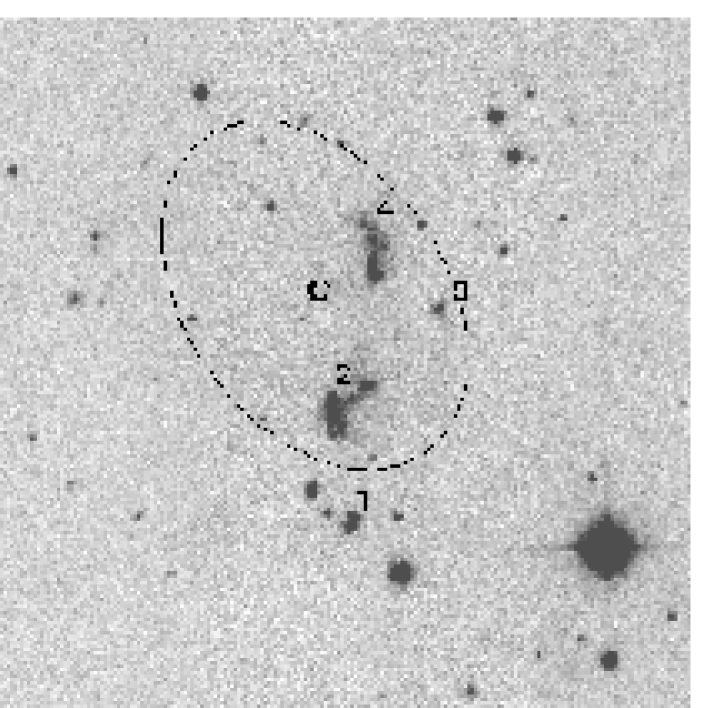
Our follow-up B and R-band images (see Fig. 7) reveal knots of optical emission; two spatially-extended sources straddle the position of Hi maximum, while two further bright regions lie, one south and one west of the main peaks. The two main optical components (labelled 2 and 4 in Fig. 7) are very blue, with (BR) values of 0.32 and 0.16 magnitudes respectively, suggesting that star formation is occurring within these regions.
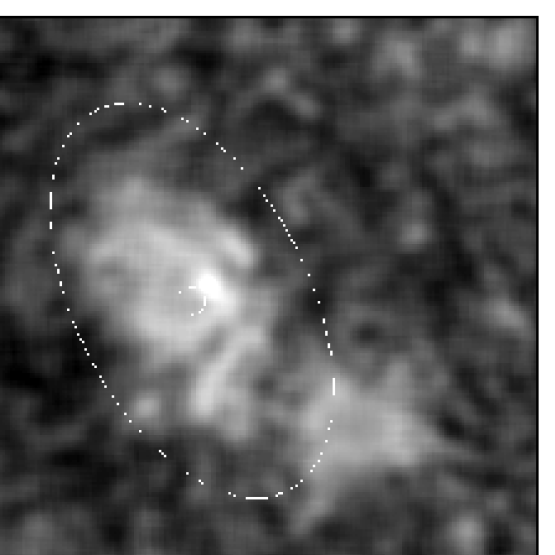
Applying a filter to remove the high surface-brightness objects in the R-band image and convolving the result with an exponential kernel, revealed a very low-surface brightness halo extending north-east of the two main optical components, towards the extended Hi emission. Fig. 7 shows the R-band image with the four main optical components identified, and the convolved image showing the LSB halo. The extent of the faint halo is illustrated with an ellipse. The mean sky background level in the R-band mosaic image was 20.24 mag arcsec-2, while the peak surface brightness of the LSB component was 23.77 mag arcsec-2. In general, the convolution of the image with an appropriate exponential kernel allowed us to detect galaxies with peak surface brightnesses of about 4.25 magnitudes below the background. The detection of the LSB component is therefore significant, being 0.75 mag brighter than the detection limit.
The measured and derived optical properties of the system are shown in Table 4. Columns numbered (i – iv) refer to the four bright optical components, and column (v) to the low surface brightness halo (LSB). Column (vi) shows the combined optical properties of all objects within the extent of the halo (components 2, 4 and LSB). The Galactic extinction corrections in B and R, and , were obtained as per Schlegel et al. (1998).
The upper limit for the extinction intrinsic to J was calculated from the average Hi column density over each component, using the relations (Staveley-Smith & Davies, 1987) and (Binney & Merrifield, 1998). The surface brightnesses ( and ) of the LSB component only, and the total surface brightness of the optical object were calculated assuming that the optical extent is defined by the ellipse shown in Fig. 7.
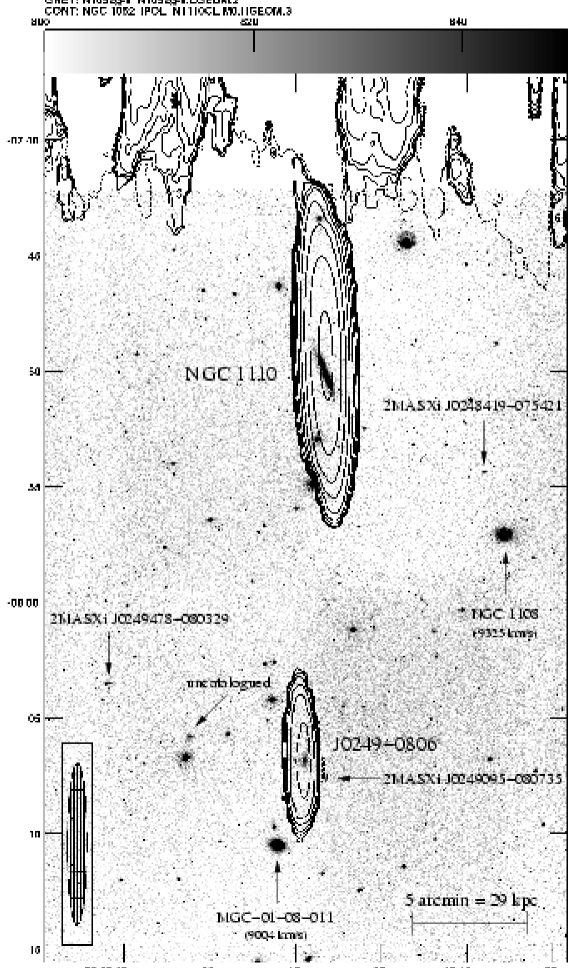
3.2 NGC 1052 Group: J0249–0806
Hi emission
Inspection of the Parkes cube for the NGC 1052 Group revealed Hi emission from a number of known galaxies. In particular, our spectrum of the edge-on galaxy NGC 1110 (ID 463 in Tifft & Cocke 1988; RFGC 600 in Karachentsev et al. 1999), which lies 2∘ from the group centre, shows a classic line profile of a rotating disk (Fig. 8). However, an additional emission component distinct in velocity from NGC 1110 was detected, offset by approximately one beamwidth south. The spectrum taken at this position, of the object hereafter named “J”, is shown in Fig. 9. A box width of 3 pixels and Hanning smoothing over 5 channels were used to produce this spectrum, and a fourth-order polynomial was fitted and subtracted to correct the non-zero baseline. The intensity integrated over velocity of J is Jy km s-1, implying an Hi mass of , assuming a distance to the source of 20 Mpc.
The angular resolution of the Parkes data was not sufficient to determine the spatial relationship between NGC 1110 and the newly-discovered Hi emission. We therefore used ATCA to image the region with an improved angular resolution (), which confirmed the new detection and established this Hi emission as spatially and kinematically distinct from that of NGC 1110.
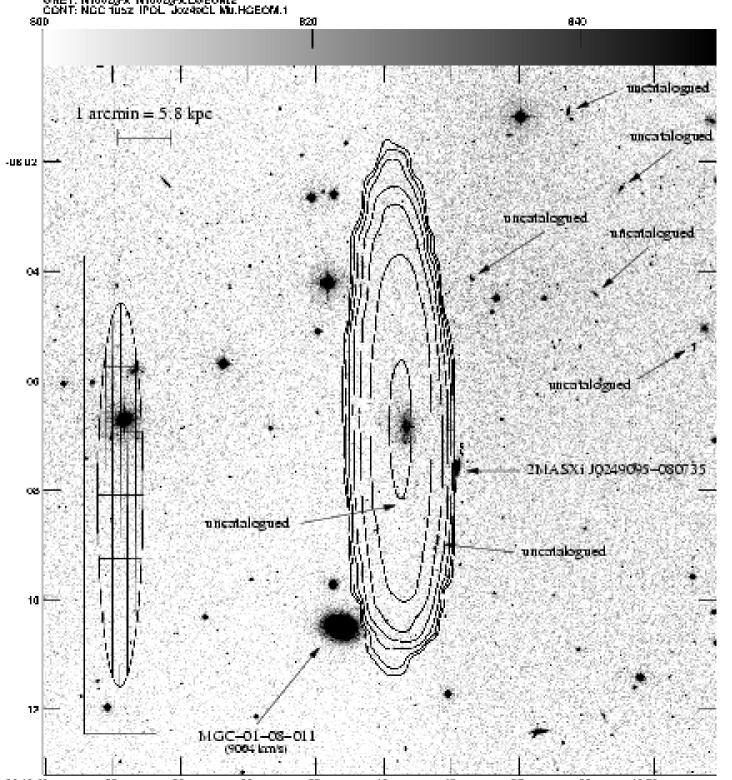
Fig. 10 shows the distribution of Hi emission from the two galaxies, overlaid on our R-band optical image. J lies 17 arcmin ( kpc) south of the edge-on galaxy NGC 1110, and is associated with faint diffuse optical emission. The Hi is centred on , , and has a velocity range 1404–1490 . The rms noise level is per channel, with a detection corresponding to an Hi column density of cm-2 (0.02 M⊙) per channel. The Hi emission from NGC 1110 is spatially and kinematically distinct from this, being centred on , , with velocity range 1237–1424 .
The total intensity map of J is shown in Fig. 11. This source is essentially unresolved in Hi at the resolution of our observations, so little may be determined about its morphology. The (lower limit) peak Hi flux is atoms cm-2 (equivalent to 1.8 M⊙) and lies close to the optical peak. The Hi velocity structure shows a smooth change in velocity of 40 over arcmin, with marginal evidence of a north-east to south-west velocity gradient with position angle . The Hi intensity of J, integrated over velocity, is Jy km s-1. This corresponds to a total Hi mass M⊙, assuming the source to be at the distance of the NGC 1052 Group.
The difference between the Parkes and ATCA velocity-integrated Hi intensities for J0249-0806 (see Fig. 9) implies the presence of extended emission, not detected by the ATCA observations due to the lack of very short antenna spacings, or the presence of a significant amount of Hi with column densities below the detection limit of the ATCA observations. The map shown in Fig. 10 maximises the sensitivity to extended structure (by only including data with uv-distance ) available with the chosen array configuration. This does not show any evidence of extended emission, for example tidal tails, connecting bridge or common envelope surrounding J and NGC 1110, which one might expect if the two objects were strongly interacting. This lack of tidal features is consistent with the current strength of the interaction, as defined by the Dahari Q parameter (Dahari 1984), being very small. We conclude that the additional Hi emission detected in the Parkes spectrum of J0249-0806 must be smoothly extended on scales larger than 4 arcmin (the largest angular scale imageable by the array), possibly distributed as a diffuse halo.
Optical data
The MPG/ESO 2.2-m WFI R-band follow-up image of the region clearly shows NGC 1110, and an uncatalogued low surface brightness source, spatially coincident with the J neutral hydrogen detection. The image also shows a number of other galaxies (see Figs 10 and 11) however those with published velocities clearly lie outside the NGC 1052 group. The derived optical properties of J are listed in Table 5.
| J | |
|---|---|
| mR (mag) | |
| (Galactic) (mag) | 0.084 |
| (intrinsic) (mag) | 0.09 |
| (arcsec) | |
| MR (mag) | -17.41 |
| (mag arcsec-2) | 22.1 |
| LR ( L⊙) | |
| / LR ( M⊙/ L⊙) | 1.13 |
4 Discussion
4.1 Group membership
J1320–1427 and the NGC 5044 Group
Early classification by Huchra & Geller (1982) of this galaxy group, using the percolation method to determine group membership to a limiting magnitude of m, suggested a membership of three galaxies, concentrated around the brightest group member, NGC 5044. Garcia (1993) subsequently used percolation and hierarchical clustering (Materne, 1978) methods to identify 9 group members to a magnitude limit of m, and catalogued the group as LGG 338. In a study of the central sq. of the group, which used the visual inspection of optical plates to find dwarf group members, Ferguson & Sandage (1990) identified 80 definite and a further 82 likely or possible members of the NGC 5044 Group, with 69% of the total classified as dwarf galaxies (Cellone, 1999).
As part of the GEMS project, Osmond & Ponman (2004) have recalculated the optical membership of the NGC 5044 Group, using NED as the parent catalogue. Their criteria for group membership require that members lie within the overdensity radius of the group (calculated from the group’s X-ray temperature) and have a velocity which differs by no more than from the group velocity. Using this method Osmond & Ponman found 18 members of the NGC 5044 Group and determined several group parameters, including the heliocentric velocity , resulting in a corrected distance to the group of 33 Mpc. The velocity dispersion, , is high for galaxy groups. These, and other group parameters from Osmond & Ponman (2004) relevant to this paper are given in Table 3.
The position of J within the NGC 5044 Group is shown in Fig. 1. It lies on the outskirts of the group, 137 arcmin () north-west of the group centre. This corresponds to a projected distance of 1.3 Mpc, or . Despite its distance from the group centre, the velocity of J matches well with those of other group members. The velocity distribution of all known group members, as a function of angular distance from the group centre, is shown in Fig. 12; the velocity of J (2750 ) is from the mean group velocity of . We therefore suggest that J is likely to be a member of the NGC 5044 Group, rather than a chance superposition of the group and an unrelated field galaxy.
J0249–0806 and the NGC 1052 Group
The NGC 1052 group of galaxies, also known as LGG 71, was first identified by Huchra & Geller (1982) with a membership of 6 galaxies, with this later extended to 14 galaxies by Tully (1988) and Garcia (1993), using the membership determination methods described above (see Figs 2 and 13 for the position and velocity distribution of the group members). Using the same criteria employed for NGC 5044, Osmond & Ponman (2004) have catalogued this group with 4 galaxy members, a group radial velocity (implying a distance to the system of 20 Mpc) and velocity dispersion (see Table 3).
The brightest galaxy in the group is NGC 988 (Giuricin et al., 2000), an SB(s)cd galaxy with m. The galaxy which gives the group its common name, NGC 1052, is classified as an E4 elliptical (Reif et al., 1978) and is found to have an asymmetrical Hi spectrum. van Gorkom et al. (1986) suggest that the Hi gas was captured from a gas-rich dwarf or spiral galaxy about years ago.
The radial distance of between J and the group centre corresponds to a projected distance of 747 kpc, or . The radial velocity of this galaxy, 1450 , is from the mean group velocity of . Fig. 13 shows the velocity distribution of members of the NGC 1052 Group as a function of radial distance from the group centre. From this, and the diagram showing the positions of the group members on the sky (Fig. 2) we suggest that J is a physical member of the NGC 1052 Group.
4.2 The nature of J1320–1427 and J0249–0806
The measured properties (Hi emission and optical photometry) of J1320–1427 and J0249–0806 are consistent with those exhibited by irregular galaxies.
Morphologically, a smooth diffuse halo enveloping bright star forming regions, akin to what we see in J, is a feature occasionally seen in high sensitivity observations of irregular galaxies (Gallagher & Hunter, 1984). The absolute magnitude of this galaxy, measured here to be M, is in the range accepted for irregulars, tending somewhat towards the dwarf end of that scale (Binggeli et al., 1988; Gallagher & Hunter, 1984).
The mean Hi surface densities of the two galaxies, measured to a radius where the Hi column density drops to 1 M⊙, are M⊙for J1320–1427 and M⊙for J0249–0806, with peak column densities of 9.0 M⊙and 1.8 M⊙ respectively. These values are higher than the Kennicutt star-formation threshold (Kennicutt, 1989), and consistent with the surface density of late-type spiral and irregular galaxies (Roberts & Haynes, 1994).
The neutral hydrogen mass-to-light ratios of J and J are /L, /L and /L, respectively while for the low surface brightness halo in J /L M⊙/ L⊙ and /L M⊙/ L⊙. The /LB values are higher than the median values calculated by Roberts & Haynes (1994) (/L M⊙/ L⊙ for Scd and Sd galaxies and /L M⊙/ L⊙ for Sm and Im galaxies) and others (eg. Roberts, 1969; Broeils & Rhee, 1997, etc.), but they are consistent with several individual Sm and Im galaxies in their samples, at the high end of the /L scale. The /LR values are consistent with the average for Im galaxies, /L, calculated from Hi masses and photometry by Swaters & Balcells (2002). In comparison, the isolated Hi cloud J1712-64, found by the HIPASS survey (Kilborn et al., 2000), has /L M⊙/ L⊙, a further indication, in addition to the fact that we do detect a stellar component in both our objects, that J and J are not primordial gas clouds left over from the formation of the groups.
Although not a primordial cloud, J might be on its first infall into the NGC 1052 group. As discussed in Section 4, this galaxy lies approximately from the group centre, but has a velocity consistent with group membership. More indicative of first infall, however, is its high /L ratio, implying an absence of tidal stripping. Aditionally, we have detected greater Hi emission with the single-dish than in the synthesis observation, suggesting the presence of gas extended on scales larger than 4 arcmin. This gas does not appear to be in the form of tidal tails and therefore might exist as a smooth diffuse halo, as is seen in, for example, Sextans A (Wilcots & Hunter, 2002). Existence of such halos would confirm that the galaxy is on its first infall into the group potential well, as otherwise such a halo would easily have been stripped (eg. Acreman et al., 2003; Gottlöber et al., 2002). In particular, simulations by Marcolini et al. (2003), of dwarf galaxies moving through a low density IGM typical of galaxy groups, indicate that the galaxies are completely stripped by the group IGM within timescales as short as 1-2 Myr. An extended Hi halo, as may exist around J, is less likely to survive in the inner region of the group, as it will be much less strongly bound than the disc gas simulated by Marcolini et al. (2003). Conversely, we see no evidence for first infall of the NGC 5044 group galaxy, J.
5 Conclusions
We have presented high angular resolution radio synthesis and optical observations of new galaxy members, discovered in the groups NGC 5044 and NGC 1052, as part of the GEMS survey of galaxy groups.
J1320–1427, in the NGC 5044 Group, has M⊙ (single dish measurement), , and M⊙/ L⊙, M⊙/ L⊙. J, in the NGC 1052 Group, has M⊙ (single dish measurement), and M⊙/ L⊙. Both of these galaxies are at a distance equivalent to just over from their group centres. This and the possible presence of an extended Hi halo suggests that J may be on its first infall into the NGC 1052 group.
Acknowledgments
Financial support in the form of postgraduate studentships from the Astrophysics Research Institute and PPARC is acknowledged by NPFM and SB respectively. NPFM would like to thank the Institute of Astrophysics at the University of Innsbruck and ESO Garching for their hospitality on several occasions whilst this work was being carried out. CGM acknowledges financial support from the Royal Society. The authors would also like to thank the referee, for useful comments regarding this work. This research has made use of the NASA Astrophysics Data System Abstract Service (ADS), and the NASA/IPAC Extragalactic Database (NED), which is operated by the Jet Propulsion Laboratory, California Institute of Technology, under contract with the National Aeronautics and Space Administration.
References
- Acreman et al. (2003) Acreman D. M., Stevens I. R., Ponman T. J., Sakelliou I., 2003, MNRAS, 341, 1333
- AIPS Group, (2000) AIPS Group, 2000, AIPS Cookbook. National Radio Astronomy Observatory
- Barnes & de Blok (2001) Barnes D. G., de Blok W. J. G., 2001, AJ, 122, 825
- Barnes et al. (2001) Barnes D. G., Staveley-Smith L., de Blok W. J. G., Oosterloo T., Stewart I. M., Wright A. E., Banks G. D., Bhathal R., Boyce P. J., Calabretta M. R., Disney M. J., Drinkwater M. J., Ekers R. D., Freeman K. C., Gibson B. K., Green A. J., Haynes, R. F., te Lintel Hekkert, P., Henning, P. A., Jerjen, H., Juraszek, S., Kesteven, M. J., Kilborn, V. A., Knezek, P. M., Koribalski, B., Kraan-Korteweg, R. C., Malin, D. F., Marquarding, M., Minchin, R. F., Mould, J. R., Price, R. M., Putman, M. E., Ryder, S. D., Sadler, E. M., Schröder, A., Stootman, F., Webster, R. L., Wilson, W. E., Ye, T., 2001, MNRAS, 322, 486
- Bertin & Arnouts (1996) Bertin E., Arnouts S., 1996, BAAS, 117, 393
- Binggeli et al. (1988) Binggeli B., Sandage A., Tammann G. A., 1988, Ann. Rev. Astron. Astrophys., 26, 509
- Binney & Merrifield (1998) Binney J., Merrifield M., 1998, Galactic Astronomy. Princeton Series in Astrophysics, Princeton University Press
- Briggs (1995) Briggs D. S., 1995, BAAS, 27, 1444
- Broeils & Rhee (1997) Broeils A. H., Rhee M.-H., 1997, A&A, 324, 877
- Cellone (1999) Cellone S. A., 1999, A&A, 345, 403
- de Blok et al. (2002) de Blok W. J. G., Zwaan M. A., Dijkstra M., Briggs F. H., Freeman K. C., 2002, A&A, 382, 43
- Ferguson & Sandage (1990) Ferguson H. C., Sandage A., 1990, AJ, 100, 1
- Gallagher & Hunter (1984) Gallagher J. S., Hunter D. A., 1984, Ann. Rev. Astron. Astrophys., 22, 37
- Garcia (1993) Garcia A. M., 1993, A&AS, 100, 47
- Giuricin et al. (2000) Giuricin G., Marinoni C., Ceriani L., Pisani A., 2000, ApJ, 543, 178
- Gooch (1995) Gooch R. E., 1995, in Jacoby G. H., Barnes J., eds, Astronomical Data Analysis Software and Systems V Vol. 101 of ASP Conf. Ser., Karma: a visualisation test-bed. pp 80–83
- Gottlöber et al. (2002) Gottlöber S., Kerscher M., Kravtsov A. V., Faltenbacher A., Klypin A., Müller V., 2002, A&A, 387, 778
- Hibbard (2000) Hibbard J. E., 2000, in ASP Conf. Ser. 197: Dynamics of Galaxies: from the Early Universe to the Present Mergers of Galaxies from an HI Perspective. p. 285
- Huchra & Geller (1982) Huchra J. P., Geller M. J., 1982, ApJ, 257, 423
- Impey & Bothun (1997) Impey C., Bothun G., 1997, Ann. Rev. Astron. Astrophys., 35, 267
- Karachentsev et al. (1999) Karachentsev I. D., Karachentseva V. E., Kudrya Y. N., Sharina M. E., Parnovsky S. L., 1999, Bull. Special Astrophys. Obs., 47, 5
- Kennicutt (1989) Kennicutt R. C., 1989, ApJ, 344, 685
- Kilborn et al. (2000) Kilborn V. A., Staveley-Smith L., Marquarding M., Webster R. L., Malin D. F., Banks G. D., Bhathal R., de Blok W. J. G., Boyce P. J., Disney M. J., Drinkwater, M. J., Ekers, R. D., Freeman, K. C., Gibson, B. K., Henning, P. A., Jerjen, H., Knezek, P. M., Koribalski, B., Minchin, R. F., Mould, J. R., Oosterloo, T., Price, R. M., Putman, M. E., Ryder, S. D., Sadler, E. M., Stewart, I., Stootman, F., Wright, A. E., 2000, AJ, 120, 1342
- Killeen (1995) Killeen N. E. B., 1995, Technical report, ATNF ATCA Data Information Report 17. Australia Telescope National Facility
- Lang et al. (2003) Lang R. H., Boyce P. J., Kilborn V. A., Minchin R. F., Disney M. J., Jordan C. A., Grossi M., Garcia D. A., Freeman K. C., Phillipps S., Wright A. E., 2003, MNRAS, 342, 738
- Lasker & McLean (1994) Lasker B. M., McLean B. J., 1994, ST ScI Newsletter, 11, 39
- Marcolini et al. (2003) Marcolini A., Brighenti F., D’Ercole A., 2003, MNRAS, 345, 1329
- Materne (1978) Materne J., 1978, A&A, 63, 401
- Meyer et al. (2004) Meyer et al. 2004, submitted
- Miles et al. (2004) Miles T., Raychaudhury S., Forbes D., Goudfrooij P., 2004, MNRAS, submitted
- Moore et al. (1999) Moore B., Ghigna S., Governato F., Lake G., Quinn T., Stadel J., Tozzi P., 1999, ApJ, 524, L19
- Mundell et al. (1995) Mundell C. G., Pedlar A., Axon D. J., Meaburn J., Unger S. W., 1995, MNRAS, 277, 641
- Osmond & Ponman (2004) Osmond J. P. F., Ponman T. J., 2004, MNRAS
- Reif et al. (1978) Reif K., Mebold U., Goss W. M., 1978, A&A, 67, L1
- Reynolds (1994) Reynolds J., 1994, Technical report, A Revised Flux Scale for the AT Compact Array. Australia Telescope National Facility
- Roberts (1969) Roberts M. S., 1969, AJ, 74, 859
- Roberts & Haynes (1994) Roberts M. S., Haynes M. P., 1994, Ann. Rev. Astron. Astrophys., 32, 115
- Sault et al. (1995) Sault R. J., Teuben P. J., Wright M. C. H., 1995, in Shaw R., Payne H. E., eds, ASP Conf. Ser. 77: Astronomical Data Analysis Software and Systems IV Vol. 77 of ASP Conf. Ser., A Retrospective View of MIRIAD. pp 433–436
- Schlegel et al. (1998) Schlegel D. J., Finkbeiner D. P., Davis M., 1998, ApJ, 500, 525
- Staveley-Smith & Davies (1987) Staveley-Smith L., Davies R. D., 1987, MNRAS, 224, 953
- Staveley-Smith et al. (1996) Staveley-Smith L., Wilson W. E., Bird T. S., Disney M. J., Ekers R. D., Freeman K. C., Haynes R. F., Sinclair M. W., Vaile R. A., Webster R. L., Wright A. E., 1996, Proc. Astr. Soc. Aust., 13, 243
- Swaters & Balcells (2002) Swaters R. A., Balcells M., 2002, A&A, 390, 863
- Taylor et al. (1993) Taylor C. L., Brinks E., Skillman E. D., 1993, AJ, 105, 128
- Tifft & Cocke (1988) Tifft W. G., Cocke W. J., 1988, ApJS, 67, 1
- Tully (1987) Tully R. B., 1987, ApJ, 321, 280
- Tully (1988) Tully R. B., 1988, Nearby galaxies catalog. Cambridge University Press
- van Gorkom et al. (1986) van Gorkom J. H., Knapp G. R., Raimond E., Faber S. M., Gallagher J. S., 1986, AJ, 91, 791
- Wilcots & Hunter (2002) Wilcots E. M., Hunter D. A., 2002, AJ, 123, 1476