A Quasar Without Broad Ly Emission
Abstract
The quasar SDSS J095253.83+011421.9 exhibits broad metal-line emission (C iv FWHM9000 km s-1), but broad Ly emission is not present. Instead, only a narrow Ly line is observed (FWHM1140 km s-1). The large C iv/Ly ratio in the broad-line region (BLR) emission from this object can be matched most closely by a BLR dominated by gas at very high densities ( cm-3), which suppresses the Ly emission, and illuminated by an incident power-law extending to 200 µm, which yields increased emission from purely collisionally excited coolant lines (such as C iv, N v and O vi) but not from recombination lines like Ly. However, the strong C iii emission predicted by this model is not observed, and the observed broad C iii] emission must come from a lower-density BLR component and should be accompanied by broad Ly emission which is not observed. The least unlikely explanation for this spectrum seems to be that any intrinsic broad Ly emission is removed by smooth N v absorption in the red wing of the Ly emission line and by smooth Ly absorption in the blue wing of the Ly emission line. This postulated smooth absorption would be in addition to the strong, associated, narrow absorption seen in numerous ions. Smooth absorption in Ly, N v and O vi but not in C iv would be unusual, but not impossible, although it is suspicious that the postulated absorption must almost exactly cancel the postulated intrinsic broad emission. We conclude that the spectrum of SDSS J0952+0114 appears unique (among 3600 SDSS spectra of quasars at ) because of some combination of unusual parameters, and we discuss possible observations to determine the combination of circumstances responsible for the spectrum.
SDSS Publication #269 — Submitted to AJ Feb. 9, 2004; Accepted May 12, 2004 \submitted
1 Introduction
One of the goals of the Sloan Digital Sky Survey (SDSS; York et al. 2000) is to obtain spectra for 105 quasars, in addition to the galaxies which comprise the bulk of the spectroscopic targets. From astrometrically calibrated drift-scanned imaging data (Gunn et al. 1998; Pier et al. 2003) on the SDSS AB asinh magnitude system (Fukugita et al. 1996; Lupton, Gunn, & Szalay 1999; Hogg et al. 2001; Stoughton et al. 2002; Smith et al. 2002), quasar candidates are selected primarily using color criteria designed to target objects whose broad-band colors are different from those of normal stars and galaxies (Richards et al. 2002).
The First Data Release of the SDSS (DR1; Abazajian et al. 2003) includes fluxed, wavelength-calibrated spectra of 17,000 quasars (Schneider et al. 2003). This enormous sample includes some quasars with unusual properties. One example is SDSS J095253.83+011421.9 (hereafter SDSS J0952+0114), whose spectrum shows both broad and narrow metal-line emission but only narrow Ly emission (Fig. 1). In this paper we investigate possible explanations for the missing broad Ly in SDSS J0952+0114, namely: dust in the broad-line gas (§ 3.1), anisotropic Ly emission (§ 3.2), broad-line gas with unusual physical properties such that Ly is intrinsically weak (§ 3.3), an unusual spectrum incident on the broad-line region (§ 3.4), or an absorption effect wherein N v and Ly absorption remove the red and blue wings of broad Ly, respectively (§ 3.5). We summarize our conclusions in § 4.
2 Observations and Basic Parameters
Relevant instrumental and observational details of the SDSS can be found in Schneider et al. (2003). Here we simply summarize the results on SDSS J0952+0114, which was targeted for spectroscopy as a quasar candidate. It was undetected in the FIRST survey (Becker, White, & Helfand 1995), and with a magnitude of (Schneider et al. 2003) it is radio-quiet, with radio-loudness parameter (Ivezić et al. 2002).
Spectra were obtained twice using the SDSS spectrographs, on Modified Julian Dates 51608 and 51908, in very similar seeing conditions. The latest spectrophotometrically calibrated versions of these spectra111The earlier versions of the spectra published in the SDSS DR1 (http://www.sdss.org/dr1/) show a 15% flux difference due to spectrophotometric calibration errors (Abazajian et al. 2004). differ in that the continuum of the earlier spectrum is significantly bluer (see below). For our analysis, we coadded the latest versions of the two SDSS spectra of SDSS J0952+0114, weighting by the inverse variance at each pixel (Fig. 1). We adopted a systemic redshift of from an initial fit to the narrow components of Ly, N v, and C iii]. This redshift is statistically identical to the given in Schneider et al. (2003). We fit a power law from 1348 Å to 2257 Å rest frame, excluding broad emission line wavelength regions listed in Table 2 of Vanden Berk et al. (2001), hereafter V01. We found a best-fit power-law spectral index () of . This uncertainty is conservative in the sense that it assumes that the different exponents for power-law fits to the individual SDSS spectra ( and , respectively) are caused entirely by spectrophotometric errors, when in fact they could be caused entirely by variability. Between Ly and N v there is a window 1350 km s-1 wide where the observed spectrum matches this power-law continuum fit (see Fig. 2), which indicates that the Ly and N v emission lines are not significantly blended. We normalized the spectrum by our power-law fit to the continuum before analyzing the emission and absorption lines in detail (see § 3.5.1).
Figure 1 shows that SDSS J0952+0114 has a narrow emission-line component (seen in Ly, C iv, and other metal lines) plus an asymmetric, broad emission-line component seen in N v, C iv and C iii] but not in Ly. Emission lines in individual quasars have similar but not necessarily identical profiles. Just how much of an outlier SDSS J0952+0114 is in the distribution of relative linewidths would require a detailed study of the SDSS quasar sample beyond the scope of this paper. In any case, no other similarly extreme spectrum exists among the 3600 quasars in the SDSS Data Release Two for which Ly falls within the spectral coverage of the SDSS spectrographs ().
3 Possible Models for SDSS J0952+0114
3.1 Dust in the Broad-Line Region (BLR)?
If the gas responsible for the broad components of the emission lines contains dust, and has a sufficient optical depth to Ly at all velocities, the broad-component Ly photons could be destroyed by the dust before escaping. (Ly is a resonance line — a strong, permitted transition from the ground state of an ion — and thus has a small mean free path for absorption or scattering.) This effect cannot be ruled out, but it appears unlikely for several reasons. Most dust cannot survive long in typical high-density, high-ionization BLR conditions (Laor & Draine 1993) and would be more likely to be found in the narrow-component gas, given the trend for narrower lines to arise farther from the central engine (Peterson & Wandel 2000). There may be rare cases of objects with transient dust in their BLR, since dust destruction is not instantaneous. However, N v 1238,1242 and C iv 1548,1550 are also resonance lines that should be affected by dust. That is, dust by itself cannot make the C iv/Ly or N v/Ly ratios arbitrarily large (at least not without reducing all the lines’ equivalent widths far below their observed values). Narrow-line AGNs with weak Ly attributed to resonant scattering and destruction by dust, rather than just to Ly absorption, have C iv/Ly 1.4 (Dey, Spinrad, & Dickinson 1995; De Breuck et al. 2001; Dawson et al. 2003). This is much smaller than the C iv/Ly measured for the blueshifted broad-component gas in SDSS J0952+0114, at km s-1. Therefore, while dust could contribute to the weakness of the broad Ly in SDSS J0952+0114, it is not likely to be the dominant effect.
3.2 Anisotropic Emission?
If the broad-component gas contains a hydrogen ionization front, the Ly will be emitted only from the illuminated face of the cloud (with source function ), while C iv can be emitted more isotropically. For example, with cm-2, log ( is the ratio of ionizing photon to total hydrogen densities), and densities cm-3, C iv is nearly isotropic and will have a rest-frame equivalent width approximately equal to that observed in SDSS J0952+0114 (see § 2.6 and Fig. 7 of Korista et al. 1997a). Given such conditions, it may be possible to construct kinematic BLR models such that from some viewing directions the Ly profile is dramatically narrower than the C iv profile.
A full study of this possibility would require coupling photoionization studies incorporating anisotropic emission with specific geometric and kinematical models of the BLR. However, after consideration of numerous toy models, we do not believe that the spectrum of SDSS J0952+0114 can be reproduced by recourse solely to anisotropic emission. The most anisotropic toy model is one where the BLR is a wind flowing off an optically thick accretion disk at a 45° angle with velocity and is viewed at that same angle above the disk. Because of the anisotropy of Ly, the part of the wind nearest to us (azimuthal angle ) does not emit Ly along our sightline, only isotropic C iv (blueshifted by velocity ). The part of the wind farthest from us () emits Ly as well as C iv along our sightline, with zero projected velocity and only turbulent broadening, since our sightline is normal to the outflow direction there. Summed over all , this model produces blueshifted C iv emission which is broader than Ly. However, it cannot produce the red wing of the C iv emission line, which is redshifted relative to Ly. Nor can it produce Ly narrow enough to match the observations: the maximum observed C iv emission velocity (9000 km s-1) corresponds to in this model, and at a line of sight velocity of the Ly emission is down from its peak strength by only a factor of , compared to a factor of in the observed spectrum. Similarly, a central obscuring disk embedded in an outflowing, ionization-stratified BLR can produce a blue wing of C iv without strong Ly (Fig. 26 of Netzer 1990) — essentially by making the emission anisotropic after the fact — but it cannot produce a broad red wing of C iv without Ly, nor can it explain linewidth differences as large as seen in SDSS J0952+0114. Thus, anisotropic Ly emission alone is unlikely to explain the unusual spectrum of SDSS J0952+0114.
3.3 Unusual Physical Conditions in the Broad Line Region?
Korista et al. (1997a) have used the photoionization code CLOUDY (Ferland et al. 1998) to compile plots of predicted quasar BLR emission-line rest-frame equivalent widths (REWs) as functions of the column density, incident ionizing spectrum, and metal abundance of the emitting gas clouds. We used these plots to investigate whether significant N v, C iv, and C iii] emission without accompanying Ly emission is expected to occur anywhere in the range of parameter space occupied by typical quasar BLRs. We were unable to find any regions of parameter space which simultaneously met the observed constraints on the total REW, REW and the line ratio C iv/Ly.
It is interesting to compare these results with detailed modelling of the quasar Q 0207398 by Ferland et al. (1996). Q 0207398 has a very broad emission component with C iv/Ly (Baldwin et al. 1996). The CLOUDY simulations of Ferland et al. (1996) and our own CLOUDY simulations show that a C iv/Ly ratio of is the maximum which can be produced over a wide range of for metallicities between half and five times solar. Thus, the measured C iv/Ly in the broad emission component of SDSS J0952+0114 cannot be explained in the same manner as the C iv/Ly of Q 0207398. Dust destruction of Ly will not substantially increase the maximum C iv/Ly ratio because the maximum ratio only occurs for optically thin clouds in which hydrogen is fully ionized and Ly photons are not resonantly trapped. Ly photons are therefore more likely to escape from such clouds than to be destroyed by dust.
However, the above results come from photoionization simulations which extend only to densities cm-3 and column densities cm-2, and different behavior may be seen when both parameters are an order of magnitude or more larger. Ly/H ratios 100 times lower than the typical observed value of 10 (Ferland 1999) can be produced in photoionization simulations of accretion disks reaching cm-2 and cm-3 (Rokaki, Boisson, & Collin-Souffrin 1992). Ly photons are trapped by resonant scattering at such high column densities, and as the density increases above cm-3 the Ly REW steadily decreases due to increasing collisional deexcitation of the level of H I and bound-free absorption by neutral metals or H I in an level (see § 3.3 of Dumont & Collin-Souffrin 1990 or Fig. 5 of Ferland 1999). Evidence for emission from gas at such high densities has previously been found by Halpern et al. (1996) in the broad-line radio galaxy Arp 102B, which shows broad, double-peaked emission line components in H and C iv but only single-peaked emission in Ly (their Fig. 3).
To test the viability of high-, high- models for SDSS J0952+0114, we ran photoionization simulations with CLOUDY (using its standard incident AGN spectrum) for densities up to cm-3 and column densities up to cm-2 over a wide range of ionization parameters. The highest C iv/Ly ratio we found for optically thick clouds with H I ionization fronts ( cm-2) was C iv/Ly6, for cm-3 and . (Increasing the column density above the optically thick limit does not affect C iv/Ly, though it may affect ratios of low-ionization line strengths relative to Ly.) However, even with 100% covering of the ionizing source by the BLR, the REW for such models is only 0.9–3.8 Å. This is at least an order of magnitude lower than the broad component REW=42 Å observed in SDSS J0952+0114. Slightly higher C iv/Ly ratios (8) can be reached in clouds with column densities an order of magnitude below the optically thick limit, but the REW discrepancies are even worse in such cases. The ‘best fit’ modelled and observed numbers could be reconciled only if the continuum flux in SDSS J0952+0114 was suppressed by at least an order of magnitude, but there is no evidence that is the case. We conclude that high densities alone cannot simultaneously explain the abnormal C iv/Ly line ratio and the normal C iv and Ly REWs in SDSS J0952+0114.
3.4 An Unusual Spectrum Incident on the BLR?
The C iv/Ly ratio in the broad-line gas in SDSS J0952+0114 is a factor of 2.50.8 higher than in our ‘best fit’ photoionization model ( cm-3, cm-2 and ), and the C iv REW is at least an order of magnitude higher. Ferland (1999) discusses the spectrum of an ionized cloud as a function of additional physical parameters besides those considered in Korista et al. (1997a). Unusual values of such additional parameters might help explain the observations. Inspection of the various plots in Ferland (1999) shows that the only parameter which might substantially affect the observables C iv/Ly and REW is the assumed long-wavelength cutoff wavelength of the incident power-law (his Fig. 3). Extending this cutoff from its arbitrary default value of 0.912 µm to 200 µm would increase C iv/Ly by a factor of two or more, and REW by a factor of five or more. The greater infrared flux increases the temperature of the gas through free-free heating without increasing its ionization. For a sufficiently long cutoff wavelength (200 µm), the flux from purely collisionally excited coolant lines like C iv, N v and O vi increases more than the flux from recombination lines like Ly (though Ly can be collisionally excited as well, of course). The SED required by this scenario is consistent with the observed range of quasar SEDs (Elvis et al. 1994). The putative far-IR power-law cannot extend to radio wavelengths, however, since SDSS J0952+0114 is radio-quiet.
The emission-line REWs of SDSS J0952+0114 are mostly consistent with this scenario. Compared to the composite SDSS quasar spectrum of Vanden Berk et al. (2001), SDSS J0952+0114 has a total Ly REW a factor of three smaller than average and a total C iv REW a factor of three higher. However, the REW of the broad C iii] emission is quite high, and such emission cannot arise in high density gas since the upper state of that transition is collisionally deexcited at densities cm-3 (conversely, C iii 977 Å is a strong coolant at high densities but is not observed to be unusually strong here). Moreover, broad C iii] emission should be accompanied by broad Ly emission with at least Ly/C iii]=5, which is inconsistent with observations.
We can think of two explanations for this discrepancy. The first is a decrease in the BLR gas density at the H I ionization front where the C iii] emissivity is highest, which would maximize the observed ratio of C iii]/Ly. Coupled with high densities in the BLR up to the H I ionization front and an incident power-law extending well into the far-IR, this scenario might simultaneously explain the unusually large broad-line C iv/Ly ratio, the low Ly REW, and the observed broad C iii]. However, it still predicts much stronger C iii 977 Å emission than observed, and a model which invokes such a specific and ad hoc combination of parameters cannot be considered robust, even for a uniquely unusual quasar from a sample of 3600.
The second possible explanation for the lack of broad Ly accompanying the observed broad C iii] is that the broad Ly exists but is hidden by absorption, a possibility we consider in detail in the next section.
3.5 Intrinsic Absorption?
SDSS J0952+0114 may have a Ly profile which merely appears narrow due to moderately broad, blueshifted absorption from Ly (in the blue wing of the Ly emission line) and from N v (in the red wing of the Ly emission line). Such absorption could originate in the host galaxy or in an outflow related to the quasar. To investigate this possibility, we modelled the emission and absorption lines seen in SDSS J0952+0114.
3.5.1 Fitting the Spectrum
A single Gaussian was used to represent the profile of each absorption line and of most emission lines. Some emission lines required more than one Gaussian: two were used for C iii], and three for Ly, N v, Si iv and C iv (three components are often used to model quasar emission lines; see, e.g., Brotherton et al. 1994). Strong emission lines from Table 2 of V01 were included in the fit, along with a broad Gaussian near 1600 Å (to fit Fe ii multiplets there) and another near 1280 Å (presumably due to Fe ii multiplet UV9). The parameters of the emission and absorption line fits are given in Tables 1 and 2, respectively.222We tentatively detect emission from O V] 1218.344 on the red shoulder of Ly, with FWHM=300 km s-1. Highly ionized gas is expected to have 0.1O V]/Ly0.3 (Ferland et al. 1992) or, equivalently, O V]/N V1 (Shields 1994). Because O V] is located only 657 km s-1 longward of Ly, previously only limits have been put on its strength (e.g., O V]/Ly3-10% for the five low-redshift quasars studied by Laor et al. 1994). For the narrow emission-line component of SDSS J0952+0114, our value of O V]/Ly0.08 is barely consistent with predictions. For the broad emission-line component, the Shields (1994) prediction of O V]/N V1 is ruled out — we do not detect any broad emission attributable to O V] (or Ly). Either the photoionization models are inaccurate, the broad emission-line component in SDSS J0952+0114 does not arise in optically thin high-ionization gas, or some mechanism such as overlying absorption is suppressing broad O V] along with broad Ly. We identify five blueshifted absorption systems, denoted A–E, in SDSS J0952+0114. The narrow absorption in the spectrum is shown in detail in Figure 2 and is discussed in detail in Appendix A.
3.5.2 Line Profiles Corrected for Narrow Absorption
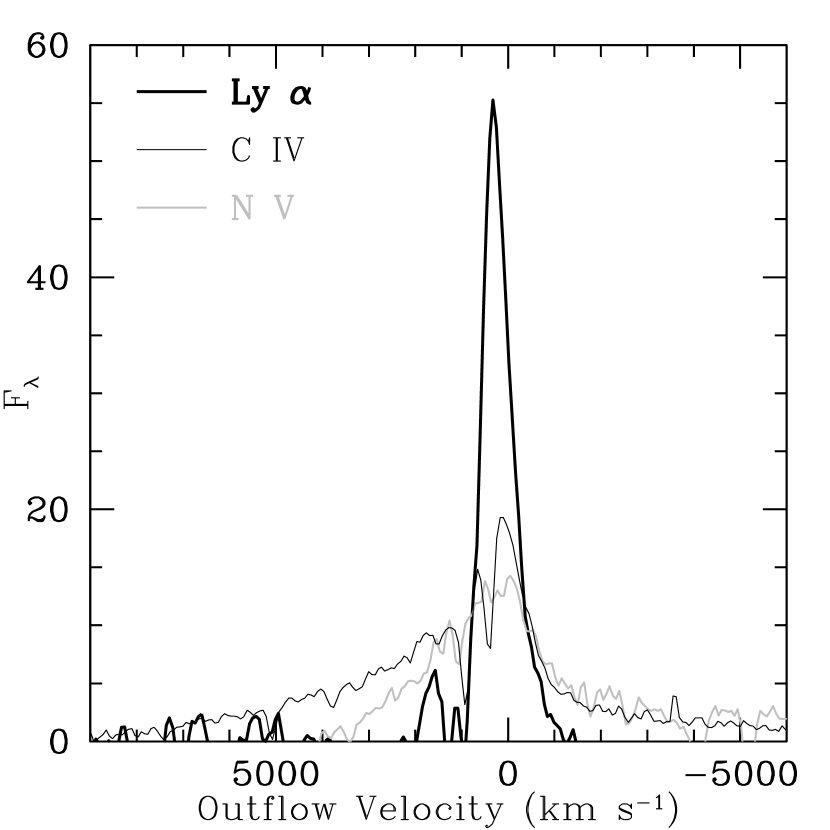
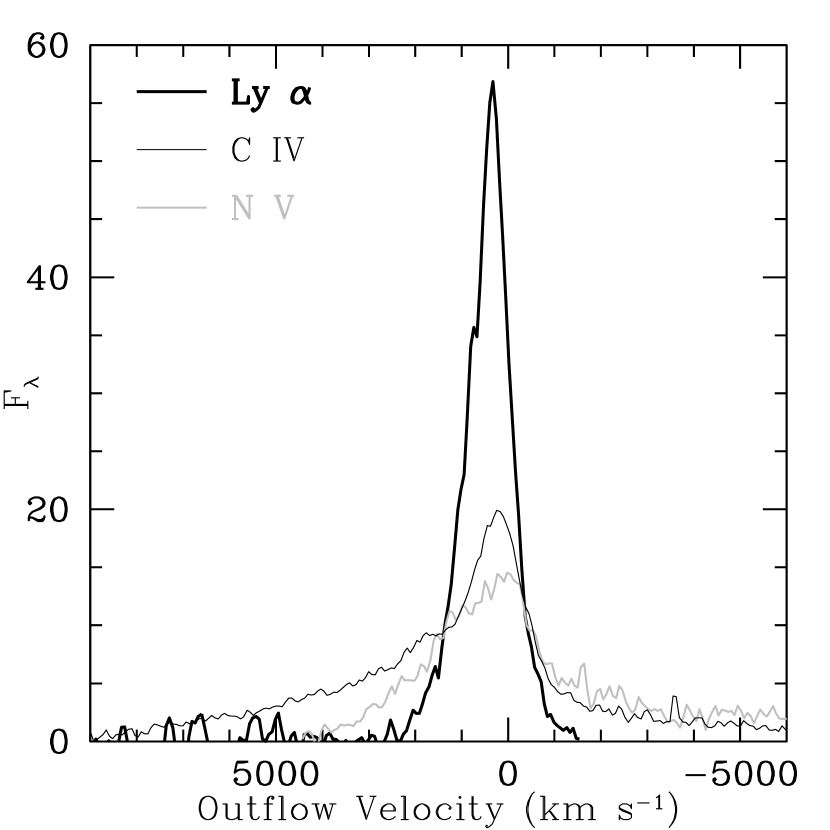
To study the unabsorbed line profiles, we “repaired” the spectrum by reversing the sign of the amplitude of our single-Gaussian fits to the absorption lines and adding those Gaussians to the observed spectrum. The “repaired” spectrum is therefore our best estimate of the spectrum as it would have been seen without narrow absorption. Figure 3a plots the Ly, C iv and N v regions of the raw spectrum of SDSS J0952+0114 as a function of outflow velocity relative to their laboratory wavelengths (Table 2 of V01) at . The same plot using the “repaired” spectrum is shown in Figure 3b. Even after removing the effects of narrow, associated absorption, Ly is narrower than either C iv or N v. These figures also show that the C iv emission line has a strong blue wing, extending to 9000 km s-1, which is not seen in Ly or N v.
3.5.3 Additional Smooth Absorption?
Fitting the emission and narrow absorption lines in SDSS J0952+0114 with Gaussians has not revealed an intrinsic Ly emission profile as broad as that of C iii], let alone C iv. However, there is some suggestion in Figure 3b that there may be additional smooth absorption in Ly and N v. The N v and C iv emission profiles agree longward of the emission-line peaks, and the Ly profile has five maxima at kms which approach the C iv profile, though these maxima may just be noise. Smooth absorption at km s-1 in Ly and N v but not in C iv could bring the intrinsic profiles of all three lines into agreement. Such absorption is possible: N v and O vi have very similar ionization potentials and will be present in the same gas, but C iv has a lower ionization potential and will not necessarily accompany them.
To test this scenario, we assume that there is no smooth absorption in C iv and that our repaired C iv emission-line profile represents the intrinsic profile of all emission lines in SDSS J0952+0114. We shifted, scaled and added the repaired C iv profile to our power-law continuum fit to the observed spectrum to best match the observed peaks of O vi, N v and Ly as follows. We reconstructed O vi as two doublets, each with 75% of the total C iv flux, then multiplied the reconstructed spectrum at those wavelengths by 0.75 to match the surrounding continuum and thus account for Ly forest absorption. We reconstructed N v as two doublets, each wth 45% of the total C iv flux, and broad Ly as a single line with flux equal to that of C iv.
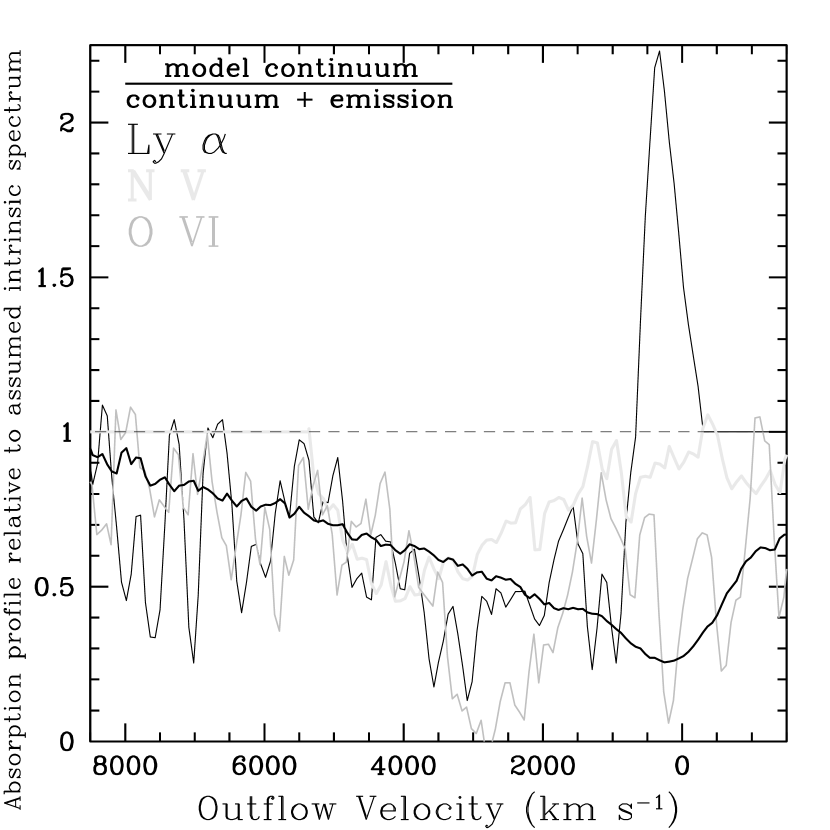
We then divided the observed spectrum by this assumed intrinsic spectrum. The result is an estimate of the total absorption profile required to explain the observed line profiles of Ly, N v and O vi as a function of velocity. Figure 4 shows these total absorption profiles, aligned using the shorter-wavelength member of each doublet line so that the high-velocity edges of absorption features can be compared in different lines. As suggested above, Ly at km s-1 is consistent with a recovery to an intrinsic profile matching C iv (the horizontal line), punctuated by narrow Ly forest absorption. In the outflow velocity region km s-1, we have reliable information on all three lines. (At higher velocities N v is confused with Ly, and at lower velocities O vi is confused with a Ly trough which reaches zero flux; see Fig. 2 and Appendix A.) At km s-1, all three absorption profiles are consistent with the darkest line, which is the absorption profile needed to completely remove the repaired C iv emission-line profile. In other words, if we assume the intrinsic emission profile in O vi, Ly and N v equals that of C iv, to match the observations in those lines requires absorption which exactly cancels the assumed emission at velocities km s-1 (and also at velocities km s-1 in O vi).
Broad absorption line troughs have never been seen to unambiguously cover only the BLR and not the continuum source, which is understandable since the BLR is thought to surround the much smaller continuum source. Thus, if smooth absorption is really present in Ly and N v but not in C iv, which is already unusual, the absorption profiles must also almost exactly cancel out the emission profiles, by remarkable coincidence.
Additionally, if smooth absorption is present, it appears to have different profiles in Ly and N v, with different covering factors (assuming the absorption is saturated) at velocities km s-1, at least. This would not be unusual, but is only a tentative result. The absorption profiles are systematically uncertain because of the assumption that the intrinsic emission-line profiles are identical to the repaired C iv profile.
In summary, the evidence for additional smooth absorption in SDSS J0952+0114 is mixed. Gas outflowing at 600-5500 km s-1 absorbing in O vi, N v and Ly (but not in C iv, which is unusual) with peak fractional absorptions of 45% can reconcile those lines’ observed emission-line profiles with intrinsic profiles matching the repaired profile of C iv. However, the smooth, strong absorption would have to almost exactly cancel the broad emission, at least at velocities km s-1. The arguments for smooth absorption are that the red wing of N v matches the red wing of C iv, Ly may recover to the C iv profile in its far blue wing, and the lack of broad O V] and broad Ly which should accompany broad N v and broad C iii], respectively, is difficult to explain except via absorption.
4 Conclusions
We have discussed the unusual spectrum of SDSS J0952+0114, which exhibits broad metal-line emission but only narrow Ly emission. We argue that this unusual spectrum cannot be solely due to dust extinction in the BLR, to anisotropic emission of Ly, or to unusual physical conditions in the BLR. Most but not all of the spectrum’s properties are explainable as emission from a BLR of predominantly high density gas ( cm-3), which suppresses Ly, illuminated by an incident power-law continuum extending to 200 µm, which increases the collisionally excited metal-line emission. However, the BLR in SDSS J0952+0114 cannot consist exclusively of high density gas because the observed broad C iii] emission would be collisionally deexcited at densities higher than cm-3.
Although it is not entirely satisfactory, the most plausible explanation we have found for the apparent lack of broad Ly is that it is due to smooth absorption by N v in the red wing of Ly and by Ly in the blue wing of Ly. Such absorption must be in addition to the complex, narrow intrinsic absorption system seen, would have to almost exactly cancel the intrinsic broad emission (which might mean that it is the first known example of a broad absorption line trough which covers the BLR but not the continuum source), and must be present in O vi, N v and Ly but not in Si iv or in C iv, which is quite unusual. In any case, it seems that some combination of unusual parameters is required to explain SDSS J0952+0114, which helps explain why its spectrum is one of a kind.
The X-ray spectrum of SDSS J0952+0114 should consist of a typical power-law plus absorption if the postulated highly-ionized, smooth absorption is real. On the other hand, if its line ratios are largely intrinsic and the trends of C iv/Ly with other observables found by Wills et al. (1999) can be extrapolated over an order of magnitude to apply to SDSS J0952+0114, it should have a very soft X-ray spectrum, a very broad H line, weak optical Fe ii emission, and strong [O iii] emission. Wills et al. (1999) suggest all these trends may derive from a small Eddington parameter (the accretion rate relative to the Eddington rate). While SDSS J0952+0114 may not provide direct insight on the typical quasar BLR if it is indeed a high-density BLR illuminated by an unusual SED, it does help delineate the range of physical parameter space which BLRs occupy and which must therefore be incorporated into BLR models. For example, quasar broad-line C iv/Ly ratios may be strongly affected by free-free heating of the BLR, but as Ferland (1999) point out, very little work has been done to investigate the effects of free-free heating on quasar spectra, despite the fact that it can have a greater effect on the observed spectrum than the incident X-ray continuum.
The most useful future observation of SDSS J0952+0114 would probably be flux-calibrated spectroscopy at higher resolution to better determine the true profiles of the emission lines, and thus the presence or absence of smooth absorption, by reducing the confusing effects of the many narrow absorption lines present (and also to enable physical modeling of the narrow, associated absorbers). It would also be valuable to obtain an X-ray hardness ratio measurement and near-IR spectroscopy of Mg ii, H and H. And if SDSS J0952+0114 has a BLR exposed to a power-law continuum extending from X-ray wavelengths to 200 µm, or 800 µm observed, SCUBA or Spitzer photometry at those wavelengths could search for that continuum directly (with the caveat that there is good evidence that the continuum illuminating the BLR in quasars can be different from the continuum seen along our lines of sight to individual quasars; Korista, Ferland, & Baldwin 1997b).
Appendix A Details of the Narrow Associated Absorbers
We identify five associated (and two intervening) narrow absorption systems in SDSS J0952+0114 and denote them A through E in order of increasing outflow velocity. A higher-resolution spectrum with a high signal-to-noise ratio is needed to study these absorbers in detail and eliminate the numerous ambiguities due to blending. The absorption around the O vi emission line is particularly complex, and suffers from Ly forest contamination as well. The strongest associated absorption system (A) includes rare, excited, metastable O i*, C ii* and Si ii* lines (though the putative Si ii* 1533 seems anomalously weak) and is blueshifted by 770100 km s-1 from the systemic redshift, neglecting the global uncertainty in the latter. System B at 131010 km s-1 (which also includes C ii* absorption) exhibits line-locking with system A (Scargle 1973; Braun & Milgrom 1989), since the velocity difference km s-1 is consistent with the velocity separation of the C iv doublet (497 km s-1). There is also Ly absorption at km s-1. There may be C iv absorption at km s-1, possibly accompanied by Ly (the putative C iv 1548 is blended with Si ii* 1533 from system A, and the putative Ly with Si iii 1206.5 absorption from system B). Finally, there is Ly, Ly, N v and possibly O vi absorption at km s-1.
One complication with modelling the absorption systems is that at least some of them exhibit full covering of the continuum source but only partial covering of the emission-line region, a common feature in intrinsic absorption systems (e.g., Hamann et al. 1997). At the wavelength of the blended Ly absorption from systems A and B (; see Table 2), the residual flux over 2-3 resolution elements is consistent with zero (measuring 2.65.6% of the normalized intrinsic spectrum), and similarly at Ly. However, the residual flux in Ly at the same redshift measures much more than 2.6% of the estimated intrinsic spectrum at that wavelength. This discrepancy can be explained if the absorption covers the continuum source but not the Ly emission-line region. These different covering factors do not greatly affect the fitting but might affect the interpretation of absorption doublet line ratios near emission lines.
The physical conditions in the various absorbers may be quite different. We derive an approximate value for each absorber by finding the value which produces a Voigt absorption profile whose FWHM equals the resolution-corrected FWHM of our fit to the system’s Ly absorption (see, e.g., Fig. 14 of Mas-Hesse et al. 2003). System A has log()18.7 cm-2, absorption from many low-ionization species (sufficiently strong to suggest solar metallicity), relatively weak O vi and N v absorption, and excited-state absorption indicating densities of at least cm-3. It may also contain dust: if the tentative 2026 Å absorption is real and is identified as Zn ii instead of Mg i, there may be accompanying Zn ii 2062, but there is no sign of Cr ii 2056 or Cr ii 2066. If confirmed by a better spectrum, this would indicate that Cr ii is depleted onto dust in the absorber. System B is detected in a range of ionization states from C ii to O vi, but there is no unambiguous evidence for excited-state absorption in it. System C is unambiguously detected only in Ly, probably due to a low column density. Systems D and E appear more highly ionized on average, with possible detections of O vi and C iv in the former and N v in the latter.
References
- Abazajian, Adelman-McCarthy, Agüeros, Allam, Anderson, Annis, Bahcall, Bahcall, & Baldry (2003) Abazajian, K. et al. 2003, AJ, 126, 2081
- Abazajian, Adelman-McCarthy, Agüeros, Allam, Anderson, Anderson, Annis, Bahcall, & Baldry (2004) Abazajian, K. et al., 2004, AJ, in press (astro-ph/0403325)
- Baldwin, Ferland, Korista, Carswell, Hamann, Phillips, Verner, Wilkes, & Williams (1996) Baldwin, J. A. et al. 1996, ApJ, 461, 664
- Becker, White, & Helfand (1995) Becker, R. H., White, R. L., & Helfand, D. J. 1995, ApJ, 450, 559
- Braun & Milgrom (1989) Braun, E. & Milgrom, M. 1989, ApJ, 342, 100
- Brotherton, Wills, Francis, & Steidel (1994) Brotherton, M., Wills, B., Francis, P., & Steidel, C. 1994, ApJ, 430, 495
- Dawson, McCrady, Stern, Eckart, Spinrad, Liu, & Graham (2003) Dawson, S., McCrady, N., Stern, D., Eckart, M. E., Spinrad, H., Liu, M. C., & Graham, J. R. 2003, AJ, 125, 1236
- De Breuck, van Breugel, Röttgering, Stern, Miley, de Vries, Stanford, Kurk, & Overzier (2001) De Breuck, C. et al. 2001, AJ, 121, 1241
- Dey, Spinrad, & Dickinson (1995) Dey, A., Spinrad, H., & Dickinson, M. 1995, ApJ, 440, 515
- Dumont & Collin-Souffrin (1990) Dumont, A. M. & Collin-Souffrin, S. 1990, A&A, 229, 313
- Elvis, Wilkes, McDowell, Green, Bechtold, Willner, Oey, Polomski, & Cutri (1994) Elvis, M. et al. 1994, ApJS, 95, 1
- Ferland (1999) Ferland, G. 1999, in Quasars and Cosmology, eds. G. Ferland & J. Baldwin, (San Francisco: ASP), 147
- Ferland, Peterson, Horne, Welsh, & Nahar (1992) Ferland, G., Peterson, B., Horne, K., Welsh, W., & Nahar, S. 1992, ApJ, 387, 95
- Ferland, Baldwin, Korista, Hamann, Carswell, Phillips, Wilkes, & Williams (1996) Ferland, G. J., Baldwin, J. A., Korista, K. T., Hamann, F., Carswell, R. F., Phillips, M., Wilkes, B., & Williams, R. E. 1996, ApJ, 461, 683
- Ferland, Korista, Verner, Ferguson, Kingdon, & Verner (1998) Ferland, G. J., Korista, K. T., Verner, D. A., Ferguson, J. W., Kingdon, J. B., & Verner, E. M. 1998, PASP, 110, 761
- Fukugita, Ichikawa, Gunn, Doi, Shimasaku, & Schneider (1996) Fukugita, M., Ichikawa, T., Gunn, J. E., Doi, M., Shimasaku, K., & Schneider, D. P. 1996, AJ, 111, 1748
- Gunn, Carr, Rockosi, Sekiguchi, Berry, Elms, de Haas, Ivezić , Knapp, Lupton, Pauls, Simcoe, Hirsch, Sanford, Wang, York, Harris, Annis, Bartozek, Boroski, Bakken, Haldeman, Kent, Holm, Holmgren, Petravick, Prosapio, Rechenmacher, Doi, Fukugita, Shimasaku, Okada, Hull, Siegmund, Mannery, Blouke, Heidtman, Schneider, Lucinio, & Brinkman (1998) Gunn, J. E. et al. 1998, AJ, 116, 3040
- Halpern, Eracleous, Filippenko, & Chen (1996) Halpern, J., Eracleous, M., Filippenko, A., & Chen, K. 1996, ApJ, 464, 704
- Hamann, Barlow, Junkkarinen, & Burbidge (1997) Hamann, F., Barlow, T., Junkkarinen, V., & Burbidge, E. 1997, ApJ, 478, 80
- Hogg, Finkbeiner, Schlegel, & Gunn (2001) Hogg, D., Finkbeiner, D., Schlegel, D., & Gunn, J. 2001, AJ, 122, 2129
- Ivezić, Menou, Knapp, Strauss, Lupton, Vanden Berk, Richards, Tremonti, Weinstein, Anderson, Bahcall, Becker, Bernardi, Blanton, Eisenstein, Fan, Finkbeiner, Finlator, Frieman, Gunn, Hall, Kim, Kinkhabwala, Narayanan, Rockosi, Schlegel, Schneider, Strateva, SubbaRao, Thakar, Voges, White, Yanny, Brinkmann, Doi, Fukugita, Hennessy, Munn, Nichol, & York (2002) Ivezić, Ž. et al. 2002, AJ, 124, 2364
- (22) Korista, K., Baldwin, J., Ferland, G., & Verner, D. 1997a, ApJS, 108, 401
- (23) Korista, K., Ferland, G., & Baldwin, J. 1997b, ApJ, 487, 555
- Laor, Bahcall, Jannuzi, Schneider, Green, & Hartig (1994) Laor, A., Bahcall, J. N., Jannuzi, B. T., Schneider, D. P., Green, R. F., & Hartig, G. F. 1994, ApJ, 420, 110
- Laor & Draine (1993) Laor, A. & Draine, B. T. 1993, ApJ, 402, 441
- Lupton, Gunn, & Szalay (1999) Lupton, R. H., Gunn, J. E., & Szalay, A. S. 1999, AJ, 118, 1406
- Mas-Hesse, Kunth, Tenorio-Tagle, Leitherer, Terlevich, & Terlevich (2003) Mas-Hesse, J., Kunth, D., Tenorio-Tagle, G., Leitherer, C., Terlevich, R., & Terlevich, E. 2003, ApJ, 598, 858
- Morton, York, & Jenkins (1988) Morton, D. C., York, D. G., & Jenkins, E. B. 1988, ApJS, 68, 449
- Netzer (1990) Netzer, H. 1990, in Active Galactic Nuclei, ed. R. Blandford, H. Netzer, L. Woltjer, T. Courvoisier, & M. Mayor (Berlin: Springer-Verlag), 57
- Ogle, Mason, Page, Salvi, Cordova, McHardy, & Priedhorsky (2004) Ogle, P. M., Mason, K. O., Page, M. J., Salvi, N. J., Cordova, F. A., McHardy, I. M., & Priedhorsky, W. C. 2004, ApJ, 606, 151
- Peterson & Wandel (2000) Peterson, B. M. & Wandel, A. 2000, ApJ, 540, L13
- Pier, Munn, Hindsley, Hennessy, Kent, Lupton, & Ivezić (2003) Pier, J. R., Munn, J. A., Hindsley, R. B., Hennessy, G. S., Kent, S. M., Lupton, R. H., & Ivezić, Ž. 2003, AJ, 125, 1559
- Richards, Fan, Newberg, Strauss, Vanden Berk, Schneider, Yanny, Boucher, & Burles (2002) Richards, G. T. et al. 2002, AJ, 123, 2945
- Rokaki, Boisson, & Collin-Souffrin (1992) Rokaki, E., Boisson, C., & Collin-Souffrin, S. 1992, A&A, 253, 57
- Scargle (1973) Scargle, J. D. 1973, ApJ, 179, 705
- Schneider, Fan, Hall, Jester, Richards, Stoughton, Strauss, SubbaRao, & Vanden Berk (2003) Schneider, D. P. et al. 2003, AJ, 126, 2579
- Shields (1994) Shields, J. C. 1994, in ASP Conf. Ser. 69: Reverberation Mapping of the Broad-Line Region in Active Galactic Nuclei, 293–314
- Smith, Tucker, Kent, Richmond, Fukugita, Ichikawa, Ichikawa, Jorgensen, Uomoto, Gunn, Hamabe, Watanabe, Tolea, Henden, Annis, Pier, McKay, Brinkmann, Chen, Holtzman, Shimasaku, & York (2002) Smith, J. A. et al. 2002, AJ, 123, 2121
- Stoughton, Lupton, Bernardi, Blanton, Burles, Castander, Connolly, Eisenstein, & Frieman (2002) Stoughton, C. et al. 2002, AJ, 123, 485
- Vanden Berk, Richards, Bauer, Strauss, Schneider, Heckman, York, Hall, Fan, Knapp, Anderson, Annis, Bahcall, Bernardi, Briggs, Brinkmann, Brunner, Burles, Carey, Castander, Connolly, Crocker, Csabai, Doi, Finkbeiner, Friedman, Frieman, Fukugita, Gunn, Hennessy, Ivezić, Kent, Kunszt, Lamb, Leger, Long, Loveday, Lupton, Meiksin, Merelli, Munn, Newberg, Newcomb, Nichol, Owen, Pier, Pope, Rockosi, Schlegel, Siegmund, Smee, Snir, Stoughton, Stubbs, SubbaRao, Szalay, Szokoly, Tremonti, Uomoto, Waddell, Yanny, & Zheng (2001) Vanden Berk, D. E. et al. 2001, AJ, 122, 549
- Wills, Laor, Brotherton, Wills, Wilkes, Ferland, & Shang (1999) Wills, B. J., Laor, A., Brotherton, M. S., Wills, D., Wilkes, B. J., Ferland, G. J., & Shang, Z. 1999, ApJ, 515, L53
- York, Adelman, Anderson, Anderson, Annis, Bahcall, Bakken, Barkhouser, Bastian, Berman, Boroski, Bracker, Briegel, Briggs, Brinkmann, Brunner, Burles, Carey, Carr, Castander, Chen, Colestock, Connolly, Crocker, Csabai, Czarapata, Davis, Doi, Dombeck, Eisenstein, Ellman, Elms, Evans, Fan, Federwitz, Fiscelli, Friedman, Frieman, Fukugita, Gillespie, Gunn, Gurbani, de Haas, Haldeman, Harris, Hayes, Heckman, Hennessy, Hindsley, Holm, Holmgren, Huang, Hull, Husby, Ichikawa, Ichikawa, Ivezić, Kent, Kim, Kinney, Klaene, Kleinman, Kleinman, Knapp, Korienek, Kron, Kunszt, Lamb, Lee, Leger, Limmongkol, Lindenmeyer, Long, Loomis, Loveday, Lucinio, Lupton, MacKinnon, Mannery, Mantsch, Margon, McGehee, McKay, Meiksin, Merelli, Monet, Munn, Narayanan, Nash, Neilsen, Neswold, Newberg, Nichol, Nicinski, Nonino, Okada, Okamura, Ostriker, Owen, Pauls, Peoples, Peterson, Petravick, Pier, Pope, Pordes, Prosapio, Rechenmacher, Quinn, Richards, Richmond, Rivetta, Rockosi, Ruthmansdorfer, Sandford, Schlegel, Schneider, Sekiguchi, Sergey, Shimasaku, Siegmund, Smee, Smith, Snedden, Stone, Stoughton, Strauss, Stubbs, SubbaRao, Szalay, Szapudi, Szokoly, Thakar, Tremonti, Tucker, Uomoto, Vanden Berk, Vogeley, Waddell, Wang, Watanabe, Weinberg, Yanny, & Yasuda (2000) York, D. G. et al. 2000, AJ, 120, 1579


| Line | aaVacuum rest wavelength in Å (Morton, York, & Jenkins 1988). We use the wavelengths given in Table 2 of Vanden Berk et al. (2001), except for cases of well-separated doublets and the two close blends noted in the table, for which we use the wavelengths in the same reference. | Redshift | FWHMbbRest-frame FWHM in km s-1. The rest frame used is that of the quasar (). The FWHM values have not been corrected for the instrumental FHWM of 150 km s-1. For most emission lines this correction is negligible. | REWccRest-frame Equivalent Width in Å. The uncertainties are propagated from the fractional uncertainty on the width or the peak of the Gaussian fit, whichever uncertainty is larger. The rest frames are the same as those used for the FWHM calculation. | FluxddFlux of each Gaussian emission-line component, in units of 10-17 ergs cm-2 s-1. | NoteseeEmission line blends are denoted ‘blend’. |
|---|---|---|---|---|---|---|
| Emission Line Components | ||||||
| C III | 977.02 | 3.02050.0007 | 47090 | 0.840.19 | 82 | |
| N III | 989.790 | 3.02050.0008 | 540110 | 0.980.26 | 92 | |
| O VI | 1033.03 | 3.02150.0006 | 218080 | 15.880.88 | 1388 | |
| Ly | 1215.6701 | 3.01080.0004 | 195030 | 7.641.25 | 529 | |
| 1215.6701 | 3.01440.0001 | 114010 | 22.031.17 | 1518 | ||
| 1215.6701 | 3.01640.0004 | 47010 | 4.720.86 | 326 | ||
| O V] | 1218.344 | 3.02040.0003 | 29070 | 0.370.11 | 31 | |
| N V | 1240.14 | 3.01040.0002 | 223020 | 9.991.02 | 667 | |
| 1240.14 | 3.02080.0002 | 70010 | 1.730.23 | 122 | ||
| 1240.14 | 3.02430.0004 | 540070 | 16.812.20 | 11215 | ||
| Si II | 1262.59 | 3.02390.0014 | 280040 | 3.360.47 | 223 | |
| O I/Si II | 1305.42 | 3.01590.0042 | 3000200 | 5.090.92 | 326 | blend |
| C II | 1335.30 | 3.00400.0016 | 2200300 | 3.450.97 | 216 | |
| Si IV/O IV] | 1398.33 | 2.99140.0061 | 100001300 | 6.740.90 | 385 | blend |
| Si IV | 1393.755 | 3.01530.0008 | 1000200 | 2.300.45 | 133 | |
| 1402.770 | 3.01430.0007 | 1300150 | 3.300.39 | 182 | ||
| C IV | 1549.06 | 2.99970.0010 | 9000100 | 41.620.77 | 2024 | |
| 1549.06 | 3.00310.0003 | 267070 | 13.040.36 | 632 | ||
| 1549.06 | 3.01780.0001 | 110020 | 14.590.34 | 712 | ||
| Fe II | 13000400 | 12.380.39 | 572 | |||
| He II | 1640.42 | 3.00910.0006 | 120080 | 2.060.12 | 91 | |
| O III] | 1663.48 | 3.01600.0015 | 3200150 | 3.180.16 | 141 | |
| Al II | 1721.89 | 3.02920.0018 | 1500400 | 0.870.22 | 41 | |
| N III] | 1750.26 | 3.01570.0014 | 2000300 | 1.630.27 | 71 | |
| Fe II | 1788.73 | 3.01170.0012 | 1900250 | 2.180.28 | 91 | |
| Al III | 1857.40 | 3.04110.0074 | 63001000 | 6.000.99 | 224 | |
| Si III] | 1892.03 | 3.01330.0049 | 700350 | 0.520.25 | 21 | |
| C III] | 1908.73 | 3.01310.0026 | 5500250 | 19.741.33 | 715 | |
| 1908.73 | 3.01410.0004 | 90070 | 4.390.32 | 161 | ||
Note. — Emission-line fluxes and REW values have been corrected for overlying associated absorption. All errors are statistical errors.
| Line | aaVacuum rest wavelength in Å (Morton, York, & Jenkins 1988). | Redshift | FWHMbbRest-frame FWHM in km s-1. For associated absorption lines, the rest frame used is that of the quasar (). For intervening absorption line systems, the rest frame redshift is listed in the table. The FWHM values have not been corrected for the instrumental FHWM of 150 km s-1. Absorption lines with measured FWHM150 km s-1 indicate detections of borderline significance. | REWccRest-frame Equivalent Width in Å. The uncertainties are propagated from the fractional uncertainty on the width or the peak of the Gaussian fit, whichever uncertainty is larger. The rest frames are the same as those used for the FWHM calculation. | NotesddSuccessive lines in the table denoted ‘blend’ are blended with each other. Blends between lines in different absorbers are also indicated. No attempt at separation has been made for either type of blend; naturally, the FWHM values for these blends are usually larger than for unblended lines. For Ly lines, approximate log() values are given in cm-2; see § 3.5.1. |
|---|---|---|---|---|---|
| Associated Absorber A, , km s-1 | |||||
| Ly | 972.5368 | 3.00970.0005 | 490140 | 1.930.65 | |
| Ly | 1025.7223 | 3.00560.0006 | 980100 | 2.920.30 | blend O I,Ly(B) |
| O VI | 1031.9265 | 3.01030.0002 | 24030 | 0.680.10 | |
| C II | 1036.3367 | 3.01090.0002 | 65030 | 5.390.29 | blend |
| C II* | 1037.0181 | 3.00830.0002 | 65030 | 5.390.29 | blend |
| O VI | 1037.6155 | 3.00600.0002 | 65030 | 5.390.29 | blend |
| O I | 1039.2304 | 3.01060.0003 | 14020 | 0.300.10 | |
| Si III | 1206.500 | 3.00910.0014 | 29020 | 0.850.23 | |
| Ly | 1215.6701 | 3.00840.0001 | 54030 | 8.310.53 | log()18.7 |
| N V | 1238.821 | 3.01000.0008 | 23010 | 0.610.17 | |
| N V | 1242.804 | 3.00910.0006 | 23010 | 0.240.09 | tentative |
| S II | 1250.583 | 3.00750.0004 | 34010 | 0.380.07 | |
| S II | 1253.808 | 3.00990.0005 | 1882 | 0.230.03 | |
| S II | 1259.519 | 3.00950.0002 | 1442 | 0.230.04 | |
| Si II | 1260.4223 | 3.00950.0004 | 2162 | 0.540.11 | blend Fe II 2374 (=1.1291) |
| Si II* | 1264.7377 | 3.01050.0007 | 22010 | 0.730.18 | blend Fe II 2382 (=1.1291) |
| O I | 1302.1685 | 3.00940.0003 | 28010 | 1.280.47 | |
| Si II | 1304.3711 | 3.01190.0004 | 33010 | 1.540.37 | blend |
| O I* | 1304.8576 | 3.01040.0004 | 33010 | 1.540.37 | blend |
| O I* | 1306.0286 | 3.00680.0004 | 33010 | 1.540.37 | blend |
| Si II* | 1309.2757 | 3.01250.0006 | 2834 | 0.460.08 | |
| C II | 1334.5323 | 3.01170.0005 | 49070 | 1.710.25 | blend |
| C II* | 1335.71 | 3.00820.0005 | 49070 | 1.710.25 | blend |
| Si IV | 1393.755 | 3.00990.0001 | 18030 | 0.670.11 | |
| Si IV | 1402.770 | 3.01020.0002 | 18020 | 0.550.08 | |
| Si II | 1526.7071 | 3.01030.0002 | 18010 | 0.530.04 | |
| Si II* | 1533.4312 | 3.01010.0002 | 17020 | 0.230.02 | blend C IV(D) |
| C IV | 1548.202 | 3.01010.0001 | 23010 | 2.240.12 | blend C IV(B) |
| C IV | 1550.774 | 3.01010.0001 | 23010 | 2.660.16 | |
| Fe II | 1608.4511 | 3.01060.0002 | 20040 | 0.340.07 | |
| Al II | 1670.7874 | 3.01030.0002 | 16010 | 0.410.04 | |
| Si II | 1808.0126 | 3.01030.0003 | 12050 | 0.190.07 | tentative |
| Al III | 1854.7164 | 3.01060.0002 | 7020 | 0.110.08 | tentative |
| Al III | 1862.7865 | 3.01140.0005 | 17060 | 0.170.07 | tentative |
| Mg I | 2026.4768 | 3.01010.0002 | 14060 | 0.280.13 | tentative |
| Associated Absorber B, , km s-1 | |||||
| Ly | 972.5368 | 3.00250.0005 | 27040 | 0.940.32 | |
| Ly | 1025.7223 | 3.00560.0006 | 980100 | 2.920.30 | blend Ly(A) |
| O VI | 1031.9265 | 3.00270.0003 | 10020 | 0.100.03 | |
| C II | 1036.3367 | 3.00100.0001 | 41010 | 3.270.15 | |
| O VI | 1037.6155 | 3.00600.0002 | 65030 | 5.390.29 | blend C II*,C II(A),O VI(A) |
| Si III | 1206.500 | 3.00280.0010 | 30030 | 0.750.17 | blend Ly(D) |
| Ly | 1215.6701 | 3.00250.0001 | 20020 | 1.140.22 | log()18 |
| C II | 1334.5323 | 3.00380.0011 | 620100 | 1.400.26 | blend |
| C II* | 1335.71 | 3.00030.0011 | 620100 | 1.400.26 | blend |
| C IV | 1548.202 | 3.00200.0001 | 11010 | 0.120.01 | |
| C IV | 1550.774 | 3.00340.0001 | 23010 | 2.240.12 | blend C IV(A) |
| Associated Absorber C, , km s-1 | |||||
| Ly | 1215.6701 | 2.99260.0025 | 20020 | 0.440.12 | log()18 |
| Associated Absorber D, , km s-1 | |||||
| O VI | 1031.9265 | 2.97010.0003 | 22070 | 0.140.06 | tentative |
| O VI | 1037.6155 | 2.97250.0006 | 480120 | 0.720.18 | blend Ly(A) |
| Ly | 1215.6701 | 2.97260.0010 | 30030 | 0.750.17 | blend Si III(B); log()18.2 |
| C IV | 1548.202 | 2.97190.0002 | 16020 | 0.230.02 | blend Si II*(A) |
| C IV | 1550.774 | 2.97280.0007 | 17020 | 0.140.01 | |
| Associated Absorber E, , km s-1 | |||||
| Ly | 1025.7223 | 2.96630.0005 | 500110 | 0.630.14 | blend, Ly forest |
| Ly | 1215.6701 | 2.96620.0004 | 19020 | 0.120.03 | log()18 |
| N V | 1238.821 | 2.96670.0010 | 25020 | 0.250.02 | |
| N V | 1242.804 | 2.96590.0006 | 21050 | 0.190.04 | |
| Intervening Absorber, | |||||
| C IV | 1548.202 | 2.77110.0002 | 20020 | 0.280.03 | |
| C IV | 1550.774 | 2.77210.0004 | 27010 | 0.210.02 | |
| Intervening Absorber, | |||||
| Fe II | 2249.88 | 1.12910.0008 | 21060 | 0.270.12 | blend? Ly forest |
| Fe II | 2260.7805 | 1.12870.0005 | 30040 | 0.310.05 | blend? Ly forest |
| Fe II | 2344.2139 | 1.12870.0002 | 16030 | 0.160.03 | |
| Fe II | 2374.4612 | 1.12890.0002 | 9020 | 0.190.04 | blend Si II(A) |
| Fe II | 2382.7652 | 1.12870.0004 | 23060 | 0.730.18 | blend Si II*(A) |
| Fe II | 2586.65 | 1.13010.0002 | 310140 | 0.350.16 | |
| Fe II | 2600.1729 | 1.12930.0002 | 21050 | 0.390.09 | |
| Mg II | 2796.352 | 1.12870.0001 | 31030 | 0.660.05 | |
| Mg II | 2803.531 | 1.12860.0001 | 30020 | 0.450.03 | |
| Mg I | 2852.9642 | 1.12960.0001 | 33010 | 0.370.02 | |
Note. — All errors are statistical errors.