Quasisoft X-Ray Sources: Unusual States of Stellar-Mass Objects, or Intermediate Mass Black Holes?
Abstract
Chandra observations of nearby galaxies have revealed a number of X-ray sources characterized by high luminosities ( erg s-1) and in the range eV. These “quasisoft X-ray sources” (QSSs) are harder than luminous supersoft X-ray sources (SSSs), whose characteristic temperatures are tens of eV, but, with little or no emission above keV, they are significantly softer than most canonical X-ray sources. They are likely to include a range of physical systems; some may be common systems in unusual states: neutron stars or stellar-mass black holes (BHs), or SNRs. Others may be accreting BHs of intermediate mass. We have analyzed Chandra data from near-by galaxies to identify QSSs with sufficiently high count rates to allow spectral fits. Six of these galaxies have been studied in great detail; in these we find SSSs and QSSs. In this paper we present spectra for QSSs those with more than counts. We also use data from six of these galaxies to study the broadband spectral distributions of QSSs and to compare them with those of other X-ray sources. Since QSSs in the Milky Way are likely to be missed by our selection procedures, we discuss other signatures by which they can be found. If some of the QSSs for which we have spectra are accreting BHs, the lower bounds for the BH mass range from roughly to .
1 What are quasisoft sources?
1.1 Operational Definition
The Einstein Observatory detected a small number of X-ray sources (XRSs) with luminosities near erg s-1, and little or no emission above keV. When ROSAT identified approximately a dozen such sources in the Magellanic Clouds and Galaxy and more than in M31, the empirical class of luminous supersoft X-ray sources (SSSs) was established. SSSs of lower luminosity (but greater than roughly erg s-1) have also been discovered. The effective radii of SSSs are comparable to white dwarf (WD) radii, although in principle, SSS-like radiation can be emitted by objects more compact than WDs. Indeed, roughly half of the SSSs with optical IDs contain hot WDs–e.g., recent novae, symbiotics, a planetary nebula. The other SSSs are binaries which are thought to contain WDs accreting at high enough rates ( yr-1) to allow nuclear burning (van den Heuvel et al. 1992).
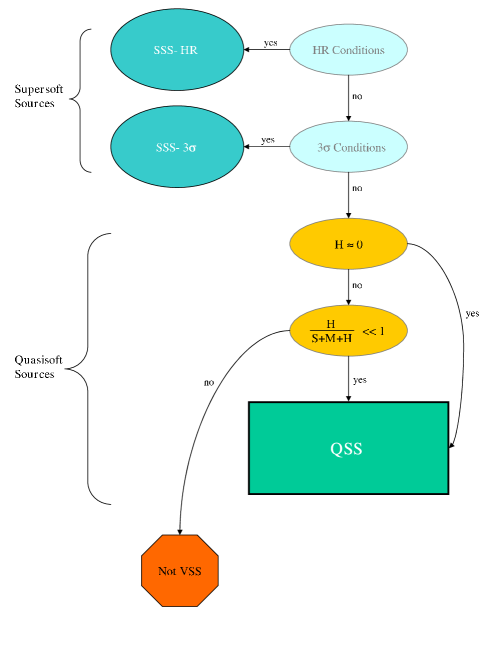
Because absorption can readily hide emission from SSSs, we can study large populations of them only by observing external galaxies located along directions with small gas columns. Unfortunately, however, their great distance from us ensures that we receive few photons from most XRSs in external galaxies. It is therefore important to develop methods for identifying SSSs on the basis of broadband fluxes rather than detailed X-ray spectra. We have developed an algorithm based on energy bands111S: 0.1-1.1 keV; M: 1.1-2 keV, H: 2-7 keV to select SSSs from among all of the XRSs in an external galaxy. For details of the algorithm and tests on simulated data, see Di Stefano & Kong (2003b); the flow chart of Figure 1 sketches its broad outlines.
The first steps in the algorithm select the softest sources, those most likely to be like the SSSs observed in the Galaxy and Magellanic Clouds. We refer to the sources selected by these two steps as “classical” supersoft sources, or simply SSSs. An additional steps relax the selection criteria in a hierarchical fashion, to avoid missing potentially important sets of very soft sources. For example, when we observe a hot ( eV) SSS located behind a large gas column, the relative fraction of counts recieved above keV might be so large that restrictive criteria would fail to identify the source as an SSS, even though the unabsorbed spectrum would fit the SSS criteria. In fact, such a hot SSS would be particularly interesting, because it could be among the hottest of nuclear-burning WDs and a good candidate for a possible future Type Ia supernova. Less restrictive conditions also allow us to identify as very soft, those SSSs producing so few counts that their hardness ratios are not well constrained. In fact, since low-luminosity SSSs are expected to be more numerous than those with high luminosities, and since absorption can decrease the count rate significantly, many genuine SSSs we observe in other galaxies will fall in this category. We therefore need to loosen the selection criteria in a systematic way that does not rely on only hardness ratios. Less restrictive conditions, however, have the potential to cast a wider net, selecting sources that are actually harder than the locally-studied SSSs. In this paper, we concentrate on the characteristics of those sources identified by the additonal steps in our algorithm. Because they can be hotter than the known SSSs, we have dubbed them “quasisoft” sources (QSSs).
Thus, QSSs are an operationally-defined set of sources whose distinguishing characteristics may be summarized as follows: (1) their broadband spectra should have no significant emission above keV, with where is the number of counts between and keV, and is the one uncertaintly, including both the effects of counting statistics and ambient background; or (2) if there is a strict limit on the ratio where is the total number of photons, combined with requirements on the relative significance of the detections in the and bands. For example, one of three such requirements in our algorithm is: combined with
1.2 Previous Studies
We have used the algorithm to conduct studies of QSSs and SSSs in a small number of external galaxies. When we have had enough counts for spectral fits, the best-fit models for QSSs have tended to be significantly harder than models expected for SSSs.
For example, in M31 we find SSSs and QSSs, with of all XRSs falling into one of these categories (Di Stefano et al. 2003a). Four of the VSSs are bright enough to permit spectral fits using photons from a single image. One of these is a QSS and is clearly harder than the other , which are SSSs (Figure 2 of Di Stefano et al. 2003a). Each of the SSSs can be fit by a blackbody model; the temperatures are 25 eV, 56 eV, and 122 eV. The QSS is the only one of the four with a significant number of photons evident out to keV; it is fit by a combination of a blackbody model ( eV) and a power law model, (). The central of M31 contains the largest fraction of VSSs ( of all XRSs), most of them are SSSs ( SSSs out of VSSs). In contrast, the majority of M31 VSSs in the outer disk are QSSs.
In a study of very soft sources in M101, M83, M51, and NGC 4697, we found SSSs and QSSs (Di Stefano & Kong 2003c). Spectral fits could be carried out for individual SSSs; of these were well-fit by blackbody models with eV eV, with a median value of eV. Spectral fits could be carried out for individual QSSs; of these were well-fit by blackbody models with eV eV, all but one with eV, and with a median value of eV.
In M104 (NGC 4594), the Sombrero galaxy, we found among XRSs in total, VSSs, only of which are SSSs (Di Stefano et al. 2003b). The dominance of QSSs relative to SSSs in M104, which is viewed edge-on, could be due to two effects. First, absorption in the disk is so severe that we are primarily sensitive to VSSs located more than pc above the disk, more likely to be part of an older stellar population. Second, absorption is more likely to obscure or alter the observed spectra of SSSs. One of M104’s QSSs, X-35, appears to be associated with a globular cluster (GC). No source with both comparable luminosity and spectral properties has been discovered in the GC system of either the Galaxy or M31. In NGC 4472, we found 211 X-ray sources; 5 are SSSs and 22 are QSSs. We also found GCs associated with VSSs, SSSs and QSSs (Di Stefano et al. 2003c).
1.3 This paper
The goal of this paper is to study the properties of QSSs in as much detail as possible, especially to elucidate spectral differences between QSSs and both SSSs and canonical XRSs. We begin in §2 with a study of the broadband spectral properties QSSs, SSSs, and canonical XRSs in six galaxies whose VSS populations we have already identified through previous archival studies. The galaxies are M101 and M83, two spirals viewed almost face-on; M51, an interacting galaxy; M104, a spiral seen almost edge on, and two elipticals, NGC 4472, and NGC 4697. These galaxies were chosen for the work described in §2 because we have the most detailed information about their broadband spectra. In addition, we used a deeper Chandra observation of M51 (OBSID1622) in this paper. As part of our earlier studies, we have determined the count rates in each of energy bins: keV, keV, keV, keV, keV, keV, keV, and keV.
Because we aim to extend the study of QSSs to a larger number of galaxies, spanning a greater variety of galaxy environments, in §3 we discuss the analysis of archival data from a total of galaxies, including M31 and the galaxies discussed in §2. In addition to NGC 4472 and NGC 4697, we now consider other elliptical galaxies, and an S0 galaxy. We add to the spirals of §2, additional spirals observed at a variety of orientations, and located at a broader range of distances. To each galaxy, even those studied before, we apply one single procedure to detect XRSs and to select VSSs. We identify QSSs that can be subjected to spectral fits. Since some QSSs may be absorbed SSSs, this last step is important to test whether a significant subset are genuinely harder.
We consider a variety of physical models for QSSs in §4. We turn in §5 to discussions of the size of QSS populations in galaxies. In this regard it is especially important to consider our own Galaxy. Since our algorithm would identify few (if any) QSSs in the Milky Way, we focus on the question of how to identify QSSs in the Milky Way. We present our conclusions, and consider the prospects for future research in §6.
2 Broadband Spectra
Here we sketch the procedures for source detection and the selection of VSSs detailed in the papers on these specific galaxies: M101, M83, M51, and NGC 4697 (Di Stefano & Kong 2003); M104 (Di Stefano et al. 2003b); and NGC 4472 (Friedman et al. 2003; Di Stefano et al. 2003c). Source detection was accomplished using WAVEDETECT, with the energy range keV; each source was visually inspected and any spurious sources were eliminated. We analyzed only data taken with the S3 CCD. (The exception was NGC 4472, for which we analyzed the data from all of the CCDs.) Chandra deep field studies were used to estimate the expected numbers of background sources, per S3 field, given the typical exposure times; this is much smaller than the numbers of sources detected. We eliminated all XRSs associated with known foreground stars, which can have spectra and timing properties similar to VSSs. In addition, we tested for the expected foreground and background VSSs by running our detection algorithm on data from several extragalactic fields analyzed by the ChAMP team. We found that, given typical exposure times, the S3 fields would typically contain VSSs.222In fields for which we have optical data, we find that these are often foreground stars. Because this number is small compared to the numbers of VSSs actually detected, it is likely that the majority of VSSs are actually associated with the galaxies themselves. Further evidence that most XRSs (including VSSs) are associated with the galaxies comes from the fact that the majority are clearly associated with galaxy features, such as spiral arms, or exhibit density variations that appear related to the distance from the galaxy centers.
Table 1 summarizes the results on the relative sizes of the SSS, QSS, and canonical XRS populations in each of M101, M83, M51, M104, NGC 4697, and NGC 4472. (We did not include M31 because only a small portion of the galaxy has been observed with S3, and the results differ from field to field, as described in §1.1.) The total number of sources detected is of which () are VSSs. Of the VSSs, sources were identified as SSSs.
Direct comparisons of the numbers of each type of source from galaxy to galaxy can be misleading, since the detection limits are different, and conditions within the galaxies, such as the gas distribution, strongly influence SSS detection and have not been studied. Nevertheless, two features do stand out. First, each galaxy has a significant population of VSSs, including QSSs. While SSSs were expected, there is not a large pool of local sources (in the Galaxy or Magellanic Clouds) known to have the spectral properties of QSSs and luminosities in the range observed for these extragalactic sources, typically above erg s-1. Second, the ratio of the number of QSSs to SSSs appears to be larger for the two ellipticals and for M104. Since both ellipticals are along directions with low- and because absorption by gas along the line of sight within these galaxies is less likely, it seems probable that the QSSs they contain are not simply absorbed SSSs, but sources with intrinsically harder spectra. Furthermore, because the stellar populations of the ellipticals are likely to be old, Table 1 may indicate that QSSs are more common, compared with SSSs, among older populations. This would be consistent with the relative dominance of QSSs over SSSs in (1) M104, and in (2) regions of M31 near the outer portions of the disk, where little or no recent star formation has taken place.
Figure 2 shows the percentage of the photons from all SSSs (bottom panel), QSSs (middle panel), and canonical XRSs (top panel) with energies in each of the energy bins: keV, keV, keV, keV, keV, keV, keV, and keV. This figure confirms the selection procedure is working. SSSs, for example, have little or no emission above keV. QSSs are significantly harder than any of the SSSs detected in the Galaxy and Magellanic Clouds, in that a significant fraction () of the radiation they emit is in the form of photons with energies above keV. These sources will not be chosen by procedures designed to select SSSs. Yet, they are significantly softer than canonical XRSs, since photons with energies above keV are either absent from their spectra or constitute only a small fraction () of the total emission. Thus, the sources we have dubbed QSSs, based on the properties of their broadband spectra, seem to span the spectrum between SSSs and canonical XRSs. An interesting feature is that only roughly of the photons from so-called canonical XRSs have energies above keV (see also Di Stefano 2003).
| Name | Type | Distance | Inclination | Chandra | Total | VSS | SSS | QSS | Canonical | |||
|---|---|---|---|---|---|---|---|---|---|---|---|---|
| (Mpc) | (arcmin) | (cm-2) | exposure (ks) | |||||||||
| M101 | Sc | 5.4, 6.71 | 23.8 | -20.45 | 1.2 | 94.4 | 118 | 53 | 32 | 21 | 65 | |
| M83 | Sc | 4.7, 4.572 | 11.5 | -20.31 | 3.8 | 49.5 | 128 | 54 | 28 | 26 | 74 | |
| M51 | Sc b | 7.7, 8.43 | 13.6 | -20.75 | 1.6 | 28.6 | 92 | 36 | 15 | 21 | 56 | |
| M104 | Sa | 8.94 | 8.4 | -22.98 | 3.7 | 18.5 | 122 | 22 | 5 | 17 | 100 | |
| NGC 4697 | E | 11.76, 15.95, 23.3 | 7.1 | -21.67 | c | 2.1 | 39.3 | 91 | 19 | 4 | 15 | 72 |
| NGC 4472 | E | 16.8 | 11.4 | -21.82 | c | 1.7 | 34.4 | 211 | 27 | 5 | 22 | 184 |
Notes—All data are from Nearby Galaxies Catalogue (Tully 1988) unless specified.
a Ratio of number of SSSs to total number of X-ray sources.
b Seyfert 2 galaxy.
c For elliptical galaxies the inclination is given by + acos , where d/D is the axial ratio of minor to major diameter (Tully 1988). This inclination angle is generally unrelated to the value of .
Referrences—1: Freedman et al. 2001; 2: Karachentsev et al. 2002; 3: Feldmeier et al. 1997; 4: Ford et al. 1996; 5: Tonry et al. 2001; 6: Faber et al. 1989

Figure 3 is a color-color diagram which shows the relative positions of QSSs (filled green circles), SSSs (open red circles), and canonical XRSs (blue triangles). (See Prestwich et al. 2003, for this choice of axes.) All sources shown on this plot provided more than counts, so that the hardness ratios are fairly well defined. Three features of this diagram are worthy of note. First, while there is some overlap along the boundaries, QSSs, SSSs, and canonical XRSs each occupy distinct regions of the plane. (Note that only the SSSs are chosen by conditions that rely primarily on hardness ratios. In other cases, the relative significance of the detection in different bins is, e.g., also used.)
Second, examining the position of the QSSs, relative to PIMMS (AO-6) predictions for a range of models (black curves), we see that many QSSs are located in regions that are not associated with eV models. While the QSSs which hug the left-most line could be highly absorbed SSSs, QSSs lying to the right of this line are more likely to have spectra described by higher temperature blackbodies ( eV eV), or by a combination of such a model and a power law, with softer than roughly .
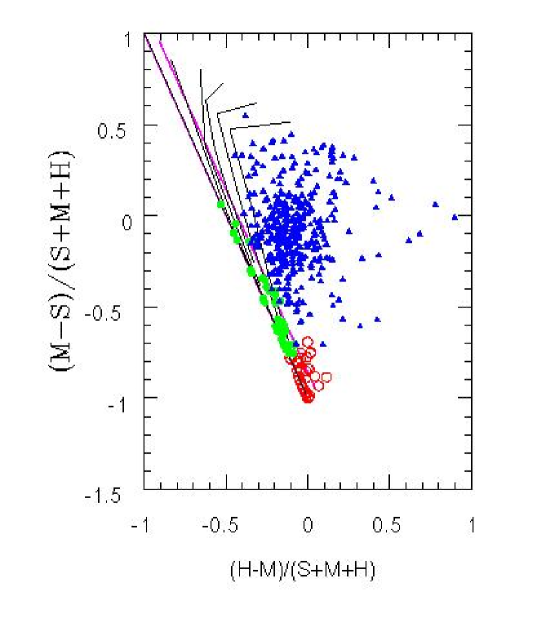
Finally, the diagram illustrates that, at least for sources providing enough counts that their position in a color-color diagram is meaningful, it is possible to use hardness ratio conditions to reproduce the overall effects (but not the full classification) of our algortihm. All SSSs, e.g., have This is not unique to SSSs, however, as some QSSs satisfy the same condition. All QSSs lie between the magenta lines. The left-most magenta line is defined by , and can be satisfied by an absorbed SSS. The second magenta line, parallel to the first, is defined by Thus, the combination of lines: the two magenta lines described above, and the horizontal line at , can be used to identify high-count SSSs and QSSs. For sources providing fewer counts, however, the hardness ratios are not well defined. The algorithm therefore has an advantage, in that it can select very soft sources in a way that is not subjective, even if they provide small numbers of counts.
3 Spectra of QSSs from Galaxies
3.1 Source Detection and Selection
Data from 19 nearby ( Mpc) galaxies observed by Chandra with the ACIS-S detector (see Table 2) were extracted from the Chandra Public Archive, and further processed to remove times of background flares, using standard CIAO background-filtering procedures (http://cxc.harvard.edu/ciao/threads/filter_ltcrv/). Data from the S1 chip (S2 if S1 was not selected) were used to generate background lightcurves. Only data from the S3 chip were used for source analysis.
Sources were detected by running the CIAO celldetect tool on data in two energy bands, keV, and keV, using a signal-to-noise threshold of 2.5. Spurious sources, typically detected near detector boundaries, were rejected manually. The two source lists were merged, selecting the higher signal-to-noise detection in cases of multiple detections. Circular source and annular background region files were generated for each source, with the source region corresponding to a 90% encircled energy fraction, determined from the source off-axis angle. Data from near-by overlapping source regions were excluded from all source and background regions. Net counts were extracted in three energy bands, S: 0.1-1.1 keV, M: 1.1-2.0 keV, and H: 2.0-7.0 keV, using SAORD funtools utilities (http://hea-www.harvard.edu/RD/funtools/).
We applied our algorithm to the set of all detected sources to identify SSSs and QSSs. To assure uniformity, our treatment of data from all galaxies was identical, using no information from previous studies. The results are shown in Table 1.
Because prior studies had been carried out for several of these galaxies, we were able to compare our results with those of previous studies, and find generally good agreement.
3.2 Spectral Fits
From the pool of all QSSs, we chose those providing more than counts, visually inspecting each to ensure that it is not in a region with significant diffuse emission. This precaution lessens the possibility that a soft source actually represents a dense unresolved region of diffuse emission. (See, e.g., Immler et al. 2003, and Figure 6 in Soria & Wu 2002.) Channels with energies less than 0.3 keV and greater than 7.0 keV were excluded. The response files were corrected for the continuous degradation of the ACIS detector quantum efficiency. The spectrum for each source was fitted within XSPEC Version 11.2.0 with a simple absorbed blackbody, multi-color disk blackbody, and power-law models. For sources with more than 200 counts, we implemented fits using binned spectra (at least 15 counts per spectral bin), and employed the statistics to estimate goodness of fit. For fainter sources (50 counts 200), we used unbinned spectra and applied the CASH (Cash 1979) statistics, employing Monte-Carlo simulations to estimate the significance level.
Table 2 lists the results. For QSSs we fit binned spectra. Sources 2, 7, and 8 were well-fit by blackbody models, with ranging from eV to eV and X-ray luminosities from erg s-1 to erg s-1. Source 19 has an acceptable fit when a multicolor disk model is used, but no acceptable blackbody model fits; is eV, and is erg s-1. Although there is no single well-accepted boundary defining ultraluminous X-ray sources (ULXs), the value erg s-1 is often used. By this definition source 19 is a ULX. Source 6 was fit neither by a blackbody nor multicolor disk model; instead a power law (; erg s-1) was acceptable, but this model required additional Gaussian line emission at keV; a similar result was found by Soria & Wu 2003. Sources 1, in M31 (see also Di Stefano et al. 2003a) and 18, in NGC 1399, were fit by power-law models, with ( erg s-1; erg s-1, respectively). The ranges of temperatures and power-law indices are similar for the sources fit using unbinned spectra.
TABLE 2
Spectral fits to the bright QSSs Blackbody Power-law Galaxy (OBSID)a Distance Source / /dof, MCb /dof, MCb (0.3–7 keV) (Mpc) (CXOU) ( cm-2) (keV) ( cm-2) ( erg s-1) 1 M31 (1575) 0.78 1 J004244.3+411607 — — — 1.0/45 0.3 2 M33 (786) 0.84 2 J013341.9+303849 1.7/13 — — — 0.14 3 M83 (793) 4.7 J133702.4-295126 0.97 0.71 0.5, 38 4 J133706.0-295514 0.97 0.78 0.26, 4.6 5 J133717.2-295153 0.97 0.92 0.26, 11.6 6 J133649.0-295258 — — — c 0.9/12 2.6 7 M51 (354) 7.7 J132939.9+471236 0.2 (fixed) 1.16/13 — — — 3.3 8 M104 (1586) 8.9 J124001.1-113723 0.71/15 — — — 8.9 9 NGC4697 (784) 15.9 3 J124834.4-055014 1 (fixed) 1.0 0.7 2.5, 3.8 10 NGC4649 (785) 16.8 J124341.1+113248 1 (fixed) 0.99 0.46 2.1, 6.8 11 J124341.3+113320 1 (fixed) 0.92 0.58 2.6, 14.9 12 NGC3379 (1587) 9.5 2 J104747.9+123445 1 (fixed) 0.98 0.47 1.1, 3.8 13 J104741.8+123745 1 (fixed) 1.0 0.81 3.8, 12.9 14 NGC3115 (2040) 11 4 J100510.0-074530 1 (fixed) 1.0 0.36 2.1, 3.0 15 NGC1399 (319) 20.5 5 J033826.7-352704 1 (fixed) 0.89 0.64 2.5, 10.0 16 J033832.3-352645 1 (fixed) 1.0 1 (fixed) 0.93 3.8, 6.1 17 J033831.7-353058 1 (fixed) 1.0 0.73 6.7, 5.5 18 J033827.6-352648 — — — 1.1/22 23.4 19 J033831.8-352603 0.15 (fixed) d 1.0/26 — — — 16.6
NOTES — All quoted uncertainties are 90% confidence. Distance is quoted
from Nearby Galaxies Catalogue (Tully 1988) unless specified.
Sources without reduced and dof values were fitted with
unbinned data using CASH statistics; “goodness-of-fit”
determined by Monte-Carlo simulations (MC) is employed and parameters of
both blackbody and power-law models are shown. The luminosities refer to
blackbody
(first) and power-law (second) model.
a OBSID is the observation identification number of Chandra observation. For the nine remaining galaxies that were used in this paper
but do not appear in this table, the OBSIDs are as follows: M32 (2017),
M101 (934), NGC4258 (1618), NGC4472 (321), NGC4552 (2072), M84 (803),
NGC415 (348), NGC5845 (4009), and NGC1313 (2950).b For faint sources, we list the probability that the best fit model
would produce a lower value of the CASH statistic than that calculated
from the data, as determined via XSPEC Monte-Carlo simulations. A best
fit model should have a value of about 0.5.c A 1.27
keV Gaussian emission line is required to obtain a good fit. d Multi-color disk blackbody model.
References — 1 Stanek & Garnavich 1998; 2 Freedman et al.
2001; 3 Faber et al. 1989; 4
Durrell et al. 1996; 5 Merritt & Ferrarese 2001
4 Physical Models
As is the case for SSSs, the empirical definition of QSSs is broad, allowing the class to possibly encompass a wide range of physical phenomena. For SSSs, the key clue was provided by the effective radius and the fact that hot WDs, whether the central stars of planetary nebulae, post-novae, or quasi-steady nuclear burners, were expected to have temperatures as hot as those observed for SSSs. It is therefore not surprising that more than half of the local systems appear to be WD systems of known types. Nevertheless, the physical natures of the local candidates, such as CAL 83 and CAL 87, for the less-well established NBWD models are not yet definitely determined. Neutron star and BH models cannot be ruled out. The spatial distributions of SSSs in face-on spirals (see Di Stefano & Kong 2003a ,c) indicates that a significant fraction may be young systems, with ages less than a few times years; this is not expected for most NBWD models. Indeed, two SSSs in M31 appear to be associated with SNRs (Di Stefano et al. 2003a). Nevertheless, the large majority of SSSs for which we have multiple observations are highly variable or even transient, ruling out SNR models. Some SSSs are ultraluminous, most likely ruling out WD models and suggesting the possibility that they are accreting intermediate-mass BHs (IMBHs). The effective radii are also compatible with IMBH models (see below).
Just as the SSS moniker can likely corrspond to several different physical models, so can the label “QSS”. As for SSSs, we use the effective radius to obtain a clue as to the nature of the sources.
| (1) |
This is smaller than the radii of WD, but larger than the radii of NSs. It is roughly times larger than the Scharzschild radius of a BH, or roughly times larger than the inner disk radius, if there is ongoing accretion extending inward to the last stable orbit. Judging simply by the effective radius, the most natural model would therefore be one in which the accretor is a BH with mass larger than expected for the remnants of present-day stars. (In §4.2 we show that this conclusion is supported even for the standard disk models used for BH accretors.) Models other than those invoking an IMBH are nevertheless possible, and we therefore begin by considering them in §4.1, before focusing on IMBH models in §4.2.
4.1 Comparisons with well-studied systems
White Dwarfs: For QSSs, is less than half the radius of the smallest WD (one with ). In fact, if we assume that the surface of a WD is radiating at the Eddington luminosity, we find that the maximum possible temperature is eV. Calculations of emission from hot WDs which are either experiencing or have recently experienced nuclear burning find, however, that the photosphere is located well above the surface, and temperatures tend to be below eV (Nomoto 1982; Iben 1982). Thus, while it may be possible for QSS-behavior to be exhibited by a WD, this would require that the emission emanate from a limited portion of the WD surface, or else that there be a significant amount of reprocessing of the soft radiation emitted from the photosphere. Behavior like this has not been observed in those local SSSs either known or suspected to be hot WDs. We note, however, that some QSSs from which we have recieved only a small number of photons are classified as QSSs rather than SSSs on the basis of just a few photons with energies above keV. Deeper observations of such sources might reveal them to be SSSs, or might find that the energy in photons above keV is small enough to be consistent with modest upscattering of photons from a hot WD, or with shocking due to winds, etc. Only roughly of, e.g., the VSSs of Table 1 provide fewer than counts, however, so such an explanation is unlikely to apply to the majority of QSSs. In summary, although they cannot be ruled out, WD models are not the preferred models for most QSSs.
Neutron Stars: is larger than NS radii. Nevertheless, when SSSs with even larger effective radii were discovered, it was noted that, on theoretical grounds, NSs can have extended photospheres (Kylafis & Xilouris 1994). This model was not the subject of much additional attention as an explanation of SSSs, possibly because there seemed to be no obvious mechanism to preferentially select WD-like radii. If, however, some QSSs are NSs, their discovery may signal that a continuum of effective radii is realized in nature, eliminating the fine-tuning problem. In fact, at least one NS systems with soft SSS-like emission and beamed hard emission is known. The X-ray pulsar RX J 0059.2-7138 (Hughes 1994) has a luminous soft unpulsed component (see also Kohno, Yokogawa, and Koyama 2000). It is unlikely that RX J 0059.2-7138 is an anomaly. In fact, Her X-1, a Galactic X-ray pulsar, has long been known to have a luminous time-variable soft component (Shulman et al.1̇975; Fritz et al. 1976). If this is common, then a set of soft sources in external galaxies may simply be X-ray pulsars for which we are out of the beam of the harder emission. RX J 0059.2-7138 would likely be identified as a SSS; it is conceivable, however, that other X-ray pulsars have luminous soft components with spectra like QSSs instead of SSSs. Another conjecture is that some QSSs and SSSs represent temporal states of NS in which the hard emission is off, but the soft emission continues. Such states could occur fairly frequently among local X-ray binaries, and, since the RXTE’s All-Sky Monitor (ASM) cannot detect the soft emission ( keV) that would be dominant, we would only be aware of them if they happened to occur during specific observations with detectors having good soft sensitivity. In summary, some QSSs could be NS binaries from which we have not detected hard radiation because of either the angle from which we view the system or the temporal state of the system. In either case, the ability to detect and study QSSs in other galaxies would have implications for population estimates and evolutionary calculations; in addition, we should be able to identify a sizable population of local analogues (see §5.2).
Stellar-Mass Black Holes: Analogous arguments for temporal states can be applied to stellar mass BHs. In fact, locally-studied stellar mass BHs do exhibit “thermal dominant” (TD), or “soft” states. These states are, however, much harder than QSS spectra, with typical values of for the TD states of stellar-mass BHs larger than 600 eV. For a recent detailed review, see McClintock & Remillard (2004). During intervals when the inner disk temperature appears to be lower, i.e., the inner disk radius is larger, the radiation is not dominated by thermal emission from a disk, but rather by a a harder power-law component (see, e.g., Sobczak et al. 2000). Even though stellar-mass BH spectra are harder than QSSs, they appear to be the the closest analogues among physical states that are actually known to exist in our Galaxy. It would be interesting if some QSSs are BHs, as there is no reliable way, except possibly through characteristics of time variability associated with, e.g., X-ray novae (see, e.g., Williams et al. 2004 and references therein), to identify BHs in other galaxies. It is important to note, however, that the square of the temperature of the inner disk is inveresly proportional to the mass of the central BH. Larger mass BHs should exhibit softer spectra. If, therefore, there is not a sharp truncation in the BH mass function, TD states with softer spectra are expected, and may provide an explantion for QSSs.
SNRs: The LMC contains several SNRs (N63A, DEM 71, N132D, and N49) with luminosities between erg s-1 and erg s-1 have keV keV (Hughes, Hayashi, & Koyama 1998). Thus, although they are cool compared with other bright SNRs, they are hotter than QSSs. Furthermore, on theoretical grounds, is expected that the SNR should dim as is it cools. Note however, that we do find apparent counterexamples in the X-ray data from M31. Near the center of M31, there are three X-ray SNRs (identified by both X-rays and radio) that have temperatures of eV (Kong et al. 2002; Kong et al. 2003). One of these might be bright enough to have been observed in more distant galaxies. Variability studies can identify QSSs that are not SNRs. In M31 (Di Stefano et al. 2003), e.g., we find that both QSSs and SSSs tend to be variable over month-to-year time scales. We have also found that roughly half of the bright QSSs in M51 are variable.
As summarized above, each standard model, WD, NS, stellar-mass BH accretors, or SNRs, can potentially produce emission with the range of temperatures and luminosities exhibited by the QSSs we have observed in other galaxies. No one model, however, appears to be an especially natural candidate to explain the majority of QSSs.
4.2 Intermediate-Mass Black Holes
It is possible that the relatively soft spectra of QSSs, as compared with stellar-mass BHs, indicates that QSSs are associated with BHs of somewhat higher mass. Indeed, if we assume that should correspond to the radius of the last stable orbit around a Schwarzschild BH, at times the Schwarzschild radius, then
| (2) |
For the blackbody fit parameters in Table 1, the BH masses computed from this formula range from approximately up to nearly , with () masses greater than (), and a median value of . For a thin but optically thick disk, the appropriate formula is identical to Eq. 2, but with a factor included on the right-hand side to take into account the effects of spin, spectral hardening, and orientation. For Schwarzscild BHs, the factor is typically leading to larger mass estimates, as high as . For spinning black holes, the spectral hardening parameter tends to be smaller, but there is an overall factor of , producing generally higher mass estimates. Furthermore, the true luminosities may be significantly larger than the estimated X-ray luminosities. In summary, QSS spectra are consistent with the IMBH hypothesis.
In fact QSS spectra can be viewed as extensions of the TD states of stellar-mass BHs to softer disks and, therefore to possibly larger masses. Furthermore, some of the QSSs may represent extensions of ULX spectra to lower luminosities. Evidence for cool disks comes from fits to several ULX spectra (see., e.g., Miller et al. 2003, Kong & Di Stefano 2003;, Zampieri et al. 2004). Most recently, Wang et al. (2004) have used Monte Carlo simulations to conduct a self-consistent study of the disk and a Comptonized power law component and found an inner disk temperature eV for of seven ULXs. Even the most luminous QSSs considered in §2 provided far fewer photons than the ULXs studied by Wang et al. (2004). Thus, since the power-law component is typically more than an order of magnitude dimmer than the thermal component (see also Mc Clintock and Remillard 2003), it is conceivable that the sources we find to be predominantly soft do have a harder component which provides too few photons to significantly influence the fit.
Because , the X-ray luminosities of these QSSs tend to be of the Eddington value, which can be compatible with optically thick thermal emission. We note further, that the X-ray flux would be only a small portion of the energy output by the BH. For example, only the region just around the inner edge of the disk is hot enough to emit X-rays. Until recently, it was thought that soft states in BHs were predominantly also “high,” luminous states. Observations of several systems have, however, suggested that such states occur over a range of luminosities, including relatively low (but not quiescent) states. (See Homan et al. 2001; Wijnands & Miller 2002; McClintock & Remillard 2004.)
If any of the ULXs now considered as possible IMBHs in other galaxies (e.g. Miller & Colbert 2003), actually are IMBHs, QSSs fit in as a natural part of the class. First, with luminosities above erg s-1, some QSSs may themselves be viewed as ULXs. Second, the QSSs that are not ULXs may represent the lower systems that should constitute the bulk of the IMBH population. Indeed, if any of the ULXs currently under study do harbor IMBHs, it is clear that there must be a less luminous population of IMBHs, since, in the context of most binary models, the least luminous IMBHs are expected to be the most numerous representatives of the class. It has been convincingly demonstrated that the total energy output in some ULXs is indeed large, consistent with the high estimated X-ray luminosities (Pakull & Mirioni 2002). Spectral studies of a small but growing number of systems suggest signs of cool disks expected for accreting IMBHs (e.g., Miller et al. 2003; Kong 2003; Cropper et al. 2004; Miller et al. 2004). If some ULXs are IMBHs, then it is certain that at least some galaxies are home to large numbers of less luminous IMBHs. The dominant spectral component for those IMBHs accreting at rates not too much below the Eddington luminosity is expected to be soft. It therefore seems possible that the spectral selection procedure we have employed can identify, from among the many XRSs in a galaxy, those most likely to be IMBHs. The accretion rates ( for the systems in Table 1 range from roughly yr-1 to yr-1, consistent with binary models (Di Stefano 2004).
5 Galactic Populations of QSSs
5.1 QSSs in other galaxies
With the limited information we have so far, it is not possible to compute the size of typical galactic populations of QSSs. Because we do not yet know what they are, we cannot be guided by theoretical models. Furthermore, the data collected so far provide only limited information. The detection limits vary significantly among the galaxies we have studied, ranging from erg s-1 for long ( ksec) observations of M31 to just under erg s-1 for ksec observations of galaxies at Mpc. (To compute these limits, we assume that 14-20 counts are required to both detect a source and classify it as QSS, and that cm-2; we use PIMMS AO6 release to estimate count rates.) We find sources down to the detection limits of the galaxies we have studied in detail: M31, M83, M51, M104, NGC 4697, and NGC 4472. Because of its proximity, M31 may provide the best guide. In Chandra observations which are effectively sensitive to QSSs in only roughly of the area of M31, e.g., we have identified QSSs. We can therefore argue for at least several dozen QSSs in M31.
5.2 QSSs in the Galaxy
If other galaxies harbor QSSs, so must our own. In fact it is almost certain that some detected XRSs would be identified as QSSs were they located in other galaxies, such as M101. There are, however, few, if any obvious local candidates for the class. It is not surprising that we have apparently not yet identified a pool of luminous sources with the spectral properties of QSSs in our Galaxy or in the MCs. First, absorption in the Galactic plane modifies the spectra of soft sources significantly. Second, as described below, the surveys best poised to study Galactic sources would have had some difficulties in studying QSSs. For example, a erg s-1 source kpc from us would yield a flux of erg s-1 cm-2. If eV, the count rate for ROSAT’s PSPC would have been roughly count s-1, and the source would have been easily detected in the All Sky Survey (RASS). More than of the incident photons would have energies above keV, however; with the PSPC’s sensitivity cut off of keV, there would have been no way to determine that there is little flux at higher energies. Thus, while the difference between SSSs and canonical XRSs was readily detected by ROSAT, the difference between QSSs and canonical XRSs was not.
In recent years, the most extensive and detailed information collected on local X-ray binaries has been collected by RXTE. Its sensitivity, however, does not extend below keV. RXTE can therefore not detect SSSs, or even those QSSs which emit no radiation in the band. It is very likely, however, that the high-energy tails of some QSSs have been detected by RXTE. The measured flux would typically be on the order of a percent of the bolometric flux. This suggests that QSSs may be selected by comparing the RASS source list with lists from other catalogs of Galactic X-ray binaries (e.g. Liu, van Paradijs, & van den Heuvel 2001) and carrying out spectral fits for RASS sources that (1) exhibit high count rates, but (2) have low flux above keV, as measured from fits in other catalogs (e.g. Liu, van Paradijs, & van den Heuvel 2001), and which (3) are not identified with foreground stars or background galaxies.
We note that IMBH models for some QSSs are attractive because, in them, QSSs represent a natural extension of known systems. First, the class of QSSs can be viewed as a possible soft extension of the TD states of well-studied stellar-mass BHs. Second, QSSs, and possibly some SSSs, with luminosities below erg s-1 can be viewed as possible extensions to lower luminosity of some ULX candidates for IMBHs. Indeed, since systems accreting close to the Eddington limit are rare, QSSs of the type studied in this paper may form the dominant population of accreting IMBHs.
Existing Chandra and XMM data should also contain QSSs in deep exposures taken toward the Galaxy’s center (Muno et al. 2003), and in data taken during pointed observations and archived as part of ChaMP (see Green et al. 2003) or ChaMPlane cf. Grindlay et al. 2003). A broadband selection procedure can be developed to select QSSs from among the other XRSs in these data sets. In order to be effective, it would require a larger number of energy bins above keV than we have used so far. A combination of broadband selection and spectral fits should then be able to identify QSSs. If the density in and near the Galactic plane is roughly per cubic kpc, we might expect to find roughly a dozen within a few kpc of Earth.
Identifying these systems would be important, because we can collect from them enough X-ray photons for good spectral fits. Perhaps even more important, we can hope to obtain optical IDs for some nearby systems, detemining the natures of the donor stars, measuring orbital parameters, studying disk properties at other wavebands, etc. In this way we may be able to determine the physical natures of some QSSs. Even one well-studied system will be significant; but it will be particularly important to develop a sample of QSSs, as it seems unlikely that all of them can be described by a single physical model.
6 Conclusions and Prospects
When we attempted to identify SSSs in other galaxies, we found that each galaxy harbors, in addition to SSSs, a large population of somewhat harder sources. QSSs and SSSs are found in elliptical and spiral galaxies, near galaxy centers, in and near the arms of spiral galaxies, in galaxy halos (Di Stefano & Kong 2003d), and in globular clusters (Di Stefano et al. 2003b; Di Stefano et al. 2004). Whether there is a smooth continuum between the softest and hardest sources, or whether there are preferred ranges within the continuum remains to be seen.
QSSs are XRSs whose spectra fill the gap between SSSs and luminous canonical X-ray sources. The challenge raised by their discovery is to understand what physical states they represent. With the same sort of broad definition used for SSSs, the class of QSSs is likely to include a variety of physical systems. Whatever the nature or natures of the sources, however, it seems clear that QSS behavior is introducing us to new regions of the parameter space. If, e.g., some QSSs are hot WDs, then we must understand (1) why the emitting regions are small, or (2) how a large portion of the soft radiation is upscattered, or (3) if there is a warm plasma or other emitting region associated with the system. In what way are WD QSSs different from the local WD systems?
If, on the other hand, QSSs are NSs, there are other sets of issues to be explored. What determines the range of photospheric radii? Are some of the soft sources X-ray pulsars, for which we are out of the path of the beamed emission? Can physical principles be used to predict the relative numbers of NS systems emitting soft or hard radiation?
Finally, any QSSs that are accreting BHs raise different questions. Can we use the discovery of QSSs to identify BHs in distant galaxies? What fracion are IMBHs? Are the QSSs we have discovered in the GCs of M104 and NGC 4472 BHs with masses above that of typical stellar-mass BHs? If so, do they represent the BHs predicted to exist at the center of some star clusters?
In summary, the discovery of QSSs should inspire theoretical work on possible hard states of hot WDs, and possible soft states of luminous SNRs, NS accretors, and BH accretors across a range of masses. Although we have argued that IMBH models are promising, it is likely that several models are realized in nature. The key point is that the generation of radiation in the QSS regime points to new sets of active states.
Longer observations of the galaxies in our study will provide more detailed and reliable fits for the brightest sources and allow fits to be carried out for some of the dimmer QSSs. Additional observations will also provide checks for time variability, which can help distinguish between X-ray binaries and SNRs and to determine the applicability of stellar-mass BH models. Searches for QSSs in our own Galaxy are nearly certain to yield individual systems close enough to be subject to detailed study across wavebands, perhaps elucidating the natures of the sources.
References
- (1)
- (2) Cash, W. 1979, ApJ, 228, 939
- (3)
- (4) Cropper, M., Soria, R., Mushotzky, R.F., Wu, K., Markwardt, C.B., & Pakull, M. 2004, MNRAS, in press (astro-ph/0311302)
- (5)
- (6) Di Stefano, R. 2004, in preparation.
- (7)
- (8) Di Stefano, R. & Kong, A.K.H. 2003a, ApJ, 592, 884
- (9)
- (10) Di Stefano, R. & Kong, A.K.H. 2003b, ApJ, submitted (astro-ph/0311374)
- (11)
- (12) Di Stefano, R. & Kong, A.K.H. 2003c, ApJ, in press (astro-ph/0311375)
- (13)
- (14) Di Stefano, R. & Kong, A.K.H. 2003d, Nature, submitted
- (15)
- (16) Di Stefano, R. et al. 2003a, ApJ, in press (astro-ph/0306440)
- (17)
- (18) Di Stefano, R., Kong, A.K.H., VanDalfsen, M.L., Harris, W.E., Murray, S.S. & Delain, K.M. 2003b, ApJ, 599, 1067
- (19)
- (20) Di Stefano, R., Friedman, R., Kundu, A. & Kong, A.K.H. 2003c, ApJL, submitted (astro-ph/0312391)
- (21)
- (22) Di Stefano R. 2003, “The Importance of Monitoring Soft X-Ray Sources”, To appear in the proceedings of the workshop: X-Ray Timing 2003: Rossi and Beyond, P. Kaaret and J. Swank editors
- (23)
- (24) Fritz, G., Shulman, S., Yentis, D., Friedman, H., Davidsen, A., Henry, R., Snyder, W., & Naranan, S. 1976, ApJ, 207, L29
- (25)
- (26) Green, P. J. et al. 2003, Astronomische Nachrichten, 324, 93
- (27)
- (28) Grindlay et al. 2003, AN, 324, 57
- (29)
- (30) Homan, J., Wijnands, R., van der Klis, M., Belloni, T., van Paradijs, J., Klein-Wolt, M., Fender, R., & Méndez, M. 2001, ApJS, 132, 377
- (31)
- (32) Hughes, J. P., Hayashi, I., & Koyama, K. 1998, ApJ, 505, 732
- (33)
- (34) Iben, I., Jr. 1982. ApJ, 259, 244
- (35)
- (36) Immler, S., Wang, Q. D., Leonard, D. C., & Schlegel, E. M. 2003, ApJ, 595, 727
- (37)
- (38) Kong, A. K. H. & Di Stefano, R. 2003, ApJ, 590, L13
- (39)
- (40) Kong, A. K. H., Garcia, M. R., Primini, F. A., & Murray, S. S. 2002, ApJ, 580, L125
- (41)
- (42) Kong, A. K. H., Sjouwerman, L. O., Williams, B. F., Garcia, M. R., & Dickel, J. R. 2003, ApJ, 590, L21
- (43)
- (44) Kong, A. K. H. 2003, MNRAS, 346, 265
- (45)
- (46) Kohno, M., Yokogawa, J., & Koyama, K. 2000, PASJ, 52, 299
- (47)
- (48) Liu, Q. Z., van Paradijs, J., & van den Heuvel, E. P. J. 2001, A&A, 368, 1021
- (49)
- (50) McClintock, J.E. & Remillard, R.A. 2004, astro-ph/0306213
- (51)
- (52) Muno, M. P. et al. 2003, ApJ, 589, 225
- (53)
- (54) Kylafis, N. D. & Xilouris, E. M. 1994, AIP Conf. Proc. 308: The Evolution of X-ray Binariese, 308, 650
- (55)
- (56) Miller, J. M., Fabbiano, G., Miller, M. C., & Fabian, A. C. 2003, ApJ, 585, L37
- (57)
- (58) Miller, M.C. & Colbert, E.J.M. 2003, Int. J. of Modern Phys D., submitted (astro-ph/0308402)
- (59)
- (60) Miller, J.M., Fabian, A.C., & Miller, M.C. 2004, ApJ, submitted (astro-ph/0310617)
- (61)
- (62) Nomoto, K. 1982, ApJ, 253,798
- (63)
- (64) Pakull, M.W., & Mirioni, L. 2002, in the proceedings of the symposium ’New Visions of the X-ray Universe in the XMM-Newton and Chandra Era’ (astro-ph/0202488)
- (65)
- (66) Patnaude, D. J. & Fesen, R. A. 2003, ApJ, 587, 221
- (67)
- (68) Rappaport, S., Di Stefano, R., Smith, J.D. 1994, ApJ, 426, 692
- (69)
- (70) hulman, S., Friedman, H., Fritz, G., Yentis, D. J., & Henry, R. C. 1975, ApJ, 199, L101
- (71)
- (72) Sobczak, G. J., McClintock, J. E., Remillard, R. A., Cui, W., Levine, A. M., Morgan, E. H., Orosz, J. A., & Bailyn, C. D. 2000, ApJ, 544, 993
- (73)
- (74) Soria, R. & Wu, K. 2002, A&A, 384, 99
- (75)
- (76) Soria, R. & Wu, K. 2003, A&A, 410, 53
- (77)
- (78) van den Heuvel, E. P. J., Bhattacharya, D., Nomoto, K., & Rappaport, S. A. 1992, A&A, 262, 97
- (79)
- (80) Wijnands, R. & Miller, J. M. 2002, ApJ, 564, 974
- (81)
- (82) Wijnands, R. & Miller, J. M. 2002, ApJ, 564, 974
- (83)
- (84) Zampieri, L., Mucciarelli, P., Falomo, R., Kaaret, P., Di Stefano, R., Turolla, R., Chieregato, M., & Treves, A. 2004, ApJ, 603, 523
- (85)