Search for neutrino-induced cascades with AMANDA
Abstract
We report on a search for electro-magnetic and/or hadronic showers (cascades) induced by high energy neutrinos in the data collected with the AMANDA II detector during the year 2000. The observed event rates are consistent with the expectations for atmospheric neutrinos and muons. We place upper limits on a diffuse flux of extraterrestrial electron, tau and muon neutrinos. A flux of neutrinos with a spectrum which consists of an equal mix of all flavors, is limited to at a 90% confidence level for a neutrino energy range 50 TeV to 5 PeV. We present bounds for specific extraterrestrial neutrino flux predictions. Several of these models are ruled out.
keywords:
Neutrino Telescopes, Neutrino astronomy, AMANDAPACS:
95.55.Vj,95.85.Ry,96.40.Tv1 Introduction
The existence of high-energy extraterrestrial neutrinos is suggested by the observation of high-energy cosmic rays and gamma rays. Observation of neutrinos could shed light on the production and acceleration mechanisms of cosmic-rays, which for energies above the “knee” () remain not understood. Cosmic rays are thought to be accelerated at the shock fronts of galactic objects like supernova remnants, micro-quasars, and in extragalactic sources such as the cores and jets of active galactic nuclei (AGN) [1]. High energy protons accelerated in these objects may collide with the gas and radiation surrounding the acceleration region, or with matter or radiation between the source and the Earth. Charged pions, produced in the interaction, decay into highly energetic muon neutrinos and muons which further decay into electron neutrinos. Fermi acceleration of charged particles in magnetic shocks naturally leads to power-law spectra, , where is typically close to 2. Hence, the spectrum of astrophysical neutrinos is harder than the spectrum of atmospheric neutrinos () potentially allowing to distinguish the origin of the flux (see for example [2]).
For a generic astrophysical neutrino source, one expects a ratio of neutrino fluxes . Due to neutrino vacuum oscillations this ratio changes to by the time the neutrinos reach the Earth. Recently a search with the AMANDA detector was reported [3], resulting in the most restrictive upper limit on the diffuse flux of muon neutrinos (in the energy range 6 to 1000 TeV). Clearly, a high sensitivity to neutrinos of all neutrino flavors is desirable. The present paper reports on a search for a diffuse flux of neutrinos of all flavors performed using neutrino-induced cascades in AMANDA.
2 The AMANDA Detector
AMANDA-II [4] is a Cherenkov detector consisting of 677 photomultiplier tubes (PMTs) arranged on 19 strings. It is frozen into the Antarctic polar ice cap at a depth ranging mainly from 1500 to 2000 m. AMANDA detects high-energy neutrinos by observation of the Cherenkov light from charged particles produced in neutrino interactions. The detector was triggered when the number of PMTs with signal (hits) reaches 24 within a time-window of 2.5 s.
The standard signatures are neutrino-induced muons from charged current (CC) interactions. The long range of high energy muons, which leads to large detectable signal event rates and good angular resolution results in restrictive bounds on neutrino point-sources [5].
Other signatures are hadronic and/or electro-magnetic cascades generated by CC interaction of and . Additional cascade events from all neutrino flavors are obtained from neutral current interactions. Good energy resolution, combined with low background from atmospheric neutrinos makes the study of cascades a feasible method to search for extraterrestrial high energy neutrinos.
3 Update on Cascade Search with AMANDA-B10
Before the completion of AMANDA-II, the detector was operated in a smaller configuration. The results for the search of neutrino induced cascades in 130.1 effective days of the 10-string AMANDA-B10 detector during 1997 have been reported before [6]. The same analysis has been applied to 221.1 effective days of experimental data collected during 1999. The AMANDA detector in 1999 had three more strings than in 1997, yet data from these strings were not used in this analysis, so that the detector configuration used in the 1999 neutrino induced cascade search is very similar to that of 1997.
Signal simulation for the analysis of 1999 data was improved to the standards reported in this letter. No events were found in the 1999 experimental data after all selection criteria had been applied. We will present results supposing a background of zero events.
Using the procedure explained in this letter we obtain an upper limit on the number of signal events of =2.75 at a 90% confidence level, from which we calculate the limit on the flux of all neutrino flavors. Assuming a flux consisting of an equal mix of all flavors, one obtains an upper limit . In the calculation of this limit we included a systematic uncertainty on the signal detection efficiency of 32%. About 90% of the simulated signal events for this limit have energies between 5 and 300 TeV, while 5% have lower and 5% have higher energy. Differences between this result and the one obtained with 1997 experimental data [6] are due to the larger live-time in 1999 and improved simulation.
4 Data Selection and Analysis for AMANDA-II
The data set of the first year of AMANDA-II operation comprises triggered events collected over 238 days between February and November, 2000, with 197 days live-time after correcting for detector dead-time.
The background of atmospheric muons was simulated with the air-shower simulation program CORSIKA (v5.7) [7] using the average winter air density at the South Pole and the QGSJET hadronic interaction model [8]. The cosmic ray composition was taken from [9]. All muons were propagated through the ice using the muon propagation program MMC (v1.0.5) [10]. The simulation of the detector response includes the propagation of Cherenkov photons through the ice as well as the response of the PMTs and the surface electronics.
Besides generating unbiased background events, the simulation chain was optimized to the higher energy threshold of this analysis. By demanding that atmospheric muons passing through the detector radiate a secondary with an energy of more than 3 TeV, the simulation speed is increased significantly. A sample equivalent to 920 days of atmospheric muon data was generated with the optimized simulation chain.
The simulation of and events was done using the signal generation program ANIS (v1.0) [11]. The simulation includes CC and neutral current (NC)interactions as well as production in the channel near 6.3 PeV (Glashow resonance). All relevant neutrino propagation effects inside the Earth, such as neutrino absorption or regeneration are included in the simulation.
The data were reconstructed with methods described in Ref. [6]. Using the time information of all hits, a likelihood fit results in a vertex resolution for cascade-like events of about 5 m in the transverse coordinates (x,y) and slightly better in the depth coordinate (z). The reconstructed vertex position combined with a model for the energy dependent hit-pattern of cascades allows the reconstruction of the energy of the cascade using a likelihood method. The obtained energy resolution in lies between 0.1 and 0.2. The performance of the reconstruction methods have been verified using in situ light sources.
| # | cut variable | exp. | MC | |||
|---|---|---|---|---|---|---|
| atm. | atm. | |||||
| 1 | 0.058 | 0.033 | 0.94 | 0.63 | ||
| 2 | 0.030 | 0.016 | 0.89 | 0.57 | ||
| 3 | 0.0027 | 0.0012 | 0.39 | 0.35 | ||
| 4 | 0.0018 | 0.00077 | 0.35 | 0.26 | ||
| 5 | 0.0010 | 5.9 | 0.28 | 0.18 | ||
| 6 | 8.6 | 5.1 | 0.26 | 0.15 | ||
| 7 | 9.7 | 4.8 | 0.040 | 0.091 | ||
| 8 | 8 | 7 | 2.8 | 0.029 |
Eight cuts were used to reduce the background from atmospheric muons by a factor . The different cuts are explained below. The cumulative fraction of events that passed the filter steps are summarized in Table 1.
Since the energy spectrum of the background is falling steeply one obtains large systematic uncertainties from threshold effects in this analysis. For example, an uncertainty of 30% in the photon detection efficiency translates to up to a factor uncertainty in rate. Such effects can explain the discrepancies of Table 1 in passing efficiencies between atmospheric muon background simulation and experimental data. However, as will be shown later, the threshold effects are smaller for harder signal-like spectra.
At the lowest filter levels (cuts 1 and 2), variables based on a rough first-guess vertex position reconstruction are used to reduce the number of background events by about a factor of 30. It is useful to define the time residual of a hit as the time delay of the hit time relative to the time expected from unscattered photons. The number of hits with a negative time residual, , divided by the number of all hits, , in an event should be small. This first cut criterion is effective since early hits are not consistent with the expectation from cascades, while they are expected from long muon tracks. Cut 2 enforces that the number of so called direct hits, (photons having a time residual between 0 and 200 ns), is large.
Cut 3 is a requirement on the reduced likelihood parameter resulting from the standard vertex fit, (see also [6]). Note, that the likelihood parameter is, in analogy to a reduced , defined such that smaller values indicate a better fit result, hence a more signal-like event. In a similar manner, the resulting likelihood value from the energy fit, , is used as a selection criterion (cut 4). However, since the average value of has an energy dependence, the cut value is a function of the reconstructed energy, . Cut 5 on the reconstructed coordinate, , was introduced to remove events which are reconstructed outside AMANDA and in regions where the simulation of the ice properties for photon propagation is insufficient. While the upper boundary coincides roughly with the detector boundary, the lower value is about 100 m above the geometrical border of the detector. Restricting improves significantly the description of the remaining experimental data (for example the reconstructed energy spectrum) [12].
Only events reconstructed with a radial distance to the detector z-axis, m, are accepted (cut 6), unless their reconstructed energies lie above 10 TeV. For each decade in energy above 10 TeV one allows the maximal radial distance to grow by 75 m. This reflects the fact that the cascade radius111We define the cascade event radius as the direction averaged distance from the vertex at which the average number of registered photon-electrons is equal to 1., increases as a function of energy, while the expected amount of background decreases.
Three discriminating variables are used to form the final quality parameter :
-
1.
The value of the reduced likelihood parameter resulting from the vertex fit, . Note that this variable has been used previously in cut 3.
-
2.
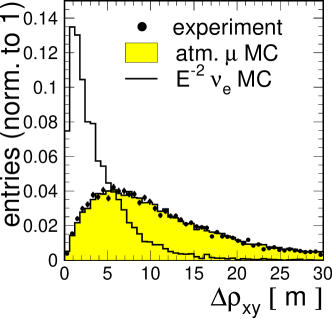
The difference in the radial distance of the vertex position reconstructed with two different hit samples, . While the first reconstruction is the regular vertex reconstruction using all hits, the second reconstruction uses only those hits outside a 60 m sphere around the vertex position resulting from the first reconstruction. Since the close-by hits typically contribute most to the likelihood function, their omission allows to test the stability of the reconstruction result. If the underlying event is a neutrino-induced cascade, the second reconstruction results in a vertex position close to that of the first reconstruction. In case of a misidentified muon event, removing hits located close to the vertex typically results in a significantly different reconstructed position.
-
3.
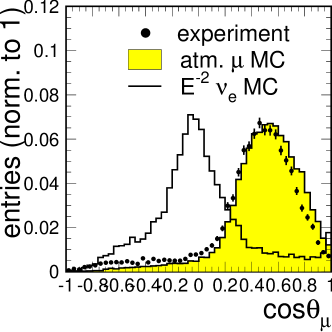
The cosine of the angle of incidence as reconstructed with a muon-track fit. The muon-track fit assumes for the underlying likelihood parametrization that the hit pattern originates from a long range muon track. The fit allows to reconstruct correctly a large fraction of the atmospheric muons.
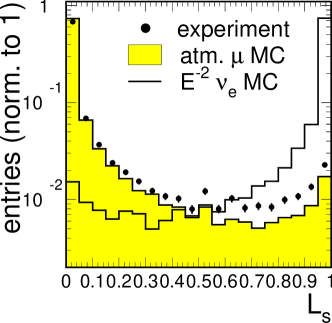
The final quality parameter is defined as a likelihood ratio:
| (1) |
where runs over the three variables. ( for signal and for background) are probability density functions defined as . correspond to the probability density functions of the individual variables for background due to atmospheric muons and signal consisting of a flux of with a spectral slope . They are obtained from simulations.
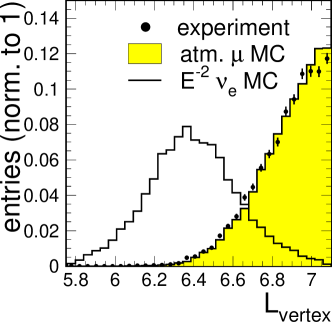
The distributions of the individual variables as well as of the likelihood ratio are shown in Fig. 1 for experimental data, atmospheric muon background and signal simulations. The experimental distributions of and approximately agree with those from the simulation while the distribution of shows some larger deviations. The deviation reflects an simplified description of the photon propagation through the dust layers in the ice [12]. The experimental distribution is not perfectly described by the atmospheric muon simulation, which is mainly related to the mis-match in the distribution. The related uncertainties in the cut efficiencies are included in the final results.
At this stage of the event selection one is left with events due to atmospheric muons, which happen to radiate (mostly through bremsstrahlung) a large fraction of their energy into a single electro-magnetic cascade. The reconstructed energy corresponds to that of the most energetic secondary-particle cascade produced in the near vicinity of the detector. To optimize the sensitivity of the analysis to an astrophysical flux of neutrinos, a further cut on the reconstructed energy, , was introduced.
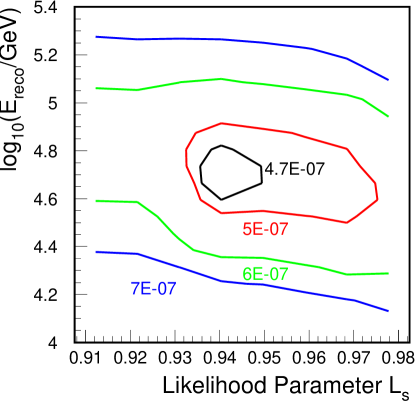
The sensitivity is defined as the average upper limit on the neutrino flux obtained from a large number of identical experiments in the absence of signal [13, 14]. The sensitivity was calculated for a flux of with spectrum . A flux of was used for optimization, since -induced events always have cascade-like signatures. The sensitivity is shown in Fig. 2 as a function of the and cut. and TeV were chosen in this two dimensional optimization procedure such that the average upper limit is lowest. With these cuts the expected sensitivity for an spectrum of electron neutrinos is .
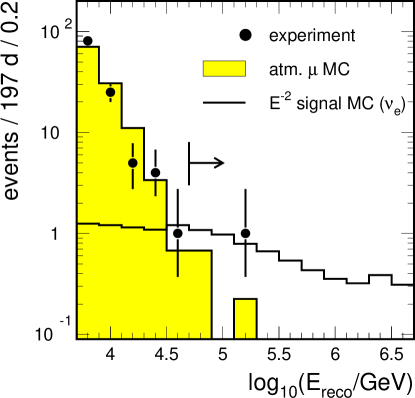
The energy spectra of experimental data as well as signal and background simulations after all but the final energy cut are shown in Fig. 3. Note that the energy spectrum begins at 5 TeV, since this is the lowest energy for which the optimized background simulation is applicable. The number of events due to simulated atmospheric muons was normalized to that observed in the experiment.
One experimental event passes all cuts, while events are expected from atmospheric muons and a small contribution from atmospheric neutrinos.
The spectrum as obtained from simulation of atmospheric muons passing cut 7 was normalized to the number of experimental events resulting in an expectation of events due to atmospheric muons. The three main sources to the error are given by limited statistics of simulated atmospheric muon events (the error of was determined using the Feldman-Cousins method [14]), uncertainties in the cut efficiency ( obtained from variation of the cuts) and limited knowledge of the ice properties ( obtained from variation of the ice properties in the simulation). The total error was obtained by adding the individual errors in quadrature.
The predicted event number from atmospheric neutrinos simulated according the flux of Lipari [15] is , where the uncertainties are mainly due to uncertainties in ice properties (error of obtained from variation of the ice properties in simulation), and in detection efficiencies of Cherenkov photons ( obtained from variation of the photon detection sensitivity in the simulation). The theoretical uncertainties in the flux of atmospheric neutrinos was estimated to be about 25% [16] and is small when compared with the other uncertainties. Again, the total error was obtained by adding the individual errors in quadrature.
The uncertainty in the detection efficiency of neutrino events from an astrophysical flux with a spectral index are estimated to be not larger than 25 %. Because of the flatter energy spectrum, the uncertainties related to the energy threshold (such as the photon detection efficiency) result in smaller uncertainties in rate when compared to the uncertainties found for atmospheric neutrino events. The main sources of error are again uncertainties in the simulation of the ice properties () and the detection efficiencies of the Cherenkov photons ().
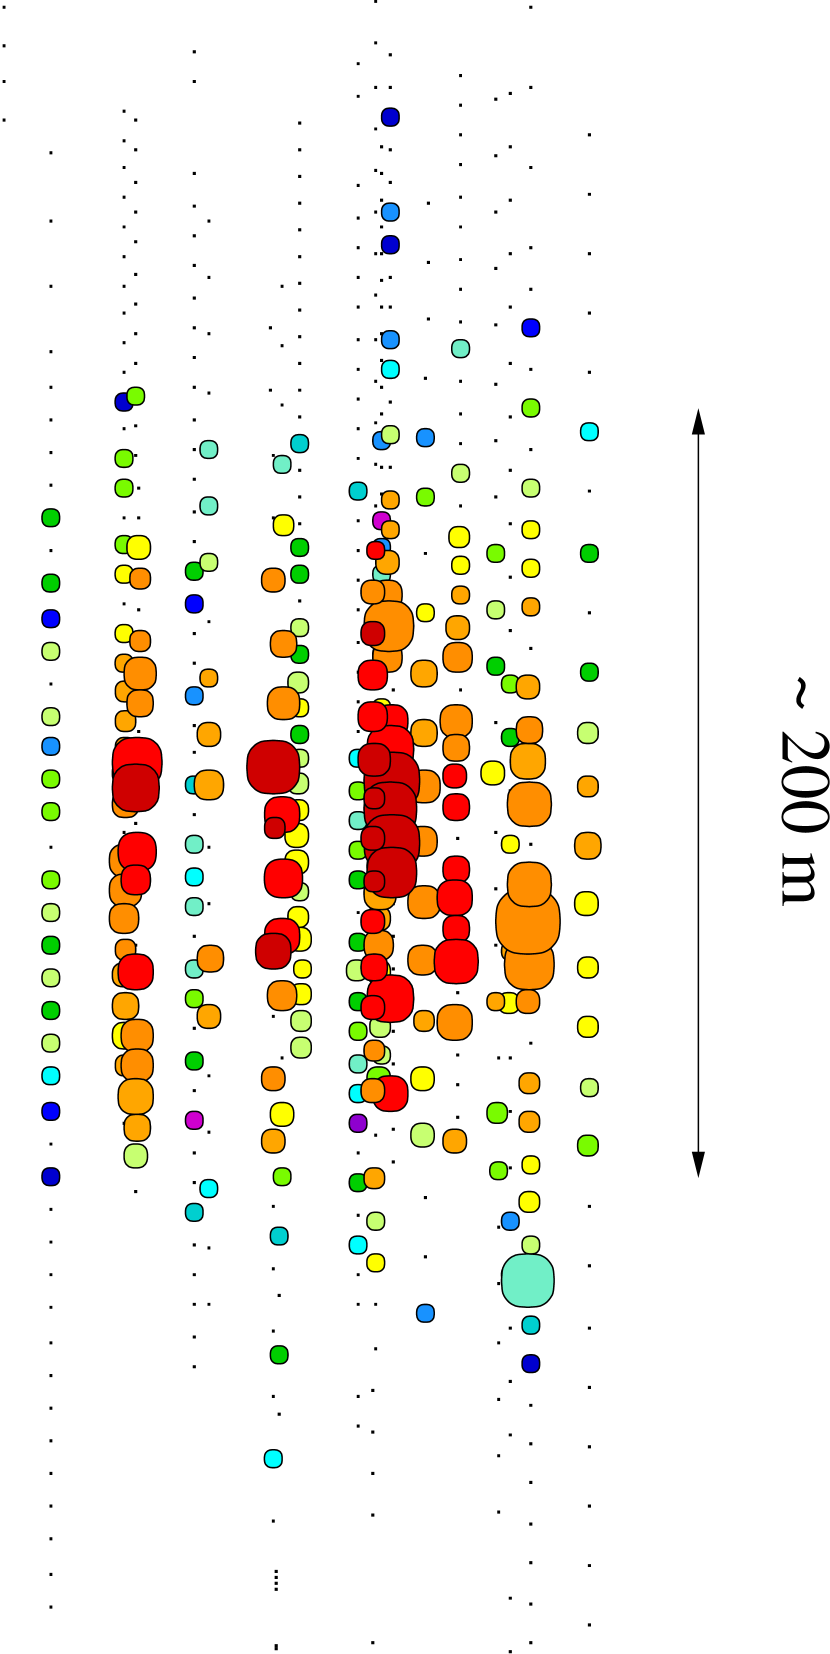
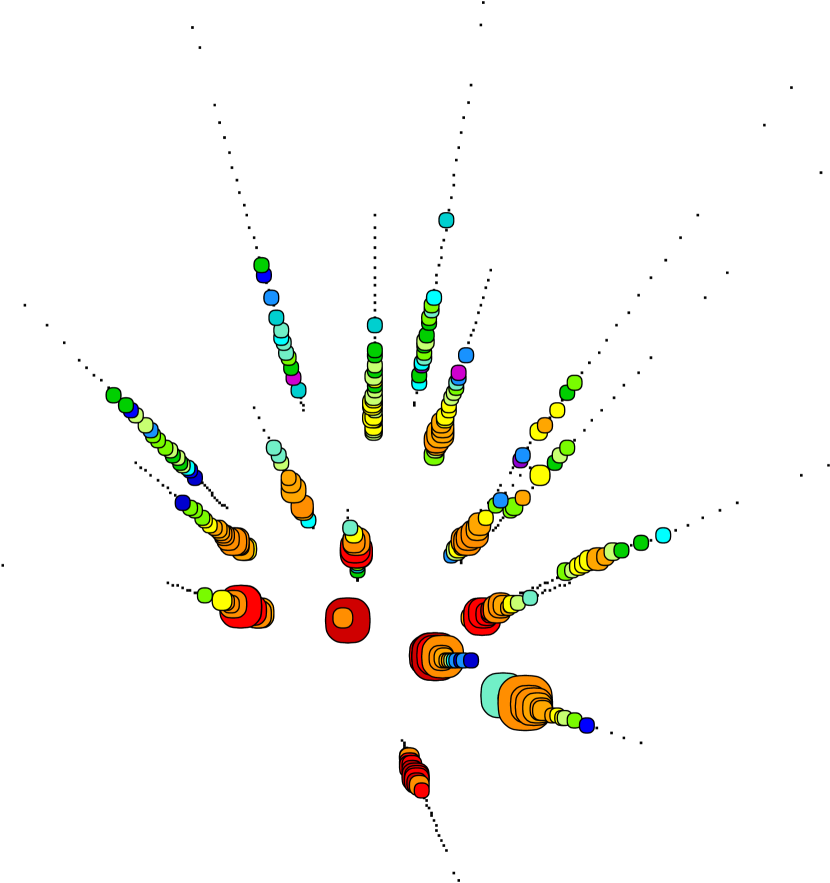
The experimental event which passed all selection criteria is shown in Fig. 4.
The sensitivity of the detector to neutrinos can be characterized by its effective volume, , or area, , remaining after all cuts are applied. represents the volume, in which neutrino interactions are observed with full efficiency while represents the area with which a neutrino flux can be observed with full efficiency. While the concept of is more intuitive because it relates to the geometrical size of the detector, the concept of is more convenient for calculations of neutrino rates (see Eq. 2 in Sect. 5).


Figure 5 shows as obtained from simulation for all three neutrino flavors as a function of the neutrino energy. The effective volume has been averaged over all neutrino arrival directions. As can be seen, rises for energies above the threshold energy of 50 TeV. Above PeV-energies decreases for and , an effect related to both reduced filter efficiencies and neutrino absorption effects. In the case of , the volume saturates because of regeneration effects: and because of the event event topology: there is an increase in detection probability for CC interactions (with energies above GeV) because the cascade from the hadronic vertex and the cascade arising from the subsequent tau decay are separated far enough in space to be detected independently.
Fig. 6 shows as obtained from simulation for all three neutrino flavors as a function of the neutrino energy. Note that is small because of the small neutrino interaction probability, which is included in the calculation of (but not in ).
The detector sensitivity varies only weakly as a function of the neutrino incidence angles. However, because of neutrino propagation effects effective area and volume are suppressed for neutrinos coming from positive declinations.
The effect of the resonant increase of the cross-section for at the Glashow resonance is not included in shown in Fig. 6. For energies between and GeV the average effective area including Earth propagation effects is .
5 Results
| Model | |||||
|---|---|---|---|---|---|
| 2.08 | 0.811 | 1.28 | 4.18 | 0.86 | |
| SDSS [19] | 4.20 | 1.91 | 2.77 | 8.88 | 0.40 |
| SS Quasar [20] | 8.21 | 3.57 | 5.30 | 17.08 | 0.21 |
| SP u [21] | 33.0 | 13.0 | 20.5 | 66.6 | 0.054 |
| SP l [21] | 6.41 | 2.34 | 3.98 | 12.7 | 0.28 |
| P [22] | 5.27 | 1.57 | 2.86 | 9.70 | 0.37 |
| P [22] | 0.84 | 0.40 | 0.56 | 1.80 | 1.99 |
| MPR [23] | 0.38 | 0.18 | 0.25 | 0.81 | 4.41 |
Since no excess events have been observed above the expected backgrounds, upper limits on the flux of astrophysical neutrinos are calculated. The uncertainties in both background expectation and signal efficiency, as discussed above, are included in the calculation of the upper limits. We assume a mean background of 0.96 with a Gaussian distributed relative error of 73%, and an error on the signal detection efficiency of 25%. For a 90% confidence level an upper limit on the number of signal events, , is obtained using the Cousins-Highland [17] prescription implemented by Conrad et al. [18], with the unified Feldman-Cousins ordering [14]. Without any uncertainties the upper limit on the number of signal events would be 3.4.
The effective area can be used to calculate the expected event numbers for any assumed flux of neutrinos of flavor , :
| (2) |
with being the live-time. If is larger than , the model is ruled out at 90% CL. Table 2 summarizes the predicted event numbers for different models of hypothetical neutrino sources. Thereby, the spectral forms of and are assumed to be the same (the validity of this approximation is discussed in [12]). Furthermore, full mixing of neutrino flavors is assumed, hence as well as a ratio .
Electron neutrinos contribute about 50% to the total event rate, tau neutrinos about 30% and muon neutrinos about 20%. For the sum of all neutrino flavors the various predicted fluxes are shown in Fig. 7.
The models by Stecker et al. [19] labeled “SDSS” and its update [20] “SS Q”, as well as the models by Szabo and Protheroe [21] “SP u” and “SP l” represent models for neutrino production in the central region of Active Galactic Nuclei. As can be seen from Table 2, these models are ruled out with . Further shown are models for neutrino production in AGN jets: a calculation by Protheroe [22], which includes neutrino production through and collisions (models “P ” and “P ”) as well as an evaluation of the maximum flux due to a superposition of possible extragalactic sources by Mannheim, Protheroe and Rachen [23] (model “MPR”). The latter two models are currently not excluded.
For a neutrino flux of all flavors with spectrum one obtains the limit:
For such a spectrum, about 90% of the events detected have neutrino energies between 50 TeV and 5 PeV,with the remainder equally divided between the ranges above and below. The limit is shown in Fig. 7 as a solid line ranging from 50 TeV to 5 PeV.

To illustrate the energy dependent sensitivity of the present analysis we restrict the energy range for integration of Eq. (2) to one decade. By assuming a benchmark flux where represents the unit flux and the Heaviside step-function (restricting the energy range to one decade), one obtains the number of events for a given central energy : . The limiting flux at the energy is then given by . The superposition of the limiting fluxes as a function of the central energy is shown in Fig. 8. For a flux the analysis has its largest sensitivity around 300 TeV.

The mentioned strong increase in effective area at the energy of the Glashow resonance allows setting of a limit on the differential flux of at 6.3 PeV. Re-optimizing the final energy cut for events interacting through the Glashow resonance results in an optimal cut, PeV. No experimental event has been observed in that energy range, which results in an upper limit on the number of signal events of assuming 25 % uncertainties in the signal expectation and negligible background expectation. The limit on the flux at 6.3 PeV is:
The transformation of this limit to a limit on a total neutrino flux is not completely straightforward, since the fraction of produced in the source is unknown. In cases of neutrino production through collisions one expects a ratio . Hence, one would expect that about 1/6 of all neutrinos are . However, the produced in the interaction through decay of the neutron carries only a very small fraction of the energy, and hence for most neutrino spectra contributes negligible to the high energy flux of neutrinos. For this case, a flux of results mainly from neutrino oscillations. For maximal neutrino mixing, would constitute 1/9 of the total neutrino flux. If the mixing is non-maximal, that fraction would be smaller.
6 Conclusion
We have presented experimental limits on diffuse extragalactic neutrino fluxes. We find no evidence for neutrino-induced cascades above the backgrounds expected from atmospheric neutrinos and muons. In the energy range from 50 TeV to 5 PeV, the presented limits on the diffuse flux are currently the most restrictive. We have compared our results to several model predictions for extragalactic neutrino fluxes and several of these models can be excluded.
Results from the first phase of AMANDA, the 10-string sub-detector AMANDA-B10, have been reported in [6] and an update to the analysis was presented above. Compared to AMANDA-B10, the analysis presented here has a nearly ten times larger sensitivity, mainly achieved through using the larger volume of AMANDA-II and by extending the search to neutrinos from all neutrino directions.
The limits presented here are also more than a factor of two below the AMANDA-B10 limit obtained by searching for neutrino-induced muons [3] and roughly as sensitive as the extension of that search using AMANDA-II 2000 data [24]. (Assuming a neutrino flavor ratio of 1:1:1, the numerical limits on the flux of neutrinos of a specific flavor (e.q. ) reported in the literature are 1/3 of the limits on the total flux of neutrinos.) The limits obtained from a search for cascade-like events by the Baikal collaboration [25] are about 50% less restrictive than the limits presented here.
With the present analysis one obtains a large sensitivity to astrophysical neutrinos of all flavors and in particular to electron and tau neutrinos. Hence, given the large sensitivity to muon neutrinos of other search channels, AMANDA can be considered an efficient all-flavor neutrino detector.
7 Acknowledgments
We acknowledge the support of the following agencies: National Science Foundation–Office of Polar Programs, National Science Foundation–Physics Division, University of Wisconsin Alumni Research Foundation, Department of Energy, and National Energy Research Scientific Computing Center (supported by the Office of Energy Research of the Department of Energy), UC-Irvine AENEAS Supercomputer Facility, USA; Swedish Research Council, Swedish Polar Research Secretariat, and Knut and Alice Wallenberg Foundation, Sweden; German Ministry for Education and Research, Deutsche Forschungsgemeinschaft (DFG), Germany; Fund for Scientific Research (FNRS-FWO), Flanders Institute to encourage scientific and technological research in industry (IWT), and Belgian Federal Office for Scientific, Technical and Cultural affairs (OSTC), Belgium; I.T. acknowledges support from Fundación Venezolana de Promoción al Investigador (FVPI), Venezuela; D.F.C. acknowledges the support of the NSF CAREER program.
References
- [1] F. Halzen and D. Hooper, Rep. Prog. Phys. 65 (2002) 1025.
- [2] J. G. Learned and K. Mannheim, Ann. Rev. Nucl. Part. Sci. 50 (2000) 679.
- [3] J. Ahrens et al. [AMANDA Collaboration], Phys. Rev. Lett. 90 (2003) 251101.
- [4] E. Andrés et al. [AMANDA Collaboration], Nature, 410 (2001) 441.
- [5] J. Ahrens et al. [AMANDA Collaboration], Phys. Rev. Lett. 92 (2004) 071102.
- [6] J. Ahrens et al. [AMANDA Collaboration], Phys. Rev. D 67 (2003) 012003.
- [7] D. Heck et al., FZKA 6019. (1993), see also http://www-ik3.fzk.de/heck/corsika.
- [8] N. N. Kalmykov, S. S. Ostapchenko and A. I. Pavlov, Nucl. Phys. Proc. Suppl. 52B (1997) 17.
- [9] B. Wiebel-Sooth, P. L. Biermann and H. Meyer, [arXiv:astro-ph/9709253].
- [10] D. Chirkin, and W. Rhode, Proc. Int. Cosmic Ray Conf. HE 220, Hamburg, Germany (2001), ed. G. Heinzelmann and K.-H. Kampert and C. Spiering.
- [11] M. Kowalski and A. Gazizov, Proc. Int. Cosmic Ray Conf. pp. 1459, Tsukuba, Japan (2003), ed. T. Kajita et al..
- [12] M. Kowalski, PhD thesis, Humboldt-University, Berlin (2003) (unpublished). http://area51.berkeley.edu/manuscripts/.
- [13] G. C. Hill and K. Rawlins, Astropart. Phys. 19 (2003) 393.
- [14] G. J. Feldman and R.D. Cousins, Phys. Rev. D57 (1998) 3873.
- [15] P. Lipari, Astropart. Phys. 1 (1993) 195.
- [16] T. K. Gaisser and M. Honda, Ann. Rev. Nucl. Part. Sci. 52 (2002) 153.
- [17] R. D. Cousins and V. L. Highland, Nucl. Instr. Meth. A320 (1992) 331.
- [18] J. Conrad et. al., Phys. Rev. D67 (2003) 012002.
- [19] F. W. Stecker et. al., Phys. Rev. Lett. 66 (1991) 2697 [Erratum-ibid. 69 (1992) 2738].
- [20] F. W. Stecker and M. H. Salamon, Space Sci. Rev. 75 (1996) 341.
- [21] A. P. Szabo and R. J. Protheroe, Proc. High Energy Neutrino Astrophysics, Honolulu, Hawaii (1992), ed. V.J. Stenger et al..
- [22] R. J. Protheroe, [arXiv:astro-ph/9612213].
- [23] K. Mannheim, R. J. Protheroe and J. P. Rachen, Phys. Rev. D 63 (2001) 023003.
- [24] G. C. Hill et al. [AMANDA Collaboration], Proc. Int. Cosmic Ray Conf. pp. 1317, Tsukuba, Japan (2003), ed. T. Kajita et al..
- [25] R. Wischnewski et al. [BAIKAL Collaboration], Proc. Int. Cosmic Ray Conf. pp. 1353, Tsukuba, Japan (2003), ed. T. Kajita et al..