EVIDENCE FOR SOLAR METALLICITIES IN MASSIVE STAR-FORMING GALAXIES at 11affiliation: Based, in part, on data obtained at the W.M. Keck Observatory, which is operated as a scientific partnership among the California Institute of Technology, the University of California, and NASA, and was made possible by the generous financial support of the W.M. Keck Foundation.
Abstract
We present results of near-IR spectroscopic measurements of 7 star-forming galaxies at . Drawn from a large spectroscopic survey of galaxies photometrically pre-selected by their colors to lie at , these galaxies were chosen for their bright rest-frame optical luminosities (). Most strikingly, the majority of the sample of 7 galaxies exhibit [NII]/ nebular emission line ratios indicative of at least solar H II region metallicities, at a lookback time of 10.5 Gyr. The broadband colors of the -bright sample indicate that most have been forming stars for more than a Gyr at , and have already formed stellar masses in excess of . The descendants of these galaxies in the local universe are most likely metal-rich and massive spiral and elliptical galaxies, while plausible progenitors for them can be found among the population of Lyman Break Galaxies. While the -bright galaxies appear to be highly evolved systems, their large luminosities and uncorrected star-formation rates of indicate that active star formation is still ongoing. The luminous UV-selected objects presented here comprise more than half of the high-redshift () tails of current -band-selected samples such as the K20 and Gemini Deep Deep surveys.
Subject headings:
galaxies: evolution — galaxies: high-redshift – galaxies: abundances1. Introduction
Rest-frame optical emission lines from extragalactic H II regions provide an important diagnostic of galactic chemical evolution and therefore serve as an independent gauge of the history of star formation in the universe. Furthermore, the chemical evolution of galaxies and of the IGM are interconnected processes since feedback from star formation in galaxies may be responsible for polluting the IGM with heavy elements over a wide range of redshifts (Heckman et al. 2000; Adelberger et al. 2003). Now, with the advent of sensitive near-infrared spectrographs on m class telescopes, it is possible to measure rest-frame optical nebular emission lines out to , and therefore to trace galactic chemical evolution over the bulk of cosmic history.
In the local universe, star-forming spiral and irregular galaxies display a strong correlation between their H II region oxygen abundances and optical luminosities, according to which more luminous and massive galaxies exhibit a higher degree of metal enrichment (Garnett & Shields 1987; Garnett 2002; Zaritsky et al. 1994; Lamareille et al. 2004; Tremonti et al. 2004). An analogous correlation is observed in elliptical galaxies, where chemical abundances are measured from the strengths of stellar magnesium and iron absorption line indices (Brodie & Huchra 1991). As we move to higher redshifts, the metallicity-luminosity relationship may evolve in both zero point and slope (Maier et al. 2004). Using a sample of 64 star-forming galaxies at drawn from the Deep Extragalactic Evolutionary Probe Groth Strip Survey (DGSS), Kobulnicky et al. (2003) demonstrate that galaxies at are magnitudes more luminous than local galaxies of similar metallicity. In contrast, Lilly et al. (2003) find that a majority of a sample of 66 star-forming galaxies at drawn from the Canada-France Redshift Survey (CFRS) have similar metallicities to galaxies in the local universe with comparable luminosities. At much higher redshift, , most of the information about the abundances of galaxies has been derived from absorption lines in Damped Lyman Alpha systems (DLAs) (e.g., Pettini et al. 1997; Prochaska & Wolfe 2002). However, relating line-of-sight DLA absorption abundances to abundances measured from global galactic H II emission-line spectra is not trivial, at least in part because the relationship of DLAs themselves to high-redshift UV-selected galaxies has not been established. There are only limited data on the H II region oxygen abundances of star-forming galaxies at . A sample of six galaxies has been assembled with near-infrared spectroscopic observations of the strong nebular emission lines that enable abundance estimates (Pettini et al. 2001; Kobulnicky & Koo 2000). While there are only rough constraints on the abundances in these galaxies, with , they are seen to be magnitudes more luminous than local galaxies of similar metallicity.
Until now, there have been virtually no observations of the H II region metallicities in star-forming galaxies at , even though this critical epoch may host the production of a large fraction of the heavy elements present in the local universe. Galaxies in the “redshift desert” range have only recently become accessible for detailed study due, in large part, to improvements in both near-UV and spectroscopic capabilities on m class telescopes. Employing new technologies, several current surveys utilizing complementary selection techniques contain spectroscopically confirmed galaxies at these redshifts. The selection criteria include optical colors (Steidel et al. 2004; Adelberger et al. 2004), -band magnitude (Cimatti et al. 2002; Glazebrook et al. 2004), color (Franx et al. 2003), and submillimeter flux (Chapman et al. 2003). A complete picture of the galaxy population at will require an understanding of how these several selection techniques overlap and complement each other.
As shown by Pettini & Pagel (2004) and Steidel et al. (2004), H II region metallicities can be measured in redshift desert galaxies using the ratio of the [NII] and nebular emission lines. Here we present near-infrared (-band) spectroscopic observations of [NII] and emission for a small sample of UV-selected star-forming galaxies at . These galaxies were selected for observation because they are luminous in the rest-frame optical (), and therefore application of the same observational strategy yields much higher signal-to-noise (S/N) spectra than previous near-infrared spectroscopic observations of fainter galaxies (Erb et al. 2003). Along with the spectroscopic observations, which probe the metal content of the galaxies, we also use broad-band optical/near-infrared colors to estimate their stellar populations and masses. With such information, it is possible to consider the build-up of stellar mass in the early universe, and the epoch at which the progenitors of massive galaxies in the local universe were mostly assembled.
The sample of galaxies and near-infrared spectroscopic observations are described in §2. In §3, the results of the and [NII] spectroscopic measurements are presented. Oxygen abundances are derived from these results in §4. In §5, the discussion is extended to the galaxy metallicity-luminosity relationship, the stellar populations and masses of the luminous sample, a comparison of this sample with other recent surveys, and a comment on inferring stellar masses from population synthesis modeling versus dynamical masses from line-widths. Finally, in §6, we summarize our main conclusions. For all luminosity, star-formation rate, and stellar mass calculations, we adopt a cosmology with , , and .
2. Sample and Observations
| Galaxy | R.A. (J2000) | Dec. (J2000) | aaVacuum heliocentric redshift of Ly emission line, when present. | bbVacuum heliocentric redshift from rest-frame UV interstellar absorption lines. | ccVacuum heliocentric redshift of H emission line. | Exposure (s) | ||||
|---|---|---|---|---|---|---|---|---|---|---|
| Q1623-BX274 | 16 25 38.202 | 26 45 57.141 | 2.415 | 2.408 | 2.4100 | 23.23 | 0.25 | 0.89 | 3.66 | 3900 |
| Q1623-MD66 | 16 25 40.392 | 26 50 08.878 | 2.111 | 2.1075 | 23.95 | 0.37 | 1.40 | 4.04 | 3900 | |
| Q1623-BX341 | 16 25 43.554 | 26 46 36.942 | 2.377 | 24.83 | 0.47 | 0.90 | 4.81 | 2900 | ||
| Q1623-BX344ddBX344 was observed with a 057 slit, while all other galaxies were observed with a 076 slit. | 16 25 43.931 | 26 43 41.977 | 2.422 | 2.4224 | 24.42 | 0.39 | 1.25 | 4.41 | 2900 | |
| Q1623-BX453 | 16 25 50.836 | 26 49 31.399 | 2.183 | 2.171 | 2.1816 | 23.38 | 0.48 | 0.99 | 3.65 | 3900 |
| Q1623-BX513 | 16 25 55.856 | 26 46 50.304 | 2.249 | 2.244 | 2.2473 | 23.25 | 0.26 | 0.68 | 3.33 | 2900 |
| Q1623-BX528 | 16 25 56.439 | 26 50 15.444 | 2.266 | 2.2682 | 23.56 | 0.25 | 0.71 | 3.87 | 4900 | |
| Q1623-BX599 | 16 26 02.545 | 26 45 31.900 | 2.329 | 2.3304 | 23.44 | 0.22 | 0.80 | 3.65 | 4900 | |
| Q1623-BX663eeThe H emission in BX663 has a two distinct peaks, one at , as listed above, and another at . | 16 26 04.576 | 26 48 00.202 | 2.435 | 2.4333 | 24.14 | 0.24 | 1.02 | 4.26 | 3900 |
The objects discussed here were drawn from the survey presented by Steidel et al. (2004). This survey photometrically identifies star-forming galaxies at by their locations in vs. color space. Objects satisfying the optical color criteria presented in Adelberger et al. (2004) have been followed up spectroscopically using the Low Resolution Imaging Spectrometer on the Keck I telescope (Oke et al. 1995). To date, 692 galaxies have been spectroscopically confirmed with . The survey has been conducted in seven separate fields, five of which contain one or more bright background QSOs at in order to study the evolving relationship between star-forming galaxies, gas and metals in the intergalactic medium (IGM). The remaining two pointings are the GOODS-N and Westphal/Groth fields, both of which have extensive multi-wavelength datasets that are or will soon be publicly available. In addition to optical imaging and spectroscopic data, in June and October 2003 we obtained near-infrared -band photometry for galaxies in three of the survey QSO fields using the Wide Field Infrared Camera (WIRC) on the Palomar 5.1 m Hale telescope. magnitudes have been measured for 283 spectroscopically confirmed galaxies at , with . One of these three fields, Q1623 (1623+27), contains 167 spectroscopically confirmed galaxies at in the region covered by WIRC, 121 of which were detected at .
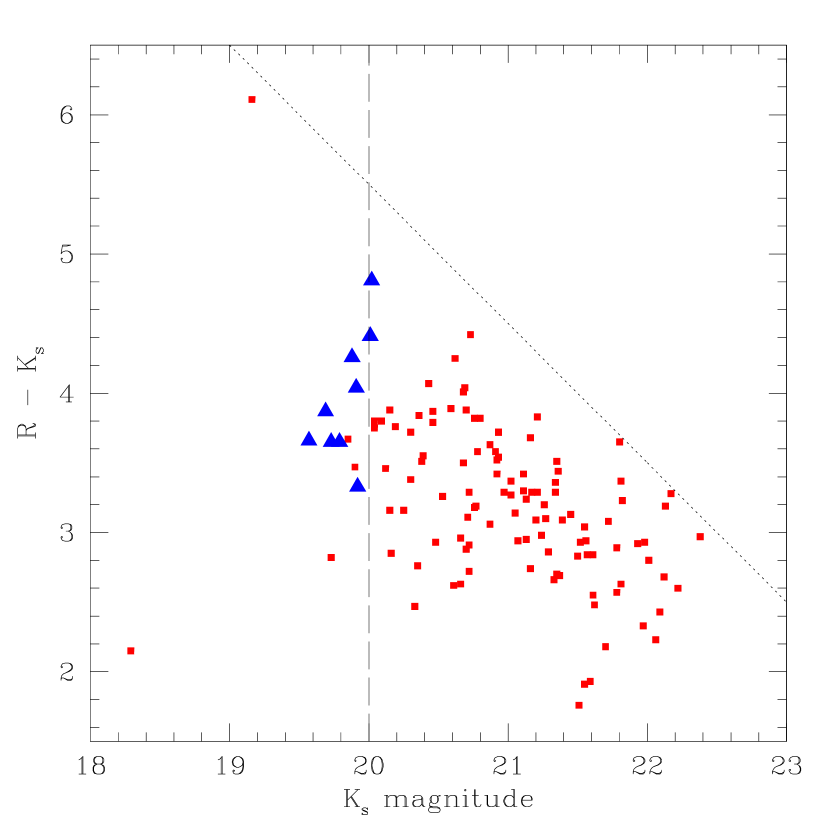
At the redshifts probed in the sample, -band corresponds most closely to rest-frame optical -band, and for -band spectroscopic observations cover the and [N II] nebular emission lines. Using NIRSPEC (McLean et al. 1998) on the Keck II telescope, we have assembled a sample of more than 50 measurements in the -band (Erb et al. 2003, 2004). Since the majority of these objects were chosen primarily for their close proximity to a QSO sightline (see Erb et al. 2003, for a discussion), the NIRSPEC sample contains a fairly unbiased view of the range of rest-frame UV and optical properties of galaxies in the Steidel et al. (2004) survey. With this unbiased sample (with respect to photometric properties) in place as a control, we used the photometry to select galaxies for NIRSPEC rest-frame optical spectroscopic follow-up. In Figure 1, we present the distribution of magnitudes and colors for spectroscopically confirmed galaxies in the Q1623 field. As shown in the figure, 10% of the galaxies in the Q1623 field with WIRC photometry have , (and would be included in the survey (Cimatti et al. 2002), the high-redshift tail of which overlaps with the UV-selected sample here under consideration), while 8% have . In order to measure the rest-frame optical spectra of objects with bright rest-frame optical luminosities, we targeted galaxies with .
The Keck II/NIRSPEC observations were conducted during the course of a single observing run spanning 9 – 13 September 2003. We targeted a total of nine spectroscopically confirmed objects in the Q1623 field satisfying , four of which also had . All but one of these galaxies satisfy the “BX” color criteria presented in Adelberger et al. (2004), while the remaining galaxy falls in the adjacent region of color space occupied by “MD” objects (Steidel et al. 2003). The single MD object in the sample falls on the border between the two color criteria, lies at the same redshift as the other eight galaxies, and is therefore treated identically for the remainder of the analysis and interpretation. We followed the same observational procedures described in detail in Erb et al. (2003). In brief, we used the NIRSPEC6 filter, which transmits from m. Since the medium-dispersion mode in which we were observing only allows for m of coverage to fall on the NIRSPEC detector at once, we set the NIRSPEC cross-disperser angle to cover m, which encompassed and [NII] for the redshifts of all of our target galaxies. For all objects except BX344, we used a 076 42” long-slit, affording a spectral resolution of Å, whereas for BX344, we used a 056 42” long-slit, affording Å spectral resolution, as measured from the widths of skylines.111BX344 was the first near-IR-selected object targeted during the observing run, and we used it to experiment with a narrower slit setup. A narrower slit reduces the effects of bright sky lines, both due to the reduced sky flux in the lines themselves, and the reduced number of wavelengths affected by sky flux because of increased spectral resolution. However, we found that difficulties in centering the object on the narrower slit and the resulting variable flux losses outweighed the advantages of the narrower slit. Therefore, the remainder of the near-IR selected objects were observed with the 076 slit. The same method of blind-offset object acquisition was used as described in Erb et al. (2003). In most cases, the slit position angle was determined by the attempt to fit two galaxies on the slit (usually our primary near-IR-selected target and a nearby companion with or without a Keck I/LRIS-confirmed redshift), though in the case of BX513, which appeared elongated in the WIRC image, the slit position angle was chosen to lie along the major axis of the galaxy light. Targets were observed for 2, 3, or 4 900 seconds. We detected eight out of nine of our target galaxies, and the one undetected galaxy, BX341, was only observed for seconds. Conditions were photometric throughout the run with approximately 05 FWHM seeing in the NIRSPEC6 band. A summary of the observations including target coordinates, redshifts, optical and near-IR photometry, and total exposure times is given in Table 1. The two-dimensional galaxy spectral images were then reduced, extracted to one dimension along with 1- error spectra, and flux-calibrated with observations of A stars, according to the procedures outlined in detail in Erb et al. (2003).
3. Results
The one-dimensional, flux-calibrated NIRSPEC spectra are shown in Figure 2. and [NII] 6584 emission are very significantly detected in all spectra except that of BX513. The redshift of this object places the emission line directly on top of a sky OH emission feature at 2.1318 m, thus making flux measurements extremely uncertain. We therefore exclude BX513 from all subsequent analysis, leaving us with a robust sample of seven galaxies.222While [NII] is not detected in the BX513 spectrum, the limits on [NII]/ are not very restrictive, given the low S/N and sky contamination of the line. [SII] emission is also significantly detected in the spectra of MD66 and BX453, and marginally detected for BX274, BX344, BX599, and BX528. and [NII] emission line fluxes were determined by first fitting a one dimensional Gaussian profile to the higher S/N feature to obtain the redshift and FWHM (in wavelength). The redshift and FWHM were then used to constrain the fit to the [NII] emission line. This procedure is based on the assumption that the and [NII] lines have exactly the same redshift and FWHM, but that the line offers a higher S/N estimate of these parameters. Such an assumption appears to describe all of the spectra well except that of BX453, in which the [NII] line has broader wings than the line, and the fit based on the parameters underestimates the [NII] flux by %. Erb et al. (2004) find an average velocity dispersion of km s-1 for the sample of 61 UV-selected galaxies with measurements from which the current sample is drawn. Five of the seven -selected objects have km s-1, though two of them, BX453 and BX344, have velocity dispersions significantly below the Erb et al. (2004) average. We list the measured velocity dispersions, and [NII] fluxes, [NII]/ flux ratios, and random statistical uncertainties on these quantities in Table 2.

Even with relatively short exposure times, we obtained highly significant detections of emission for our target objects. The mean flux is with a standard deviation among the seven galaxies of ; the corresponding average star-formation rate is using the calibration of Kennicutt (1998). These values are almost three times larger than the average flux and star-formation rate of the sample considered in Erb et al. (2003). The average rest-frame optical continuum luminosity for these galaxies is also roughly three times brighter than that of the Erb et al. (2003) sample, so the average equivalents widths of the two samples are very similar. Even after correcting the broadband magnitudes for the contribution from emission lines, five of seven galaxies in our sample would still have been selected as , whereas the remaining two galaxies, BX344 and MD66, would have almost made the cut, with and , respectively. In other words, for five of the seven galaxies in the sample presented here, the emission line contributes less than 0.15 of the flux in the -band. For the remaining two galaxies, the line contributes between 0.15 and 0.20 of the -band flux.
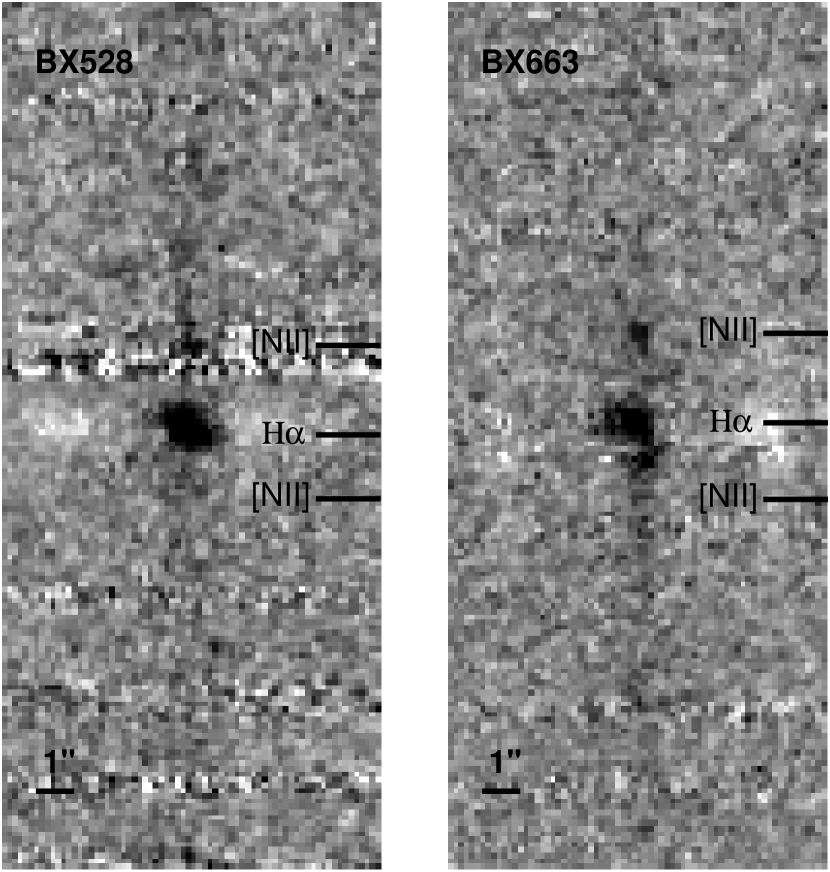
Most of the galaxies have spatially unresolved profiles, with the exception of BX528 and BX663. As shown in Figure 3, BX528 has a spatially resolved and tilted line, even though the slit position angle was not selected to lie along any morphologically-preferred axis. The extent of the velocity shear in BX528 is km s-1. BX663 has a double-peaked emission line, with a velocity separation of km s-1 between the two peaks. The higher-redshift component is times more luminous than the lower-redshift component and fairly extended, with detected flux extending along the slit. While there is a tentative detection of [NII] for the fainter, lower-redshift component, we only list the [NII]/ ratio for the more-significantly detected, higher-redshift component. The flux for BX663 listed in Table 2 represents the sum of the two components.
The most striking result, shown in Figure 2 and Table 2, is the high [NII]/ ratios measured for the -selected galaxies. The average ratio is , and the measured values range from . It is relevant to consider the lowest [NII]/ ratio that could have been measured, given an S/N. In the sample of Erb et al. (2003), while [NII] is detected for only one object (Q1700-BX691, which has an above-average flux), the [NII] non-detections for the remainder of the sample are not very restrictive on the value of [NII]/. Since the emission lines in the Erb et al. (2003) sample are typically detected with a significance of times the random noise, [NII] will only be significantly detected if it attains the strength of . To estimate the typical [NII]/ for the galaxies in Erb et al. (2003), we constructed an average composite spectrum from the individual NIRSPEC spectra, and found . In the -selected sample, the higher significance of the detections allows for a more sensitive probe of individual galaxies’ [NII]/ ratios. We could have detected for BX453, MD66, and BX599, and for BX274, BX344, and BX663. BX528 is the only galaxy whose [NII]/ ratio of is at the limit of what we could have detected.
| Galaxy | aaVacuum heliocentric redshift of H emission. | bb velocity dispersion obtained by fitting a Gaussian profile to the line and deconvolving the effects of instrumental resolution. | cc Line flux and random error in units of . While the systematic flux uncertainties are %, the uncertainty in the [NII]/ flux-ratio is determined by the random errors in both line fluxes. | cc Line flux and random error in units of . While the systematic flux uncertainties are %, the uncertainty in the [NII]/ flux-ratio is determined by the random errors in both line fluxes. | ddOxygen abundance deduced from the relationship presented in Pettini & Pagel (2004). For comparison, the most recent estimate of the solar abundance is , and that of the Orion nebula is (Allende Prieto et al. 2002; Asplund et al. 2004; Esteban et al. 1998). | eeOxygen abundance deduced from the relationship presented in Denicoló et al. (2002). | |
|---|---|---|---|---|---|---|---|
| ( km s-1) | (Pettini & Pagel) | (Denicoló) | |||||
| Q1623-BX274 | 2.4100 | ||||||
| Q1623-MD66 | 2.1075 | ||||||
| Q1623-BX344 | 2.4224 | ||||||
| Q1623-BX453ffThe and [NII] line fluxes presented are integrals under Gaussian fits to the lines, whose central wavelengths and FWHM are determined by the parameters of the line. For all objects except BX453, the fluxes obtained from the fits to the lines agree with the non-parametric integrals under the spectra, well within the uncertainties. However, in the case of BX453, the [NII] flux obtained from the fit is 30% lower than that obtained by integrating non-parametrically under the spectrum, due to the larger apparent FWHM of the [NII] line than the line. | 2.1816 | ||||||
| Q1623-BX513 | 2.2473 | ggThe emission from BX513 falls directly on top of a skyline, preventing a measurement of . | |||||
| Q1623-BX528 | 2.2682 | ||||||
| Q1623-BX599 | 2.3304 | ||||||
| Q1623-BX663 | 2.4333 | hhThe line flux listed for BX663 represents the sum of the two components integrated over the entire extended region of emission. The [NII] line flux and [NII]/ ratio correspond to the more-significantly detected, higher-redshift component, and only include flux from the spatial extent common to both transitions. | hhThe line flux listed for BX663 represents the sum of the two components integrated over the entire extended region of emission. The [NII] line flux and [NII]/ ratio correspond to the more-significantly detected, higher-redshift component, and only include flux from the spatial extent common to both transitions. | hhThe line flux listed for BX663 represents the sum of the two components integrated over the entire extended region of emission. The [NII] line flux and [NII]/ ratio correspond to the more-significantly detected, higher-redshift component, and only include flux from the spatial extent common to both transitions. |
4. The Oxygen Abundance
The most robust measurements of chemical abundances from nebular emission lines are derived from the temperature-sensitive ratio of an upper- and intermediate-level transition from the same ion. The ratio of transitions such as [OIII] to [OIII] , indicates the nebular electron temperature (), and, along with the electron density, yields a direct estimate of the chemical abundance. Unfortunately, the relatively weak [OIII] line is only observed in the hottest, most metal-poor H II regions, and is not detected in more metal-rich environments. To address this issue, H II region photoionization models that predict the relative strengths of , , and strong forbidden lines of [OII], [OIII], [NII], [SII], and [SIII], have been calibrated against H II regions with direct abundance estimates (Pagel et al. 1979; Evans & Dopita 1985; Kewley & Dopita 2002). With these empirically calibrated models, it is possible to infer approximate chemical abundances over a wide range of metallicity, using only the ratios of strong, easily detectable H II region emission lines.
The most commonly-used strong-line abundance indicator is the “ method, which relates the nebular oxygen abundance to the ratio of ([OII] + [OIII])/ (Pagel et al. 1979). The method has been employed to determine the metallicities of individual H II regions in the local universe, and the average metallicities of entire star-forming galaxies in the distant universe (Pettini et al. 2001; Lilly et al. 2003). The double-valued nature of the calibration limits its utility unless an independent line-ratio can be used to determine whether a galaxy is on the upper, metal-rich branch or the lower, metal-poor branch. Furthermore, in objects for which [OIII] or other temperature-sensitive auroral lines are detected, metallicities inferred from are systematically higher by dex than those computed directly from the method (Kennicutt et al. 2003).
As presented in section 3, we have measured [NII]/ from the sample of UV-selected star-forming galaxies. This line ratio can also be used to infer approximate chemical abundances. Unlike , the [NII]/ ratio increases monotonically with increasing metallicity (at least up to solar metallicity). Another benefit of the [NII]/ ratio is the small difference in wavelength between the two features, which reduces the importance of accurate flux-calibration and dust extinction correction. The utility of the “” index has recently been revisited empirically by Pettini & Pagel (2004), building on work by Denicoló et al. (2002). Kewley & Dopita (2002) demonstrate theoretically how depends on metallicity using detailed photoionization modeling. The metallicity dependence stems from several effects. As the metallicity increases, the ionizing stellar spectrum softens, and the overall ionization decreases, as demonstrated by the increasing ratio of [OII]/[OIII]. As the ratio of [OII]/[OIII] increases, so does the ratio of [NII]/[NIII]. Furthermore, at (O/H) metallicities above , the ratio of N/O increases due to the secondary nature of Nitrogen in this regime (Henry et al. 2000). Limitations of the method include the fact that is sensitive to the value of the ionization parameter as well as to metallicity. Also, the N/O ratio can vary as a function age or star-formation history (not simply abundance). Finally, Kewley & Dopita (2002) show with detailed photoionization models that while is a monotonically increasing function of metallicity at less than or equal to solar (O/H), it saturates at solar metallicity and even turns over towards lower values (at ).
Despite these limitations, the indicator offers us rough estimates of the H II region abundances, especially using the latest empirical calibration of Pettini & Pagel (2004). This calibration only includes (O/H) determinations from the direct method or detailed photoionization modeling. The linear relationship between and thus derived is:
| (1) |
For any individual measurement, equation 1 should yield the correct (O/H) abundance to within dex (68% confidence). Using this relationship, and assuming its validity for interpreting the integrated spectra of high-redshift star-forming galaxies, we determine (O/H) abundances for the sample of galaxies with NIRSPEC [NII]/ measurements. The (O/H) abundances and associated uncertainties are listed in Table 2. For comparison with other recent work, we also list the (O/H) abundances implied by the relation presented in Denicoló et al. (2002)
| (2) |
which are systematically higher than those computed from the Pettini & Pagel (2004) relation. In the remaining discussion, however, we emphasize the results from the Pettini & Pagel (2004) calibration, since it is based on a more homogeneous sample of (O/H) abundances.
All of the galaxies for which we detected [NII] have (O/H) abundances consistent with the most recent estimates of the solar abundance, , and that of the Orion nebula, (Allende Prieto et al. 2002; Asplund et al. 2004; Esteban et al. 1998). Furthermore, [NII]/ saturates at and even turns over towards lower values as the increased cooling at the highest metallicities lowers the H II region to the point that the collisionally-excited [NII] emission is reduced (Kewley & Dopita 2002). Since equation 1 is a linear fit, which does not take this turn-over into account, the highest [NII]/ measurements in the current sample – those of BX599, BX453, BX344, and BX663 – could very well correspond to super-solar metallicity values. To address this uncertainty, Pettini & Pagel (2004) propose the use of the “” indicator, which consists of the ratio of two line ratios: ([O III] )/([N II] ). While [NII]/ saturates at high metallicity, [OIII]/ continues to decrease such that also continues to decrease. The monotonically decreasing behavior of with increasing metallicity has been calibrated from , and exhibits significantly less scatter than the corresponding relation using alone. A clear next step is to obtain -band [OIII]/ spectra for the galaxies in this sample.
In the preceding discussion, we have interpreted the [NII]/ ratios in terms of the H II region oxygen abundances that they imply. This interpretation rests on the assumption that the observed emission lines originate in H II regions excited by the photoionizing radiation from massive O and B stars. The contribution from diffuse ionized gas (DIG) to the integrated emission-line spectra of local star-forming galaxies gas can enhance the [NII]/ ratio by different amounts ranging from less than 0.1 dex to as much as a factor of two, relative to what is measured in individual H II regions (Lehnert & Heckman 1994). The DIG component could potentially bias our interpretation of [NII]/ ratios towards higher metallicities. Currently, we have no constraints on the contribution of DIG to the spectra presented here, which would require spatially-resolved narrow-band imaging of the cosmologically-distant galaxies in our sample.
Other possible excitation mechanisms include photoionization by an AGN power-law continuum, or shock-heating, as seen in low-ionization nuclear emission regions (LINERS) and supernova remnants. In the future, combining [NII]/ with measurements of [OIII]/ will clearly discriminate among the different excitation mechanisms for these galaxies. For now, there is no evidence pointing to an AGN as the source of excitation. In addition to the NIRSPEC rest-frame optical spectra, we have also analyzed the Keck I/LRIS rest-frame UV spectra of these galaxies. An AGN manifests itself in the rest-frame UV with strong Ly emission, and high-ionization emission lines including Si IV, Ci IV, and N V (Steidel et al. 2002). Only one of the seven objects in the selected sample, BX663, displays strong Ly emission in its rest-frame UV spectrum, but no other emission lines are detected. In the remainder of the sample, Ly is detected in either strong absorption or with an equivalent width of Å, and none of these rest-frame UV spectra show evidence for high-ionization emission lines.
A consistency check on the possible AGN contribution is provided by the NIRSPEC spectra. Different types of extragalactic emission-line regions can be separated according to the relative values of their emission-line strengths. For example, Baldwin et al. (1981) and Veilleux & Osterbrock (1987) show that AGN and LINERS tend to have higher [NII]/ ratios (i.e. on the order [NII]/) than star-forming galaxies, and that AGN have higher [OIII]/ ratios than star-forming galaxies for a given [NII]/ ratio. While we currently do not have -band [OIII]/ spectra for the sample, another way in which AGN and star-forming galaxies can be distinguished is according to the [OI] 6300/ ratio. AGN and shock-heated regions have [OI] 6300/, whereas star-forming galaxies have [OI] 6300/ ratios of . Since the detection of [OI] at less than 0.10 times the strength of pushes the limit of what can be achieved with the individual galaxy spectra, we construct higher-S/N composite NIRSPEC spectra of the entire sample of seven galaxies, and the subset of four of these with the highest [NII]/ ratios. [OI] 6300 is not detected in either case, yielding a limit of [OI] 6300/. The lack of significant [OI] 6300 emission in the composite NIRSPEC spectra lends further support to the interpretation of the emission line strengths in the context of stellar H II regions.
5. Discussion
5.1. The Metallicity-Luminosity Relation
We have presented the rest-frame optical spectra of a sample of UV-selected star-forming galaxies that are also bright in the rest-frame optical. The [NII]/ line ratios of the majority of these galaxies indicate that they have already been enriched to at least solar oxygen abundance at a lookback time of Gyr. It is worthwhile to consider their metallicities and luminosities along with those of local star-forming and elliptical galaxies. Over a factor of 100 in (O/H) abundance and 11 magnitudes in blue luminosity, nearby star-forming spiral and irregular galaxies exhibit a strong trend of higher metallicity with increasing luminosity (Garnett 2002). Elliptical galaxies show a similar correlation between metallicity and luminosity, although their metallicities are measured from absorption indices in late-type stars rather than H II emission line strengths (Brodie & Huchra 1991). This correlation can be explained if less luminous (and less massive) galaxies have larger gas fractions, either because they have lower star-formation rates per unit mass than more massive galaxies, or because they are younger. Another way of explaining the correlation is through galactic-scale outflows, which could remove a larger fraction of gas and metals from less massive galaxies, which have shallower gravitational potentials, thereby reducing the effective heavy element yield (Garnett 2002).
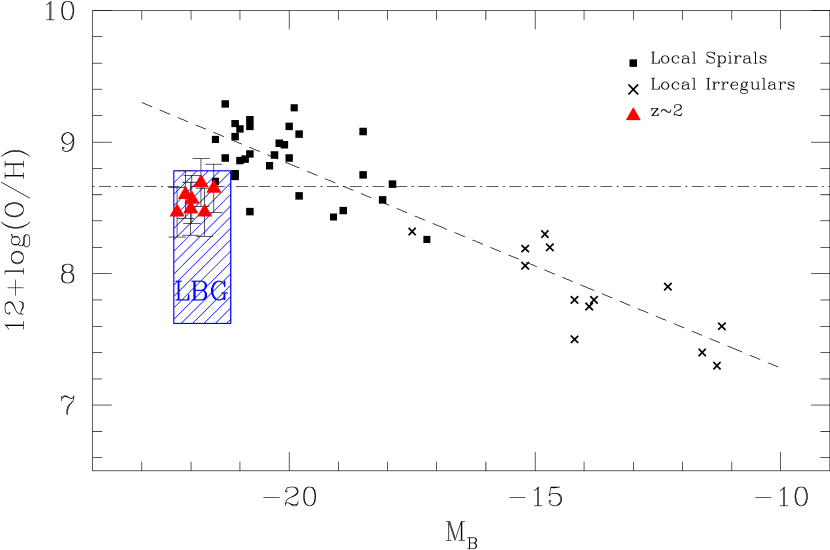
Both Kobulnicky & Koo (2000) and Pettini et al. (2001) have shown that Lyman Break Galaxies (LBGs) are magnitudes overluminous for their metallicities, when compared with the local metallicity-luminosity relation. Despite large uncertainties in LBG metallicities, the upper bound of the abundances allowed by the observed LBG values still falls a factor of three in metallicity below the local metallicity–luminosity relationship. In Figure 4 we plot the local metallicity– relationship (with data compiled by Garnett (2002)) along with the shaded region allowed for LBGs. In this figure, we also include the luminosity and metallicity measurements for the rest-frame optically luminous star-forming galaxies presented here. For both the LBGs and galaxies, was calculated using best-fit model spectral energy distributions (see section 5.2) to interpolate the observed broadband colors to rest-frame .
While the specific (O/H) values and errors implied by the linear Pettini & Pagel (2004) relationship place the galaxies below the metallicity-luminosity relationship for local galaxies, it must also be borne in mind that our estimates of (O/H) represent lower limits because of the relative insensitivity of the index when (O/H) is higher than solar. Furthermore, since (O/H) abundances in this plot are derived with the method for the and galaxies and with the method for the galaxies, it is important to acknowledge possible systematic differences between the two methods. As mentioned above, these systematic differences are definitely relevant in the super-solar metallicity regime where [NII]/ is no longer sensitive to increasing (O/H) abundance. The oxygen abundance derived from [NII]/ may also be dex lower than the abundance derived from at lower metallicities, where [NII]/ is sensitive to metallicity (van Zee et al. 1998). To estimate (O/H) from the [NII] ratios in a manner more consistent with the abundance determinations for local H II regions, we examined the emission line data for a set of H II regions located in eight galaxies in the Garnett (2002) sample. Uniformly measured and values for these H II regions are contained in van Zee et al. (1998). The galaxies in our sample have [NII]/ ratios that span from to . H II regions in the van Zee et al. (1998) sample with [NII]/ in this range are found to have , using the upper-branch calibration of Zaritsky et al. (1994), which corresponds to . While the calibration is in itself untested at these very high values of metallicity and may well suffer from its own systematic uncertainties, it seems very likely that the star-forming galaxies we have observed in this work are enriched to levels comparable to those of the most metal-rich and massive spiral and elliptical galaxies in the local universe.
Whether solar or super-solar, the metallicities of these galaxies are likely to grow further from to the present time, since we observe them while they are still in the process of actively forming stars at rates of . In one possible scenario, proposed by Maier et al. (2004) to explain the range of (O/H) and measurements of star-forming galaxies at , , and , the rest-frame optically bright galaxies in our sample will evolve both in metallicity and luminosity by ; their oxygen abundances will increase by a factor of two, and their luminosities will fade by magnitudes. Unfortunately, at this point, we cannot precisely determine the amount of future star-formation and enrichment in these galaxies (and therefore tracks in metallicity-luminosity space as a function of redshift) since we have no information about their molecular gas content or future episodes of gas accretion and infall.
In any case, it is important to obtain deeper [NII] and measurements of star-forming galaxies in order to determine the metallicity-luminosity relationship over a larger range of rest-frame optical luminosities and relate star-forming galaxies to those at lower redshift. As a first step, we compare galaxies in the current sample with those presented in Erb et al. (2003), in terms of their rest-frame optical luminosities (corrected for emission) and [NII]/ ratios. The current sample of galaxies is characterized by and , corresponding to . Of the 17 galaxies with emission-line flux measurements in Erb et al. (2003), 14 also have measured magnitudes, from which rest-frame optical luminosities can be calculated. The Erb et al. (2003) galaxies with measurements are fainter on average than the sample, with . It was not possible to estimate [NII]/ on an individual basis for most of the Erb et al. (2003) galaxies, since [NII] is not significantly detected in the majority of the spectra. To determine the average [NII]/, we constructed a composite NIRSPEC spectrum from the 14 galaxies with measurements. In this spectrum, we found [NII]/=0.10, corresponding to . Therefore, the galaxies from Erb et al. (2003) are mag fainter in the rest-frame optical and dex lower in than the current sample. This trend marks the preliminary establishment of a metallicity–luminosity relationship at .
5.2. The Masses of Metal-Rich Star-forming Galaxies
| Uncorrected | Uncorrected | Model | ||||||
|---|---|---|---|---|---|---|---|---|
| SFRccSFR calculated from , using the conversion of Kennicutt (1998). | SFRUVddSFR calculated from , probed by the apparent magnitude and using the conversion of Kennicutt (1998). | SFReeSFR calculated by fitting a Bruzual & Charlot (2003) Gyr model reddened by dust extinction to the colors of the galaxies. The best-fit value of allows for the calculation of the dust-corrected value of the star-formation rate, listed here. | AgeggThe best-fit value of stellar population age associated with the current episode of star formation, assuming an exponentially declining star-formation history with Gyr. | hhFormed stellar mass computed by integrating the best-fit exponentially-declining SFR between and the best-fit age. | ||||
| Galaxy | aaVacuum heliocentric redshift of H emission. | bb luminosity in units of . | ffThe best-fit value of , assuming a Calzetti et al. (2000) dust-attenuation law as a function of wavelength. | (Gyr) | ||||
| Q1623-BX274 | 2.4100 | 4.3 | 34 | 28 | 75 | 0.12 | 1.3 | 1.9 |
| Q1623-MD66 | 2.1075 | 6.5 | 51 | 10 | 65 | 0.23 | 0.9 | 0.9 |
| Q1623-BX344 | 2.4224 | 7.9 | 62 | 8 | 49 | 0.20 | 1.6 | 1.9 |
| Q1623-BX453 | 2.1816 | 4.9 | 39 | 16 | 174 | 0.27 | 0.4 | 0.9 |
| Q1623-BX528 | 2.2682 | 3.0 | 24 | 18 | 44 | 0.11 | 1.7 | 1.9 |
| Q1623-BX599 | 2.3304 | 7.6 | 60 | 22 | 49 | 0.10 | 1.3 | 1.3 |
| Q1623-BX663 | 2.4333 | 7.8 | 62 | 12 | 33 | 0.13 | 2.0 | 2.3 |
The high H II region metallicities of the -bright star-forming galaxies suggest mature systems that have processed a significant fraction of their baryonic material into stars. Modeling the broad-band optical and near-infrared spectral energy distributions of these galaxies with population synthesis codes provides an independent test of this hypothesis. Following a similar procedure to that of Shapley et al. (2001), we use Bruzual & Charlot (2003) models with solar-metallicity and a Salpeter initial mass function (IMF) to deduce stellar masses and ages. Dust extinction is taken into account with a Calzetti et al. (2000) starburst attenuation law.333Reddy & Steidel (2004) have shown that using the Calzetti law to infer unobscured star-formation rates from UV colors and magnitudes accurately predicts the average X-ray and radio continuum fluxes of star-forming galaxies. In order to determine how well the stellar masses and ages can be constrained, we investigated a range of star-formation histories of the form , with e-folding times of Gyr, as well as continuous star-formation models. Before modeling the colors, we corrected the magnitudes for the effects of and [NII] nebular emission.444For a full description of the modeling procedure, see Shapley et al. (2001).
Five of the seven galaxies show evidence of having sustained active star formation over long timescales, are not well described by steeply declining star-formation histories, and appear to have formed at least of stars. Only Myr models provide acceptable fits to their SEDs, yielding ages that are significant fractions of the Hubble time at . In fact, while constant-star-formation models provide statistically excellent fits to the photometry for these five galaxies, the associated best-fit ages are older than the ages of the Universe at each galaxy’s redshift. To avoid this contradiction, we only consider models which yield best-fit ages causally allowed by the finite age of the universe. The Myr models yield stellar masses of and ages of Gyr, whereas the maximally-allowed models for each object yield masses of and ages of Gyr. Both ground-based and -band, and Spitzer rest-frame near-infrared photometry will help to discriminate between and Gyr models. The colors of the remaining two galaxies, BX453 and MD66, provide very little restriction on star-formation history. Both of these galaxies can be fit by steeply-declining or constant star-formation models. The best-fit masses for BX453 range from with associated ages ranging from Gyr, whereas the masses for MD66 range from and ages from Gyr. While less massive than the majority of the sample, BX453 and MD66 have already formed a significant fraction of the stellar mass of an galaxy in the local universe (Cole et al. 2001).
For all seven galaxies, the uncertainties in star-formation history lead to systematic uncertainties in the stellar mass of a factor of . Furthermore, if there is an underlying maximally-old population, hidden at rest-frame UV-to-optical wavelengths by the current episode of star formation, the stellar masses derived here could underestimate the total stellar mass by up to a factor of five (Papovich et al. 2001). Both the inferred dust extinction, , and dust-corrected star-formation rate depend systematically on the assumed star-formation histories; specifically, the best-fit models are characterized by more dust-extinction and higher bolometric star-formation rates when we assume larger values. Assuming the maximally-allowed for each galaxy yields for the sample, and . In Table 3, we list the best-fit stellar-population parameters, assuming Gyr, which provides causally allowed ages for all galaxies in the sample. Figure 5 shows plots of the best-fit Gyr models. While these objects were selected to be at because they display the colors of star-forming galaxies, it is clear that they are not only metal-rich, but also have large stellar masses.

The star-forming galaxies in the sample of Steidel et al. (2004) were selected to have intrinsic rest-frame UV colors very similar to those of star-forming LBGs at . In relating the two samples of galaxies, it is important to consider if plausible progenitors of the massive, metal-rich “BX” galaxies can be found among the sample of LBGs with near-IR photometry, whose stellar populations were modeled by Shapley et al. (2001). To address this question, we re-model the Shapley et al. (2001) sample, using the most current release of the Bruzual & Charlot population synthesis codes (Bruzual & Charlot 2003). For a consistent comparison with the best-fit values presented in Table 3 we assume exponentially declining star-formation histories, with Gyr. Evolving all the best-fit models forward in time, we compute the star-formation rates and stellar masses formed by . Assuming that does not change between and , we also compute the predicted and magnitudes, and , colors. The predicted UV colors can be used to determine if a galaxy would be recovered by the UV criteria of Adelberger et al. (2004), and the predicted near-IR magnitudes indicate whether or not a galaxy would be included in the rest-frame optically bright sample presented here, with . At least 15% of the LBGs fit by Shapley et al. (2001) have stellar population models time-evolved to with stellar masses, star-formation rates, and age within the range of properties of the BX galaxies presented here. The time-evolved colors of these LBGs satisfy the UV criteria of Adelberger et al. (2004), and they also have . Therefore, at least 15% of the LBGs modeled by Shapley et al. (2001) constitute plausible progenitors for the -bright BX objects. As shown below, the -bright BX’s have a comoving number density that’s only 14% as high as that of LBGs in the Shapley et al. (2001) sample, so we conclude that most of them could have been LBGs in the past.
It is now possible to estimate the stellar mass density associated with UV-selected objects. First we estimate the average mass of the 7 objects with [NII]/ measurements. Taking into account the systematic uncertainties due to the range of allowed star-formation histories, we find . This average mass should be representative of the entire sample of galaxies since the distributions of and colors of the seven galaxies with mass estimates are similar to those of the entire sample of rest-frame optically luminous objects.
| Magnitude Range | Fraction of BX objects with aaThese statistics are based on the entire sample of 956 spectroscopically identified BX objects. | Q1623 BX objects with and no z |
|---|---|---|
| bbWe use as a cut-off since all spectroscopically-confirmed BX objects at brighter magnitudes are stars and QSOs. | 0/48 | 39 |
| 6/51 | 13 | |
| 145/301 | 7 | |
| 386/556 | 8 |
Next we estimate the comoving space density of UV-selected galaxies. In the Q1623 WIRC pointing, which covers , there are 87 “BX” objects with , including 13 galaxies with confirmed redshifts between , one broad-lined QSO at , four stars, and two low-redshift galaxies at . The remaining 67 photometric candidates have either not been attempted spectroscopically or have been attempted unsuccessfully, with undetermined redshifts. To estimate the number of galaxies without spectroscopic redshifts that are likely to fall in the redshift range of interest, we use the redshift statistics as a function of magnitude from our total sample of 956 BX objects with spectroscopic information (Steidel et al. 2004). Based on the BX high-redshift fractions and the distribution of magnitudes for the 67 sources without redshifts presented in Table 4 (i.e. multiplying the second column of Table 4 by the third column), we estimate that an additional 11 galaxies without measured redshifts are likely to be at . The total number of BXs at is therefore . Weighted by the BX redshift selection function (Steidel et al. 2004; Adelberger et al. 2004), the comoving volume between is . Over the entire Q1623 WIRC pointing, the space-density of UV-selected objects with is therefore . The space density of massive galaxies is of course prone to large sample variance because such objects are expected to be strongly clustered. While not yet properly quantified, initial statistics from our two other fields with -band data suggest variations of a factor of from field to field.
Multiplying this space density by the average mass of the rest-frame optically luminous objects we obtain , which is 4% of the stellar mass density determined by Cole et al. (2001). The objects represent only % of the sample of BX objects at , and since we expect to find massive systems down to significantly fainter magnitudes, this figure represents an extreme lower limit on the stellar mass density associated with UV-selected star-forming galaxies at . In the future, when we have the distribution of stellar masses over a much wider range in luminosity in hand, we will determine a more robust constraint on the stellar mass density at , extending the work of Dickinson et al. (2003) to a larger cosmic volume.
5.3. Comparison with Other Surveys
There are other current surveys targeting massive galaxies in the same redshift range. It is instructive to compare the properties of the UV-selected objects presented here with those of the galaxies in the K20 survey (Cimatti et al. 2002) and the Gemini Deep Deep Survey (GDDS; Abraham et al. 2004). The K20 project is a spectroscopic survey of objects, 9 of which have been spectroscopically confirmed in the redshift range . Daddi et al. (2004) demonstrate that this subsample of galaxies is characterized by dust-corrected star-formation rates of , constant star-formation ages of Gyr, and stellar masses of . Six of the galaxies in Daddi et al. (2004) are at , and four of them have optical colors that satisfy the “BX” criteria presented in Adelberger et al. (2004). These four galaxies have and constant star-formation ages of Gyr, very similar to the properties of BX453 and MD66 when constant star-formation histories are assumed. Of the three galaxies in Daddi et al. (2004) that are at , two would be recovered by the “BM” criteria of Adelberger et al. (2004), which target star-forming galaxies. Since the K20 survey uses a different optical filter set from that of the Steidel et al. (2004) survey, we calculated the colors of the Daddi et al. (2004) galaxies by passing the best-fit redshifted, dust-reddened, constant star-formation models (from their Table 1) through the filter set. There appears to be significant overlap between the UV-selected objects and the high-redshift tail of the K20 survey. Furthermore, the space density of K20 objects is , which is very comparable to the space density of UV-selected objects at in the Q1623 field, . Finally, the distribution of stellar masses of the K20 and rest-frame optically luminous UV-selected objects are very similar (with the exception of one K20 object that has and would not be selected as a BX). The additional UV-selection criteria appear to recover the majority of K20 objects, because most galaxies harbor active star formation at .
While the majority of the 300 galaxies in the GDDS survey are at , this infrared-selected survey contains a small high-redshift tail of galaxies (Glazebrook et al. 2004). Using GDDS galaxies to trace the evolution of stellar mass-density in the universe, Glazebrook et al. (2004) find a mass density for objects of . Below , the GDDS becomes incomplete for objects with the highest mass-to-light ratios. The GDDS masses and mass densities were calculated assuming an IMF that turns over below (Baldry & Glazebrook 2003; Kroupa 2001); it is therefore necessary to multiply the GDDS numbers by a factor of 1.82 for a meaningful comparison with the results presented here, derived using a Salpeter IMF. The range of masses of the spectroscopically confirmed GDDS galaxies is very similar to that of the UV-selected objects, while the mass density, computed down to a limiting magnitude of is times higher. A more fair comparison in mass densities will result when we have determined the stellar masses of fainter UV-selected objects. Nonetheless, it is still currently possible to determine how complementary the UV-selected and GDDS surveys are in the redshift range, since one of the GDDS survey areas, the SSA22 field, has also been imaged in the filter set as part of the LBG survey (Steidel et al. 2003). In the SSA22a field, there are three spectroscopically confirmed GDDS galaxies with , and four with uncertain redshifts of (Abraham et al. 2004). All three of the galaxies are recovered with the BX/BM -selection criteria, and three of the four putative objects would be selected as BXs. At , there are 12 GDDS objects in the SSA22a field, half of which would be recovered by the BX/BM UV-selection criteria. The 50% overlap between GDDS galaxies at and BX/BM objects is not especially meaningful since the BM color criteria are intended to select galaxies at , and the BX color criteria target galaxies at –i.e. lies at the edge of the BX/BM selection function, where the selection efficiency drops off. However, the large overlap of the GDDS and BX/BM surveys at is again consistent with the idea that even -band selected surveys that are supposed to be “mass-selected” include a significant fraction of star-forming galaxies at .
| aa velocity dispersion. | bbMass calculated from the H velocity dispersion. | ccMinimum time-constant of models of the form that provide statistically acceptable fits to the galaxy colors. | ddMass of best-fit model, assuming . Values not in parentheses assume a Salpeter IMF extending down to . Values in parentheses assume the more realistic Baldry & Glazebrook (2003) IMF, which has a break at . | eeMaximum time-constant of models for which the best-fit age is younger than the age of the universe. BX453 and MD66 can be fit by , i.e. constant star-formation models, while the remaining galaxies’ best-fit ages exceed that of the universe when . | ffMass of best-fit model, assuming . Values with and without parentheses have the same meaning as defined in note (d). | |
|---|---|---|---|---|---|---|
| Galaxy | ( km s-1) | (Gyr) | (Gyr) | |||
| Q1623-BX274 | 121 | 0.28 | 0.20 | 1.27 (0.70) | 5.00 | 2.76 (1.52) |
| Q1623-MD66 | 120 | 0.28 | 0.05 | 0.49 (0.27) | 1.19 (0.65) | |
| Q1623-BX344 | 92 | 0.16 | 0.20 | 1.06 (0.58) | 2.00 | 2.18 (1.20) |
| Q1623-BX453 | 61 | 0.07 | 0.01 | 0.49 (0.27) | 0.92 (0.51) | |
| Q1623-BX528 | 142 | 0.58 | 0.20 | 1.09 (0.60) | 2.00 | 2.47 (1.36) |
| Q1623-BX599 | 162 | 0.50 | 0.20 | 0.83 (0.46) | 5.00 | 1.69 (0.93) |
| Q1623-BX663 | 132 | 0.45 | 0.20 | 1.06 (0.58) | 1.00 | 2.35 (1.29) |
5.4. Stellar vs. Dynamical Masses
The preceding discussion relies on population synthesis models of the galaxy colors to infer stellar masses and therefore the comoving stellar mass density in large galaxies at . Rest-frame optical spectroscopy allows for a completely independent probe of galaxy mass: the velocity dispersion. A physical scale-length and assumption of the geometric configuration are necessary to convert the velocity dispersion into a dynamical mass. In previous determinations of high-redshift star-forming galaxy dynamical masses (Pettini et al. 2001; Erb et al. 2003, 2004), a spherically-symmetric distribution of matter was assumed, and the physical scale-length adopted was the typical or galaxy continuum half-light radius, as determined from Hubble Space Telescope images, 02–03. From the excellent seeing conditions during our NIRSPEC exposures, we also determine half-light radii of 02-03. Using these radii, and assuming a spherical geometry, we determine dynamical masses with the formula: . Dynamical mass estimates are listed in Table 5, as well as stellar masses inferred from the smallest allowed by the galaxy photometry, and the largest allowed by the age of the universe constraint. As discussed in section 5.2, the stellar mass of the best-fit model is an increasing function of the assumed time-constant, . The actual stellar mass for each object lies somewhere between the limits listed in Table 5 (neglecting the mass of an underlying maximally-old burst).
For every galaxy, if a Salpeter IMF extending down to is assumed, the allowed range of stellar mass exceeds the calculated dynamical mass within . For BX663, MD66, BX528, and BX599, this discrepancy is roughly a factor of , whereas for BX344, BX274, and BX453, the stellar mass estimate exceeds the dynamical mass by an order of magnitude. Perhaps this discrepancy is not surprising, given that the galaxy stellar mass was determined from luminosities and colors extending over a physical region in some cases several times as large in radius as the region enclosed by the half-light radius. A larger radius may be more suitable for inferring the dynamical mass. Indeed, with the assumption of a constant ratio as a function of radius, the mass enclosed within should be multiplied by 2 in order to compare with the total stellar mass.
Furthermore, there are observational effects that may apply if the geometry is not the simple spherically-symmetric one assumed for the calculation. If the emission is extended along a specific axis, the possible misalignment of the slit with this axis must be taken into account. If the configuration of H II regions is more disk-like, then inclination effects may also cause us to underestimate the the circular velocity, and therefore, velocity dispersion. Erb et al. (2003) estimate that the combination of these two effects may result in an underestimate of a factor of in circular velocity. Of course, the numerical coefficient multiplying depends on the assumed geometry as well, and is unity for a disk geometry (as opposed to 5, assumed for the spherical configuration). Independent of slit misalignment and disk inclination effects, the emission within the half-light radius may not sample the full range of rotational velocities of the underlying disk. Using local starburst galaxies with well-determined rotation curves, Lehnert & Heckman (1996) have shown that the widths of optical emission-lines originating in the bright central regions of local starburst galaxies only sample the solid-body part of the rotation curve, and therefore do not reflect the full circular velocity attained on the flat part of the rotation curve at larger radii. Both Pettini et al. (2001) and Erb et al. (2003) have pointed out this limitation in interpreting the rest-frame optical linewidths of and galaxies in terms of masses. Finally, stellar masses were determined assuming a Salpeter IMF extending down to , though we have no observational constraints on the low-mass regime of the IMF at high redshift. An IMF which turns over below , as assumed by Glazebrook et al. (2004), would lower the stellar mass estimates by a factor of . We assumed the standard Salpeter form in section 5.2 for the purposes of comparing with earlier studies of the stellar mass content of galaxies at low and high redshift (Cole et al. 2001; Shapley et al. 2001; Papovich et al. 2001), though a more realistic form for the low-mass end of the IMF would significantly reduce the systematic discrepancy between stellar and dynamical masses (as shown by the values in parentheses in Table 5).
Most of the above systematic effects would have caused us either to underestimate the dynamical mass, or overestimate the stellar mass. There is enough uncertainty in our estimates of the low-mass end of the IMF, the appropriate radius at which to evaluate , and the geometrical configuration of H II regions, that the current discrepancy between stellar and dynamical mass estimates does not represent a crisis. However, the method of Pettini et al. (2001) and Erb et al. (2003), using simple assumptions to compute dynamical masses, clearly does not account for the amount of stellar mass derived from modeling the colors of these galaxies. We must understand the nature of these discrepancies before we can trace the evolution of mass in galaxies as a function of redshift.
6. Summary
We have presented the rest-frame optical spectra of a sample of seven UV-selected galaxies that also have . We reach the following principal conclusions:
1. The majority of these galaxies exhibit high [NII]/ ratios indicative of solar, and possibly super-solar, metallicities, at a lookback time of Gyr.
2. The calibration of Pettini & Pagel (2004), which converts [NII]/ ratios into (O/H) abundances, indicates that the galaxies in the sample are over-luminous for their metallicities relative to the local metallicity-luminosity relationship. However, we may have underestimated the (O/H) abundances due to the insensitivity of the indicator at super-solar metallicity. In any case, given the active star-formation rates inferred from luminosities and population-synthesis modeling, these objects will likely become more metal-rich at later times, and are probably the progenitors of massive spiral and elliptical galaxies in the local universe. The sample of galaxies presented in Erb et al. (2003) has an average rest-frame optical luminosity mag fainter and average [NII]/ ratio three times smaller, relative to the corresponding values for the current sample, consistent with the existence of a metallicity–luminosity relationship at .
3. Population-synthesis models of their broad-band rest-UV/optical spectral energy distributions suggest that these galaxies have been forming stars over timescales comparable to a Hubble time, contain of stars, and are still actively forming stars.
4. Comparison with surveys such as the K20 and GDDS projects indicates a significant overlap between near-infrared- and UV-selected objects. A large fraction of the most massive galaxies at are actively forming stars.
5. Dynamical mass estimates derived from velocity dispersions and galaxy half-light radii are systematically lower than stellar mass estimates deduced from the broad-band SEDs of the galaxies presented here. While several plausible effects can be invoked to explain the difference in mass estimates, this discrepancy must be understood if we are to trace the evolution of galaxy masses in the universe.
We would like to thank Naveen Reddy and Matthew Hunt for their contributions to the optical imaging and spectroscopic observations that form the backbone of our survey of star-forming galaxies. We appreciate the assistance of an anonymous referee, whose comments improved the manuscript. We also acknowledge extremely helpful conversations with Don Garnett and Lisa Kewley. We wish to extend special thanks to those of Hawaiian ancestry on whose sacred mountain we are privileged to be guests. Without their generous hospitality, most of the observations presented herein would not have been possible. Finally, we thank the staff at the W. M. Keck Observatory for their assistance with the NIRSPEC observations, especially Joel Aycock, Gary Puniwai, and Bob Goodrich. CCS and DKE have been supported by grants AST00-70773 and AST03-07263 from the U.S. National Science Foundation and by the David and Lucile Packard Foundation. AES acknowledges support from the Miller Institute for Basic Research in Science.
References
- Abraham et al. (2004) Abraham, R. G., Glazebrook, K., McCarthy, P. J., Crampton, D., Murowinski, R., Jorgensen, I., Roth, K., Hook, I. M., Savaglio, S., Chen, H.-W., & Marzke, R. 2004, ApJ, submitted (astro-ph/0402436).
- Adelberger et al. (2004) Adelberger, K. L., Steidel, C. C., Shapley, A. E., Hunt, M. P., Erb, D. K., Reddy, N. A., & Pettini, M. 2004, ApJ, accepted, (astro-ph/0401445).
- Adelberger et al. (2003) Adelberger, K. L., Steidel, C. C., Shapley, A. E., & Pettini, M. 2003, ApJ, 584, 45
- Allende Prieto et al. (2002) Allende Prieto, C., Lambert, D. L., & Asplund, M. 2002, ApJ, 573, L137
- Asplund et al. (2004) Asplund, M., Grevesse, N., Sauval, A. J., Allende Prieto, C., & Kiselman, D. 2004, A&A, 417, 751
- Baldry & Glazebrook (2003) Baldry, I. K. & Glazebrook, K. 2003, ApJ, 593, 258
- Baldwin et al. (1981) Baldwin, J. A., Phillips, M. M., & Terlevich, R. 1981, PASP, 93, 5
- Brodie & Huchra (1991) Brodie, J. P. & Huchra, J. P. 1991, ApJ, 379, 157
- Bruzual & Charlot (2003) Bruzual, G. & Charlot, S. 2003, MNRAS, 344, 1000
- Calzetti et al. (2000) Calzetti, D., Armus, L., Bohlin, R. C., Kinney, A. L., Koornneef, J., & Storchi-Bergmann, T. 2000, ApJ, 533, 682
- Chapman et al. (2003) Chapman, S. C., Blain, A. W., Ivison, R. J., & Smail, I. R. 2003, Nature, 422, 695
- Cimatti et al. (2002) Cimatti, A., Pozzetti, L., Mignoli, M., Daddi, E., Menci, N., Poli, F., Fontana, A., Renzini, A., Zamorani, G., Broadhurst, T., Cristiani, S., D’Odorico, S., Giallongo, E., & Gilmozzi, R. 2002, A&A, 391, L1
- Cole et al. (2001) Cole, S., Norberg, P., Baugh, C. M., Frenk, C. S., Bland-Hawthorn, J., Bridges, T., Cannon, R., Colless, M., Collins, C., Couch, W., Cross, N., Dalton, G., De Propris, R., Driver, S. P., Efstathiou, G., Ellis, R. S., Glazebrook, K., Jackson, C., Lahav, O., Lewis, I., Lumsden, S., Maddox, S., Madgwick, D., Peacock, J. A., Peterson, B. A., Sutherland, W., & Taylor, K. 2001, MNRAS, 326, 255
- Daddi et al. (2004) Daddi, E., Cimatti, A., Renzini, A., Vernet, J., Conselice, C., Pozzetti, L., Mignoli, M., Tozzi, P., Broadhurst, T., di Serego Alighieri, S., Fontana, A., Nonino, M., Rosati, P., & Zamorani, G. 2004, ApJ, 600, L127
- Denicoló et al. (2002) Denicoló, G., Terlevich, R., & Terlevich, E. 2002, MNRAS, 330, 69
- Dickinson et al. (2003) Dickinson, M., Papovich, C., Ferguson, H. C., & Budavári, T. 2003, ApJ, 587, 25
- Erb et al. (2003) Erb, D. K., Shapley, A. E., Steidel, C. C., Pettini, M., Adelberger, K. L., Hunt, M. P., Moorwood, A. F. M., & Cuby, J. 2003, ApJ, 591, 101
- Erb et al. (2004) Erb, D. K., Steidel, C. C., Shapley, A. E., Pettini, M., & Adelberger, K. L. 2004, ApJ, accepted (astro-ph/0404235).
- Esteban et al. (1998) Esteban, C., Peimbert, M., Torres-Peimbert, S., & Escalante, V. 1998, MNRAS, 295, 401
- Evans & Dopita (1985) Evans, I. N. & Dopita, M. A. 1985, ApJS, 58, 125
- Franx et al. (2003) Franx, M., Labbé, I., Rudnick, G., van Dokkum, P. G., Daddi, E., Förster Schreiber, N. M., Moorwood, A., Rix, H., Röttgering, H., van de Wel, A., van der Werf, P., & van Starkenburg, L. 2003, ApJ, 587, L79
- Garnett (2002) Garnett, D. R. 2002, ApJ, 581, 1019
- Garnett & Shields (1987) Garnett, D. R. & Shields, G. A. 1987, ApJ, 317, 82
- Glazebrook et al. (2004) Glazebrook, K., Abraham, R., McCarthy, P., Savaglio, S., Chen, H.-W., Crampton, D., Murowinski, R., Jorgensen, I., Roth, K., Hook, I., Marzke, R., & Carlberg, R. 2004, ApJ, submitted (astro-ph/0401037).
- Heckman et al. (2000) Heckman, T. M., Lehnert, M. D., Strickland, D. K., & Armus, L. 2000, ApJS, 129, 493
- Henry et al. (2000) Henry, R. B. C., Edmunds, M. G., & Köppen, J. 2000, ApJ, 541, 660
- Kennicutt (1998) Kennicutt, R. C. 1998, ARA&A, 36, 189
- Kennicutt et al. (2003) Kennicutt, R. C., Bresolin, F., & Garnett, D. R. 2003, ApJ, 591, 801
- Kewley & Dopita (2002) Kewley, L. J. & Dopita, M. A. 2002, ApJS, 142, 35
- Kobulnicky & Koo (2000) Kobulnicky, H. A. & Koo, D. C. 2000, ApJ, 545, 712
- Kobulnicky et al. (2003) Kobulnicky, H. A., Willmer, C. N. A., Phillips, A. C., Koo, D. C., Faber, S. M., Weiner, B. J., Sarajedini, V. L., Simard, L., & Vogt, N. P. 2003, ApJ, 599, 1006
- Kroupa (2001) Kroupa, P. 2001, MNRAS, 322, 231
- Lamareille et al. (2004) Lamareille, F., Mouhcine, M., Contini, T., Lewis, I., & Maddox, S. 2004, MNRAS, accepted (astro-ph/0401615).
- Lehnert & Heckman (1994) Lehnert, M. D. & Heckman, T. M. 1994, ApJ, 426, L27
- Lehnert & Heckman (1996) Lehnert, M. D. & Heckman, T. M. 1996, ApJ, 472, 546
- Lilly et al. (2003) Lilly, S. J., Carollo, C. M., & Stockton, A. N. 2003, ApJ, 597, 730
- Maier et al. (2004) Maier, C., Meisenheimer, K., & Hippelein, H. 2004, A&A, 418, 475
- McLean et al. (1998) McLean, I. S., Becklin, E. E., Bendiksen, O., Brims, G., Canfield, J., Figer, D. F., Graham, J. R., Hare, J., Lacayanga, F., Larkin, J. E., Larson, S. B., Levenson, N., Magnone, N., Teplitz, H., & Wong, W. 1998, in Proc. SPIE Vol. 3354, p. 566-578, Infrared Astronomical Instrumentation, Albert M. Fowler; Ed., Vol. 3354, 566–578
- Oke et al. (1995) Oke, J. B., Cohen, J. G., Carr, M., Cromer, J., Dingizian, A., Harris, F. H., Labrecque, S., Lucinio, R., Schaal, W., Epps, H., & Miller, J. 1995, PASP, 107, 375
- Pagel et al. (1979) Pagel, B. E. J., Edmunds, M. G., Blackwell, D. E., Chun, M. S., & Smith, G. 1979, MNRAS, 189, 95
- Papovich et al. (2001) Papovich, C., Dickinson, M., & Ferguson, H. C. 2001, ApJ, 559, 620
- Pettini & Pagel (2004) Pettini, M. & Pagel, B. E. J. 2004, MNRAS, 348, L59
- Pettini et al. (2001) Pettini, M., Shapley, A. E., Steidel, C. C., Cuby, J., Dickinson, M., Moorwood, A. F. M., Adelberger, K. L., & Giavalisco, M. 2001, ApJ, 554, 981
- Pettini et al. (1997) Pettini, M., Smith, L. J., King, D. L., & Hunstead, R. W. 1997, ApJ, 486, 665
- Prochaska & Wolfe (2002) Prochaska, J. X. & Wolfe, A. M. 2002, ApJ, 566, 68
- Reddy & Steidel (2004) Reddy, N. A. & Steidel, C. C. 2004, ApJ, 603, L13
- Shapley et al. (2001) Shapley, A. E., Steidel, C. C., Adelberger, K. L., Dickinson, M., Giavalisco, M., & Pettini, M. 2001, ApJ, 562, 95
- Steidel et al. (2003) Steidel, C. C., Adelberger, K. L., Shapley, A. E., Pettini, M., Dickinson, M., & Giavalisco, M. 2003, ApJ, 592, 728
- Steidel et al. (2002) Steidel, C. C., Hunt, M. P., Shapley, A. E., Adelberger, K. L., Pettini, M., Dickinson, M., & Giavalisco, M. 2002, ApJ, 576, 653
- Steidel et al. (2004) Steidel, C. C., Shapley, A. E., Pettini, M., Adelberger, K. L., Erb, D. K., Reddy, N. A., & Hunt, M. P. 2004, ApJ, 604, 534
- Tremonti et al. (2004) Tremonti, C., Heckman, T., Kauffmann, G., Brinchmann, J., Charlot, S., White, S., Seibert, M., Peng, E., Schlegel, D., Uomoto, A., Fukugita, M., & Brinkmann, J. 2004, ApJ, submitted.
- van Zee et al. (1998) van Zee, L., Salzer, J. J., Haynes, M. P., O’Donoghue, A. A., & Balonek, T. J. 1998, AJ, 116, 2805
- Veilleux & Osterbrock (1987) Veilleux, S. & Osterbrock, D. E. 1987, ApJS, 63, 295
- Zaritsky et al. (1994) Zaritsky, D., Kennicutt, R. C., & Huchra, J. P. 1994, ApJ, 420, 87