Bipolar outflow on the Asymptotic Giant Branch—the case of IRC+10011
Abstract
Near-IR imaging of the AGB star IRC+10011 (= CIT3) reveals the presence of a bipolar structure within the central 0.1 arcsec of a spherical dusty wind. We show that the image asymmetries originate from M⊙ of swept-up wind material in an elongated cocoon whose expansion is driven by bipolar jets. We perform detailed 2D radiative transfer calculations with the cocoon modeled as two cones extending to 1,100 AU within an opening angle of 30∘, imbedded in a wind with the standard density profile. The cocoon expansion started 200 years ago, while the total lifetime of the circumstellar shell is 5,500 years. Similar bipolar expansion, at various stages of evolution, has been recently observed in a number of other AGB stars, culminating in jet breakout from the confining spherical wind. The bipolar outflow is triggered at a late stage in the evolution of AGB winds, and IRC+10011 provides its earliest example thus far. These new developments enable us to identify the first instance of symmetry breaking in the evolution from AGB to planetary nebula.
keywords:
circumstellar matter — dust — infrared: stars — radiative transfer — stars: imaging — stars: individual: IRC+10011 — stars: AGB and post-AGB1 Introduction
The transition from spherically symmetric Asymptotic Giant Branch (AGB) winds to non-spherical Planetary Nebulae (PNe) represents one of the most intriguing problems of stellar astrophysics. While most PNe show distinct deviations from spherical symmetry, their progenitors, the AGB stars, are conspicuous for the sphericity of their winds (see, e.g., review by Balick & Frank 2002). There have been suggestions, though, that deviations from sphericity may exist in some AGB winds, and perhaps could be even prevalent (Plez & Lambert 1994, Kahane at al. 1997). Thanks to progress in high resolution imaging, evidence of asymmetry has become more conclusive for several objects in recent years (V Hya: Plez & Lambert 1994, Sahai et al. 2003a; X Her: Kahane & Jura 1996; IRC+10216: Weigelt et al. 1998 & 2002, Haniff & Buscher 1998, Skinner et al. 1998, Osterbart et al. 2000; RV Boo: Bergman et al. 2000, Biller et al. 2003; CIT6: Schmidt et al. 2002).
The star IRC+10011 (= IRAS 01037+1219, also known as CIT3 and WXPsc), an oxygen-rich long-period variable with a mean infrared variability period of 660 days (Le Bertre 1993), is one of the most extreme infrared AGB objects. This source served as the prototype for the first detailed models of AGB winds by Goldreich & Scoville (1976) and of the OH maser emission from OH/IR stars by Elitzur, Goldreich, & Scoville (1976). The optically thick dusty shell surrounding the star was formed by a large mass loss rate of M⊙yr-1. The shell expansion velocity of 20 km s-1 has been measured in OH maser and CO lines. Various methods and measurements suggest a distance to IRC+10011 in the range of 500 to 800 pc
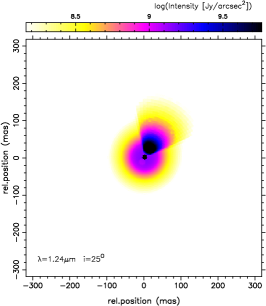
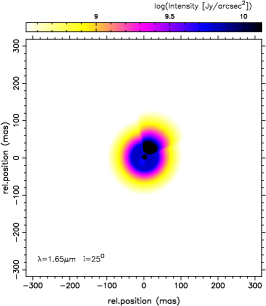
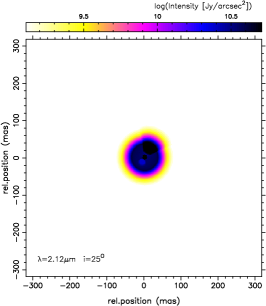
For an archetype of spherically symmetric AGB winds, the recent discovery by Hofmann et al. (2001; H01 hereafter) of distinct asymmetries in the IRC+10011 envelope came as a surprise. They obtained the first near infrared bispectrum speckle-interferometry observations of IRC+10011 in the J-, H- and K’-band with respective resolutions of 48 mas, 56 mas and 73 mas. While the H- and K’-band images appear almost spherically symmetric, the J-band shows a clear asymmetry. Two structures can be identified: a compact elliptical core and a fainter fan-like structure. H01 also performed extensive one-dimensional radiative transfer modelling to explain the overall spectral energy distribution (SED) and angle-averaged visibility curves. Their model required a dust shell with optical depth around a 2250 K star, with a dust condensation temperature of 900 K. This one-dimensional model successfully captured the essence of the circumstellar dusty environment of IRC+10011 but could not address the observed image asymmetry and its variation with wavelength. In addition, the model had difficulty explaining the far-IR flux, requiring an unusual transition from a density profile to the flatter for larger than 20.5 dust condensation radii. Finally, the model produced scattered near-IR flux in excess of observations.
We report here the results of 2D radiative transfer modelling of IRC+10011 that successfully explain the observed asymmetries. After analyzing in §2 general observational implications we describe in §3 our model for a bipolar outflow in IRC+10011. In §4 we present detailed comparison of the model results with the data and resolution of the problems encountered by the 1D modelling. The discussion in §5 advances arguments for the role of bipolar jets in shaping the circumstellar envelope of IRC+10011 and other AGB stars. We conclude with a summary in §6.
2 Observational Implications
The near-IR images, especially the J-band, place strong constraints on the dust density distribution in the inner regions. Emission at the shortest wavelengths comes from the hottest dust regions. For condensation temperature 1,000 K the peak emission is at 4m, declining rapidly toward shorter wavelengths. At 1.24 m, the J-band is dominated by dust scattering. It is easy to show that scattering by a dust density distribution produces a brightness profile (Vinković et al, 2003). The J-band image from H01 is elongated and axially symmetric. The decline of brightness from its central peak along this axis of symmetry is different in the opposite directions. In one direction it declines as , corresponding to the density profile typical of stellar winds. But in the other direction the brightness falls off only as , corresponding to the flat, unusual density profile.
The large scale structure is not as well constrained by imaging. However, all observations are consistent with the following simple picture: An optically thick spherical wind has the standard density profile. Since the buildup of optical depth is concentrated in the innermost regions for this density law, the near-IR imaging penetrates close to the dust condensation region. The wind contains an imbedded bipolar structure of limited radial extent and density profile . The system is observed at an inclination from the axis so that the wind obscures the receding part of the bipolar structure, creating the observed asymmetry of the scattering image, which traces directly the density distribution. The inclination angle must be 45∘ since a larger value starts to expose the receding part. But the inclination cannot be too small because the approaching part would get in front of the wind hot dust, leading to a strong 10 m absorption feature, contrary to observations. Because of its shallow density profile, the column density of the bipolar structure increases as away from the condensation cavity, and the size of J-band image corresponds to the distance where the scattering optical depth reaches unity. Regions further out do not show up because of self-absorption. Dust emission is affected also by the temperature distribution, and the central heating by the star tends to produce spherical isotherms. Images taken at longer wavelengths, such as the K-band, can thus appear more symmetric.
Some qualitative estimates of the gas density follow immediately. The wind optical depth at the J-band must be 1. This optical depth is accumulated close to the dust condensation radius, roughly 3 cm for a distance of 650 pc. Assuming a standard dust-to-gas mass ratio of 1:100, the gas density at the condensation radius is 3 cm-3. For the bipolar structure, the J-band optical depth is 1 across the size of the observed image, which is 2 cm. This leads to a density estimate of 7 cm-3 at the condensation radius within the bipolar structure. These rough estimates are within a factor 10 of the results of the detailed modelling described below.
The density at the base of the outflow is about an order of magnitude lower in the bipolar structure than in the wind region. An outflow can bore its way through another denser one only if its velocity is higher so that it plows its way thanks to its ram pressure. The propagation of such high-velocity bipolar outflows has been studied extensively in many contexts, beginning with jets in extragalactic radio sources (Scheuer 1974). The jet terminates in a shock, resulting in an expanding, elongated cocoon similar to the observed bipolar structure. With a density law, most of the bipolar structure mass is concentrated at its outer edge with the largest , consistent with the structure of the expanding cocoon.
Figure1.jpg
3 2D Modeling of IRC+10011
Detailed 2D radiative transfer modeling was conducted with our newly developed code LELUYA (see Appendix). Starting with the minimal configuration that explains all available observations, we show on physical grounds that this minimal model must be modified and propose a suitable modification.
3.1 A Minimal Model
For the first working model we adopt the geometry shown in figure 1, which requires the minimal number of free parameters. Each polar cone is described by its half-opening angle and radial extent . Apart from discontinuities across the cone boundaries, the density depends only on . It varies as inside the cones and outside, out to some final radius . To complete the description of the geometry we need to specify its inner boundary, and it is important to note that this cannot be done a-priori. Dust exists only where its temperature is below the condensation temperature . Following H01 we select = 900 K. The dust inner boundary, corresponding to the radial distance of dust condensation, , is determined from
| (1) |
The equilibrium dust temperature, , is set by balancing its emission with the radiative heating. But the latter includes also the diffuse radiation, which is not known beforehand when the dust is optically thick; it can only be determined from the overall solution. Furthermore, because the spherical symmetry is broken by the cones, the shape of the dust condensation surface can be expected to deviate from spherical and is not known a-priori. Therefore equation 1 completes the description of the geometry with an implicit definition of the inner boundary .
The radiative transfer problem for radiatively heated dust possesses general scaling properties (Ivezić & Elitzur 1997). As a result, is the only dimensional quantity that need be specified. All other properties can be expressed in dimensionless terms. Luminosity is irrelevant, the only relevant property of the stellar radiation is its spectral shape, which we take as black-body at = 2,250 K. For individual dust grains, the only relevant properties are the spectral shapes of the absorption and scattering coefficients. For these we adopt spectral profiles corresponding to the silicate grains of Ossenkopf, Henning & Mathis (1992) with the standard size distribution described by Mathis, Rumpl & Nordsieck (1977; MRN). Our calculations employ isotropic scattering. These properties are the same everywhere.
Density and distance scales do not enter individually, only indirectly through overall optical depth. With two independent density regions, the problem definition requires two independent optical depths. For this purpose we choose and , the overall optical depths at visual wavelengths along the axis and the equator, respectively. Spatial dimensions can be scaled with an arbitrary pre-defined distance, which we choose as the dust condensation radius in the equatorial plane, (90∘). Radial distance is thus replaced with so that, e.g., . Equation 1 becomes an equation for the scaled boundary of the condensation cavity. The relation between angular displacement from the star and the distance is
| (2) |
where is the stellar angular size and is the scaled stellar radius. Physical dimensions can be set if one specifies a stellar luminosity , which determines the condensation radius (90∘).


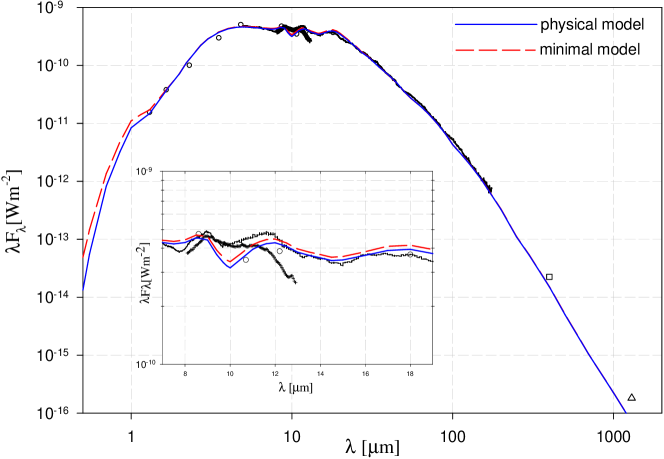
To summarize, in all of our model calculations the following quantities were held fixed: grain properties, = 900 K, = 2,250 K and the outer boundary . We varied , , and . Once a model is computed, comparison with observations introduces one more free parameter, the viewing angle . A detailed discussion of the data is available in H01. Figure 2 shows the SED for the best fit model which has = 40, = 20, , and . The 10m region is difficult to fit in full detail. Any further improvement would probably require more complicated geometry and/or modified dust properties. The fit yields a bolometric flux of , corresponding to = 10.82 mas for the stellar angular size, similar to the 10.9 mas derived in H01. The IR-flux measurements determine the total amount of emitting dust. Assuming a standard = cm2, the overall mass of the IRC+10011 circumstellar shell is 0.13 M⊙.
3.1.1 Shortcomings of the Minimal Model
The minimal-model success in fitting the SED implies that it contains the proper amount of dust. In addition to the SED, this model reproduces adequately all the imaging observations at near-IR. However, these observations probe only the innermost regions of the bipolar structure and do not provide adequate constraints on its full extent.
We now show that the cones cannot extend all the way to = 700, as required from the fit to the SED by the minimal model. If the cones were that large, the ratio of mass contained in them and in the wind region would be = 1.7, that is, most of the circumstellar mass would be in the cones. But such large mass cannot be swept-up wind material because the fractional volume occupied by the cones is only 0.034. And building up this mass with enhanced outflow through the polar regions can also be ruled out, as follows: Mass conservation along stream lines yields , where is the dimensionless density profile, and are the velocity and density at the streamline base , and is the duration of the outflow. Applying this relation to streamlines in the cone () and wind () regions yields
| (3) |
With = 700, the product is 5.2 in the cone regions while in the wind it is only 1000. Since the wind starts with a sonic velocity 1 km s-1, the conical outflow would have to start with velocity km s-1, where and are the wind and cones lifetimes. This is impossible since the bipolar structure would extend much further than the wind even for ; taking a physical only makes things worse. This argument can be easily extended to show that, irrespective of the magnitude of , the mass in the cones could not be deposited purely by recent enhancement of polar mass loss rates. A substantial fraction, perhaps even all, of this mass must be swept-up wind material.
3.2 A Physical Model
While our minimal model provides successful fits for all observations, cannot be as large as this model requires. Unfortunately, observations do not yet meaningfully constrain because at 10 the near-IR brightness drops below current detection capabilities. A physical model for the origin of the bipolar structure (§5.2) suggests that the cones extend to = 47 (equation 5). Adopting this value, the minimal model must be modified to account for the far-IR flux produced by the large mass removed from the rest of the cones. This mass can be placed elsewhere as long as its temperature distribution corresponds to far-IR wavelengths (equation A7 in Vinković et al. 2003). With the total far-IR flux as the only observational constrain, the only firm limit on this cold dust component is that it starts at 100 so that its temperature is 100 K; in all other respects, the geometry is arbitrary.
To account for the far-IR excess, the H01 wind model, which did not incorporate the bipolar component, placed additional cold dust in a spherical component with density profile at . Here we propose a simpler alternative: a detached spherical shell of increased dust density due to an earlier phase of higher mass loss rate. The radial wind dust density profile jumps by factor 3 at so that
| (4) |
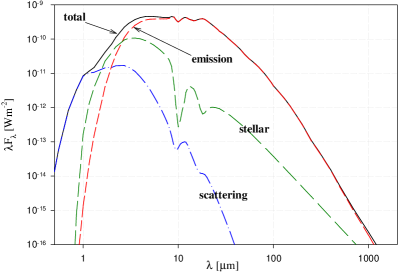
With the cold dust displaced from the cones to the wind, the equatorial optical depth increases from = 40 in the minimal model to 40.72. Along the axis, drops from 20 to 5.1, of which 4.3 comes from the cones. As is evident from figure 2, the SED produced by this physical model is almost identical to that of the minimal model. The contributions of different components to the total flux are shown in the left panel of figure 3, with the fractional contributions shown in the right panel.
Table 1 summarizes the input parameters, and various properties derived below, of our model. The proposal of a two-shell model is motivated mostly by physical plausibility since other than the SED, current observations do not place meaningful constraints on the cold dust configuration. We have verified that a disk geometry for the cold dust would also successfully reproduce the SED by modeling with disk structures of inner radius and radial density profiles and . However, a disk geometry for the cold dust component suffers from the same shortcomings as the extended cones of the minimal model (§3.1.1).
The actual dust configuration is probably more complicated than our simple description. Imaging observations at 8.55 m with spatial resolution of 50 by Marengo et al. (1999) suggest an extension along an axis almost perpendicular to the symmetry axis of the bipolar structure. This possible additional asymmetry is not accounted by our physical model.
| stellar temperature | 2250 K |
|---|---|
| stellar size | 10.8 mas (7 AU†) |
| luminosity† | 1.3 L⊙ |
| bolometric flux | W m-2 |
| dust condensation temperature | 900 K |
| condensation radius (90∘) | 35.4 mas (23 AU†) |
| viewing angle | 25∘ |
| Wind — Inner shell: | |
| density profile | |
| inner boundary | () (eq. 1) |
| outer boundary | 100(90∘) |
| radial | 39.6 |
| mass∗ | 0.005 M⊙ |
| age†† | 550 years |
| mass loss rate∗†† | 9 M⊙ yr-1 |
| Wind — Outer shell: | |
| density profile | |
| inner boundary | 100(90∘) |
| outer boundary | 1000(90∘) |
| radial | 1.1 |
| mass∗ | 0.13 M⊙ |
| age†† | 5500 years |
| mass loss rate∗†† | 2 M⊙ yr-1 |
| Cone Properties: | |
| opening angle 2 | 30∘ |
| density profile | |
| outer boundary | 47(90∘) |
| axial | 4.3 |
| mass∗ | M⊙ |
| age∗† | 200 years |
4 Visibility Functions and Images
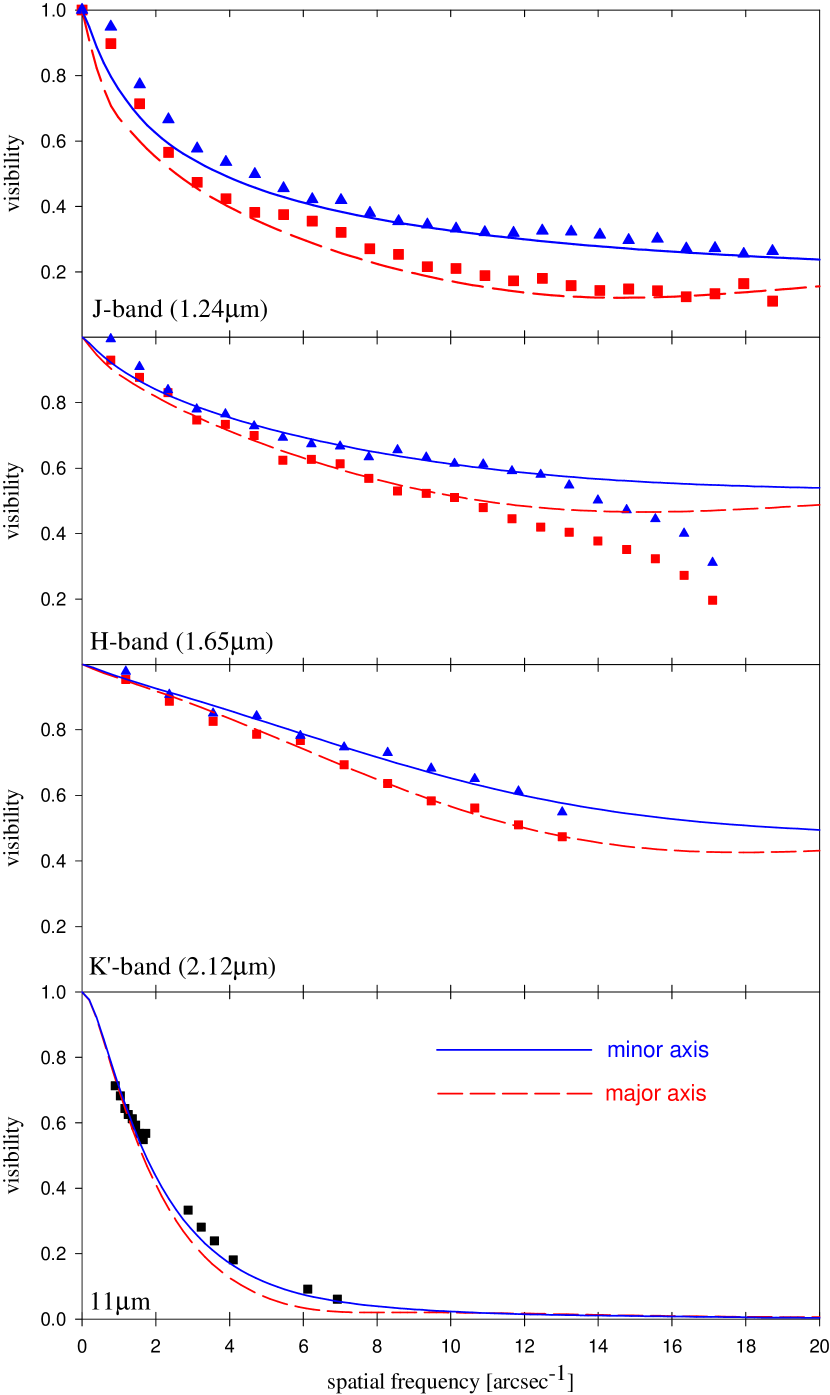
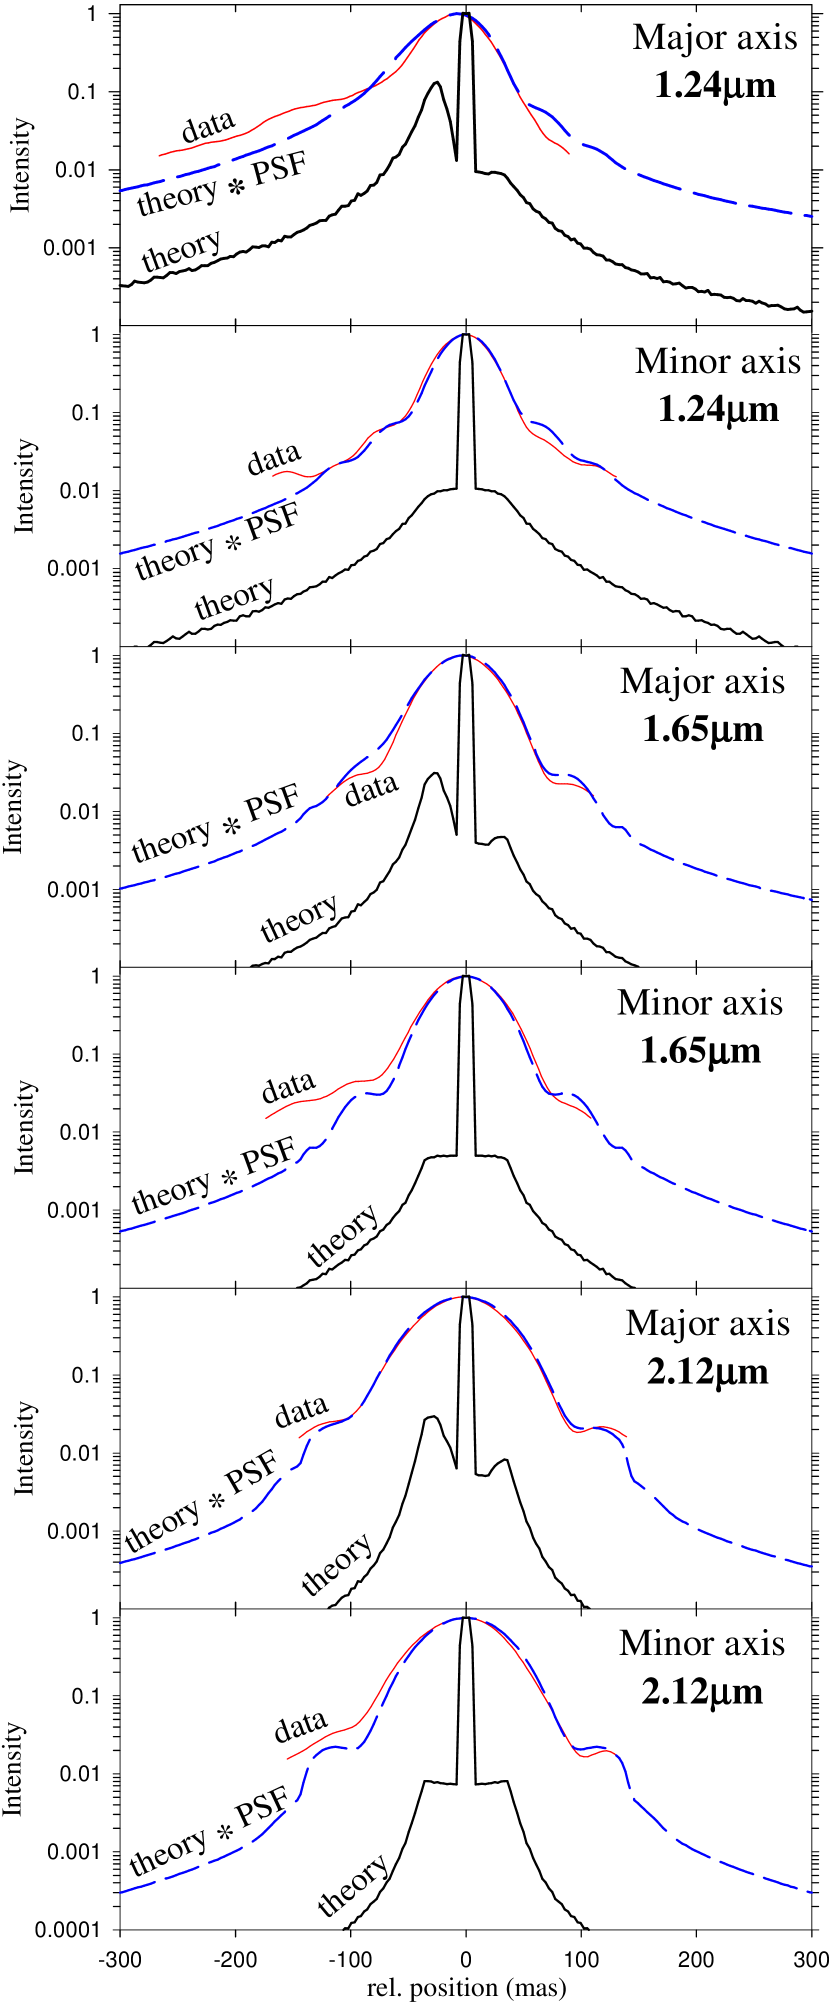
With the model parameters set from the SED, the surface brightness distribution is fully determined, and the visibility functions are calculated from the brightness. For comparison with observations, the visibility must be normalized with the flux collected within the field of view . If the image is divided into pixels then the spatial frequency is , where . Adopting , sufficiently large to resolve the highest measured spatial frequencies, and from the instrumental system, the results shown in figure 4 contain no additional free parameters. In contrast with the SED, the visibility displays a strong sensitivity to the grain size. A change of only 0.05 m in the maximum grain size has a significant effect on the visibility curves. Our physical model has = 0.20 m, resulting in good fits for both the SED (figure 2) and the four different visibility curves (figure 4).
The J-band visibility is the most difficult to model because it is dominated by the scattered light and thus very sensitive to fine details of the density distribution and grain size. Since the agreement between data and theory is better for small scales (higher spatial frequency), the quality of the fit to the J-band image can be expected to deteriorate with distance from the star. The model does not explain the puzzling drop in the H-band visibility at cycles per arcsec, corresponding to structure smaller than the condensation cavity. Since a similar drop is not present in the J-band, it must correspond to material that emits but does not scatter light significantly. Hot gas might be a possible explanation.
Figure6.jpg
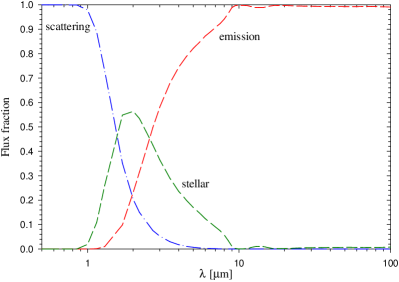
Our model images and their convolution with the instrumental PSF of H01 are shown in figure 5. The comparison between the model and observed images is satisfactory, indicating that the overall geometry is properly captured by our simple model. The “halo” around the star in J-band model image is brighter than observed. Possible explanations are dust accumulation close to the equatorial region as well as asymmetric dust scattering. The overall image asymmetry is much more prominent in the J-band, where dust scattering dominates the radiative transfer (see figure 3). As the wavelength shifts toward dominance of dust thermal emission, the image becomes more symmetric. The reason is that scattered light traces directly the density distribution while the dust emission is affected also by the temperature distribution. Figure 6 shows the dust temperature distribution around the condensation cavity. Because of the central heating, the temperature decreases with radial distance and tends to create circularly symmetric isotherms. The asymmetric diffuse radiation distorts the isotherms, but the deviations from circularity are small, especially at the high dust temperatures traced by the K-band image. As a result, the image becomes more symmetric, especially after convolution with the PSF as shown in the lower panel of figure 5.
As evident from figure 5, the PSF convolution smears out the star and the nearby fan-shaped structure into one broad elongated peak whose center is shifted from the stellar position. This shift is more clearly noticeable in the brightness profiles, shown in figure 7. The shift is 8.3 mas along the major axis in the J-band and 2.8 mas for the H- and K’-bands. The images provide tight constraints on the inclination angle. Neither nor produce acceptable fits, so that .
5 Discussion
Thanks to the scaling properties of dust radiative transfer, neither luminosity, distance or density absolute scales were specified. The distance to the source of 650150 pc fixes those scales, so that the luminosity is 1.3 L⊙ and the dust condensation radius is AU. The wind inner shell extends to 2,300 AU, thus containing all the masers, including the OH 1612 MHz (Elitzur, Goldreich & Scoville 1976), and its mass is 5 M⊙. With a wind velocity of 20 km s-1, the duration of this phase is 550 years and the corresponding mass loss rate is 9 M⊙ yr-1. The wind outer shell extends to 23,000 AU and its mass is 0.13 M⊙. Assuming the same wind velocity, the duration of this phase is 5,500 years and the corresponding mass loss rate is 2 M⊙ yr-1.
Modelling uncertainties allow a few times larger size of the inner shell, resulting in its larger mass and duration. The outer shell has much smaller overall uncertainties since its total mass is constrained by the far-IR flux. We can still derive general conclusions that:
-
1.
the duration of the inner shell is 1,000 years, while the outer shell is 5 to 10 times older;
-
2.
the overall dust opacity comes mostly from the inner shell;
-
3.
the mass is contained almost exclusively in the outer shell, with about 10 to 30 times more mass than the inner shell;
-
4.
the mass loss rate is of the order of M⊙ yr-1, with a few times larger rate in the other shell;
-
5.
the overall circumstellar mass of 0.13 M⊙ indicates that IRC+10011 is close to the end of its AGB evolution.
5.1 Dust Properties
Our models employ silicate grains from Ossenkopf et al. (1992) with the standard MRN size distribution. We found that the upper limit on the grain sizes had to be reduced to = 0.20 m from the standard 0.25 m. While this change made little difference in the SED analysis, it was necessary for proper fits of the visibility curves. The most important effect of is control of the crossover from scattering to emission dominance, crucial for explanation of the observed change from elongated to circular images between the J- and K-bands (see §4). Although we cannot claim to have determined the precise magnitude of , the fact that it is smaller than the standard seems certain.
The dust properties in our model were the same everywhere to minimize the number of free parameters. In a detailed study of the proto-planetary nebula IRAS 16342-3814, Dijkstra et al. (2003) find that the maximum grain size varies from 1.3 m in a torus around the star to 0.09 m in the bipolar lobes. If such a variation in dust properties can occur already on the AGB, the we find would represent an average over the cones and wind regions.
5.2 Jet Model for the Bipolar Structure
The near-IR brightness observations map a region of the cones that extends to and has optical depth , corresponding to a gas density at the base of each cone of = 1.3 cm-3. In contrast, the gas density at the base of the wind region (obtained from = 41) is = 1.7 cm-3. The large density disparity amplifies our earlier conclusion that the bipolar cones are sustained by high-velocity ram pressure.
The small density at the base of the cones shows that their material has been evacuated and deposited at larger distances by a recent event. We propose the following simple scenario for the bipolar structure: High-velocity low-density jets were recently turned on at the polar regions. The jets cleared out polar cavities but are trapped by the material pushed ahead by their ram pressure, resulting in an expanding cocoon as described first by Scheuer (1974). Our model cones are a description of the current density distribution of the cocoon, a snapshot of an inherently dynamic structure. In this picture, the mass in the cones is swept-up ambient wind material and the cone boundary is then
| (5) |
The swept-up mass is only M⊙. The leading edge of the cocoon moves at velocity , where is the local wind velocity and . From pressure balance during jet confinement,
| (6) |
where and are densities across the cocoon leading edge and is the local speed of sound in the wind. This condition requires that the density of the cones be smaller than the ambient density into which they are expanding, i.e., , restricting the cone radial extension to 26 which is slightly smaller than the derived . We attribute this discrepancy to the approximate nature of our model, in which the complex structure of the cocoon–wind boundary is replaced with the sharp-cutoff of the simple power-law density distribution of the cones. Taking at the cone boundary, pressure balance implies , consistent with a recent start of the jet confinement. Assuming that the cocoon radial boundary moves according to , with 1 to ensure acceleration, its velocity is . This yields an estimate for the jet lifetime
| (7) |
for 1.
Because of the steep decline of the wind density, the expansion accelerates rapidly as the cocoon boundary reaches lower density regions. Eventually it will break out of the wind, exposing the underlying jets. Indeed, a striking example of such a configuration comes from the recent observations, including proper motion measurements, of water masers in W43A by Imai et al. (2002). The observations reveal tightly collimated velocities of 150 km s-1 at distances up to 0.3 pc at the two ends of an axis through the star. These masers are created by the impact of the jets on clumps in the surrounding medium. In addition to these far-away high-velocity masers, the source displays the usual configuration typical of OH/IR stars – OH and water masers in shells expanding with velocities 9 km s-1 with radii of 500 AU. Therefore this source displays both the spherical AGB wind and the jets that broke through it. A similar, and probably more evolved, example is IRAS16342-3814. Similar to W43A, this is a “water-fountain” jet PPN source but its bipolar cavities are also seen with HST (Sahai et al. 1999).
5.3 Asymmetry Evolution in AGB Stars
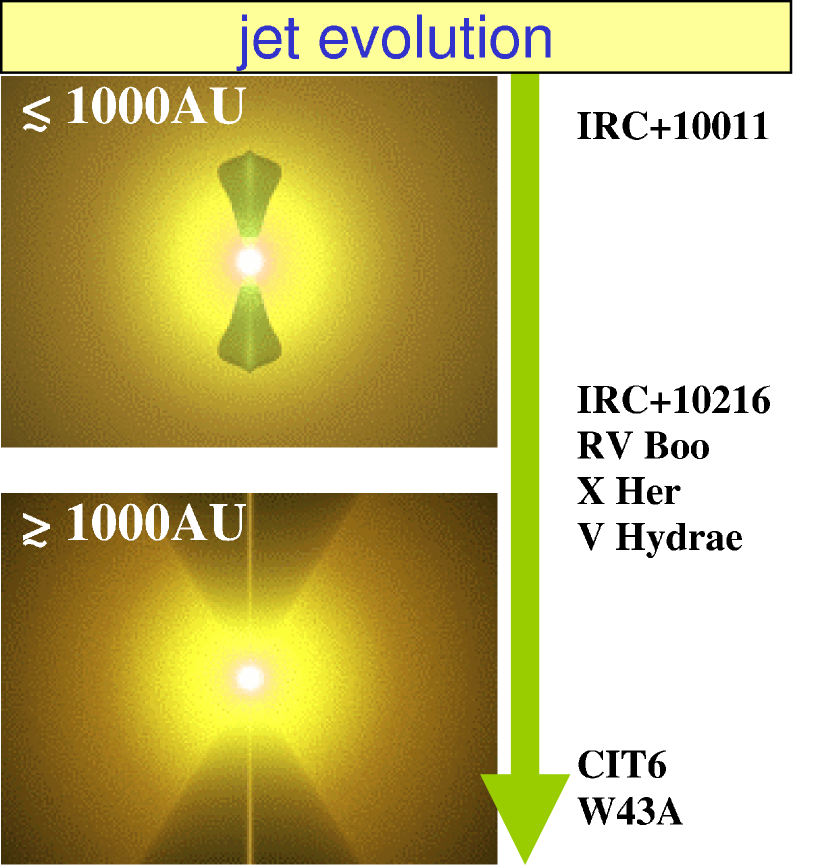
IRC+10011 and W43A can be considered, respectively, the youngest and most evolved examples of sources displaying the evolution of bipolar jets working their way through AGB winds. The proposal that jets, operating at the late AGB or early post-AGB phase, are the primary mechanisms for shaping PNe has been made already by Sahai & Trauger (1998) and since supported by numerous observations. The prototype C-rich star IRC+10216 shows circular shape on the 20 arcsec scale both in V-band (de Laverney 2003) and molecular line images (e.g., Dayal & Bieging 1995). But high-resolution IR imaging at the 0.1 arcsec scale reveal elongated structure similar to that in IRC+10011 (Osterbart et al. 2000, Weigelt et al. 2002). Unlike IRC+10011, though, where only the J-band image gives clear indication of asymmetry, in IRC+10216 it is evident even in the K-band. This strongly suggests that IRC+10216 represents a more advanced stage than IRC+10011 of the evolution of a jet-driven cocoon confined by the ambient spherical wind.
The C-rich star V Hya provides an example that is further along in evolution. Recent CO observations by Sahai et al. (2003a) show that the bulk of the emission comes from an elongated structure centered on the star. In addition, an emission blob is approaching at a projected line-of-sight velocity of 250 km s-1 along an axis perpendicular to this elongation. This is the expected morphology of a bipolar outflow breaking from the confinement of the high-density region of the AGB wind if the receding blob is obscured by the central torus. A similar structure has been found in the O-rich star X Her. Partially resolved CO observations by Kahane & Jura 1996 reveal a spherical component expanding with only 2.5 km s-1 and two symmetrically displaced 10 km s-1 components, likely to be the red and blue shifted cones of a weakly collimated bipolar flow. The bipolar lobes are 1.5 times bigger than the spherical component. Finally, the C-rich star CIT6 presents an even more evolved system. A bipolar asymmetry dominates the image in molecular line mapping by Lindqvist et al. (2000), Keck imaging by Monnier et al. (2000) and HST-NICMOS imaging by Schmidt et al. (2002).
Figure 8 shows a schematic sketch of our proposed evolutionary sequence. The evolutionary stage of each indicated object is our rough estimate based on current observations. This figure is only meant as an illustration of the time-line suggested by our proposed scenario. The placing of different objects is based on different kinds of data. For example, for X Her we only have single-dish mm-wave observations with their attendant large beams, whereas IRC+10216 and V Hya were observed with the much higher resolution of HST. Also, whereas there is direct kinematic evidence for the high-velocity jets in V Hya and W43A, the same is lacking for the other objects. We can also expect that in objects with different jet properties (e.g., mass flux, speed, opening angle) and different AGB mass-loss rates in the inner region, the jets will follow different time histories of when they “break out” and the opening angle of the bipolar cone which they dig in the AGB envelope will be different. Also, if jets are episodic than they can change their direction (for which there is observational evidence). The actual picture can be expected to be quite more complex than the simple sketch in Fig 8. Nevertheless, we expect the displayed sequence to provide useful guidance for future studies.
6 Summary and Conclusions
We find that the circumstellar shell of IRC+10011 contains 0.13 M⊙, extends to a radial distance of 23,000 AU ( 35″) from the star and is 5,500 years old. Most of the mass ( 96%) is contained in the outer shell from 2,300 AU ( 3.5″), corresponding to an earlier phase when the mass-loss rate was about factor 3 higher than now. The near-IR image asymmetries discovered within the central 0.1″of this system originate from M⊙ of swept-up wind material in a cocoon elongated along the axis, extending to a radial distance of 1,100 AU. The cocoon expansion is driven by bipolar jets that it confines, and that were switched on 200 years ago. The axial symmetry of the J-band image eliminates the possibility of a companion star, unless closer than 5 stellar radii. Higher sensitivity and/or better angular resolution would uncover image asymmetry in the K-band too.
Jet-driven cocoon expansion at various stages of development has now been observed in a number of AGB stars, culminating in breakout from the confining spherical wind (§5.3). The immediate post-AGB stage is believed to be the proto-planetary-nebula (PPN) phase. A morphological study of a large sample of PPNs suggested the presence of jets that broke through the massive AGB wind, but it was not known if a similar morphology extends back to the AGB phase (Meixner et al. 1999; Ueta, Meixner & Bobrowsky 2000). Indeed, jets are found to be quite common in PPN as shown by the recent observations of IRAS16342-3814 (Sahai et al. 1999) K3-35 (Miranda et al. 2001), Hen 3-1475 (Riera et al. 2003) and IRAS22036+5306 (Sahai et al 2003b), for example. The case of K3-35 is particularly striking because of its great similarity to the AGB star W43A: water masers at the tips of bipolar jets at a large distance from the systemic center, which is surrounded by masers in the standard spherical shell configuration. This strongly suggests that W43A provides a glimpse of the immediate precursor of K3-35.
These new developments enable us to identify the first instance of symmetry breaking in the evolution from AGB to planetary nebula. Bipolar asymmetry appears during the final stages of AGB mass outflow. Mounting evidence suggests that this asymmetry is driven by collimated outflow in the polar regions. More complex geometries emerge in the post-AGB phase from a mixture of various processes that could involve multiple jets, fast winds, etc. These processes operate in the environment shaped by the AGB phase, leading to the myriad of complex structures found in PPN sources (e.g. Su, Hrivnak & Kwok 2001).
Acknowledgments
We thank R. Sahai for most useful comments. Support by NSF grants PHY-0070928 (D.V.) and AST-0206149 (M.E.) is gratefully acknowledged. This work was also supported by National Computational Science Alliance under AST020014 and utilized the HP Superdome cluster at the University of Kentucky. We thank the University of Kentucky’s KAOS group at the Electrical Engineering department for time on their 65-processor Linux cluster KLAT2.
References
- [1]
- [2] Balick B., Frank A., 2002, ARA&A, 40, 439
- [3] Bergman P., Kerschbaum F., Olofsson H., 2000, A&A, 353, 257
- [4] Biller B. A., et al., “Asymmetric Planetary Nebulae III”, Mt. Rainier National Park, 28 July - 1 August 2003
- [5] Le Bertre T., 1993, A&AS, 97, 729
- [6] de Laverney P., 2003, in Mass-losing pulsating stars and their circumstellar matter, ed. Nakada, Y., Honma, M. & Seki, M. (Kluwer: Dordrecht), p. 197
- [7] Dayal A., Bieging J. H., 1995, ApJ 439, 996
- [8] Dijkstra C., et al., 2003, A&A, 399, 1037
- [9] Elitzur M., Goldreich P., Scoville N., 1976, ApJ, 205, 384
- [10] Goldreich P., Scoville N., 1976, ApJ, 205, 144
- [11] Haniff C. A., Buscher D. F., 1998, A&A 334, L5
- [12] Hofmann K.-H., Balega Y., Blöcker T., Weigelt G., 2001, A&A, 379, 529 (H01)
- [13] Imai H., Obara K., Diamond P. J., Omodaka T., Sasao T., 2002, NATURE, 417, 829
- [14] Ivezić Ž., Elitzur M., 1997, MNRAS, 287, 799
- [15] Kahane C., Viard E., Menard F., Bastien P., Manset N., 1997, ApSS, 251, 223
- [16] Kahane C., Jura M., 1996, A&A, 310, 952
- [17] Kurucz R., 1969, ApJ, 156, 235
- [18] Lindqvist M., Schöier F. L., Lucas R., Olofsson H., 2000, A&A, 361, 1036
- [19] Lipman E. A., et al., 2000, ApJ, 532, 467
- [20] Meixner M., et al. 1999, Apjs, 122, 221
- [21] Miranda L. F., Gómez Y., Anglada G., Torrelles J. M., 2001, NATURE, 414, 284
- [22] Marengo M., Busso M., Silvestro G., Persi P., Lagage P. O., 1999, A&A, 348, 501
- [23] Mathis J. S., Rumpl W., Nordsieck K. H., 1977, ApJ, 217, 425
- [24] Monnier J. D., Tuthill P. G., Danchi W. C., 2000, ApJ, 545, 957
- [25] Ossenkopf V., Henning Th., Mathis J. S., 1992, A&A, 261, 567
- [26] Osterbart R., Balega8 Y. Y., Blöcker T., Men’shchikov A. B., Weigelt G., 2000, A&A, 357, 169
- [27] Plez B., Lambert D. L., 1994, ApJ, 425, L101
- [28] Riera A., Garcia-Lario P., Manchado A., Bobrowsky M., Estalella R., 2003, A&A, 401, 1039
- [29] Sahai R., Trauger J. T., 1998, AJ, 116, 1357
- [30] Sahai R. et al., 1999, ApJ, 514, L115
- [31] Sahai R. et al., 2003a, NATURE, 426, 261
- [32] Sahai R. et al., 2003b, ApJ, 586, L81
- [33] Scheuer P. A. G., 1974, MNRAS, 166, 513
- [34] Schmidt G. D., Hines D. C., Swift S., 2002, ApJ, 576, 429
- [35] Skinner C. J., Meixner M., Bobrowsky M., 1998, MNRAS, 300, L29
- [36] Su K. Y. L., Hrivnak B. J., Kwok S., 2001, AJ, 122, 1525
- [37] Ueta T., Meixner M., Bobrowsky M., 2000, Apj, 528, 861
- [38] Vinković D., Ivezić Ž., Miroshnichenko A. S., Elitzur M., 2003, MNRAS, 346, 1151
- [39] Weigelt G., et al., 1998, A&A, 333, L51
- [40] Weigelt G., et al., 2002, A&A, 392, 131
Appendix A Details of Radiative Transfer Modeling
FigureA1.jpg
LELUYA (www.leluya.org) is our newly developed 2D radiative transfer code that works with axially symmetric dust configurations. It solves the integral equation of the formal solution of radiative transfer including dust scattering, absorption and thermal emission. The solution is based on a long-characteristics approach to the direct method of solving the matrix version of the integral equation (Kurucz 1969). The equations are solved on a highly unstructured triangular self-adaptive grid that enables LELUYA to resolve simultaneously many orders of magnitude in both spatial and optical depth space. It also enables automatic reshaping of the dust-free cavity around the central source according to asymmetries in the diffuse radiation (eq. 1). All grid points are coupled with each other through a correlation matrix based on the dust scattering. A simple matrix inversion determines the solution of radiative transfer for a given dust temperature distribution without any iterations. The temperature is then updated and the procedure repeated. Luminosity conservation within 5% is achieved in only three steps.
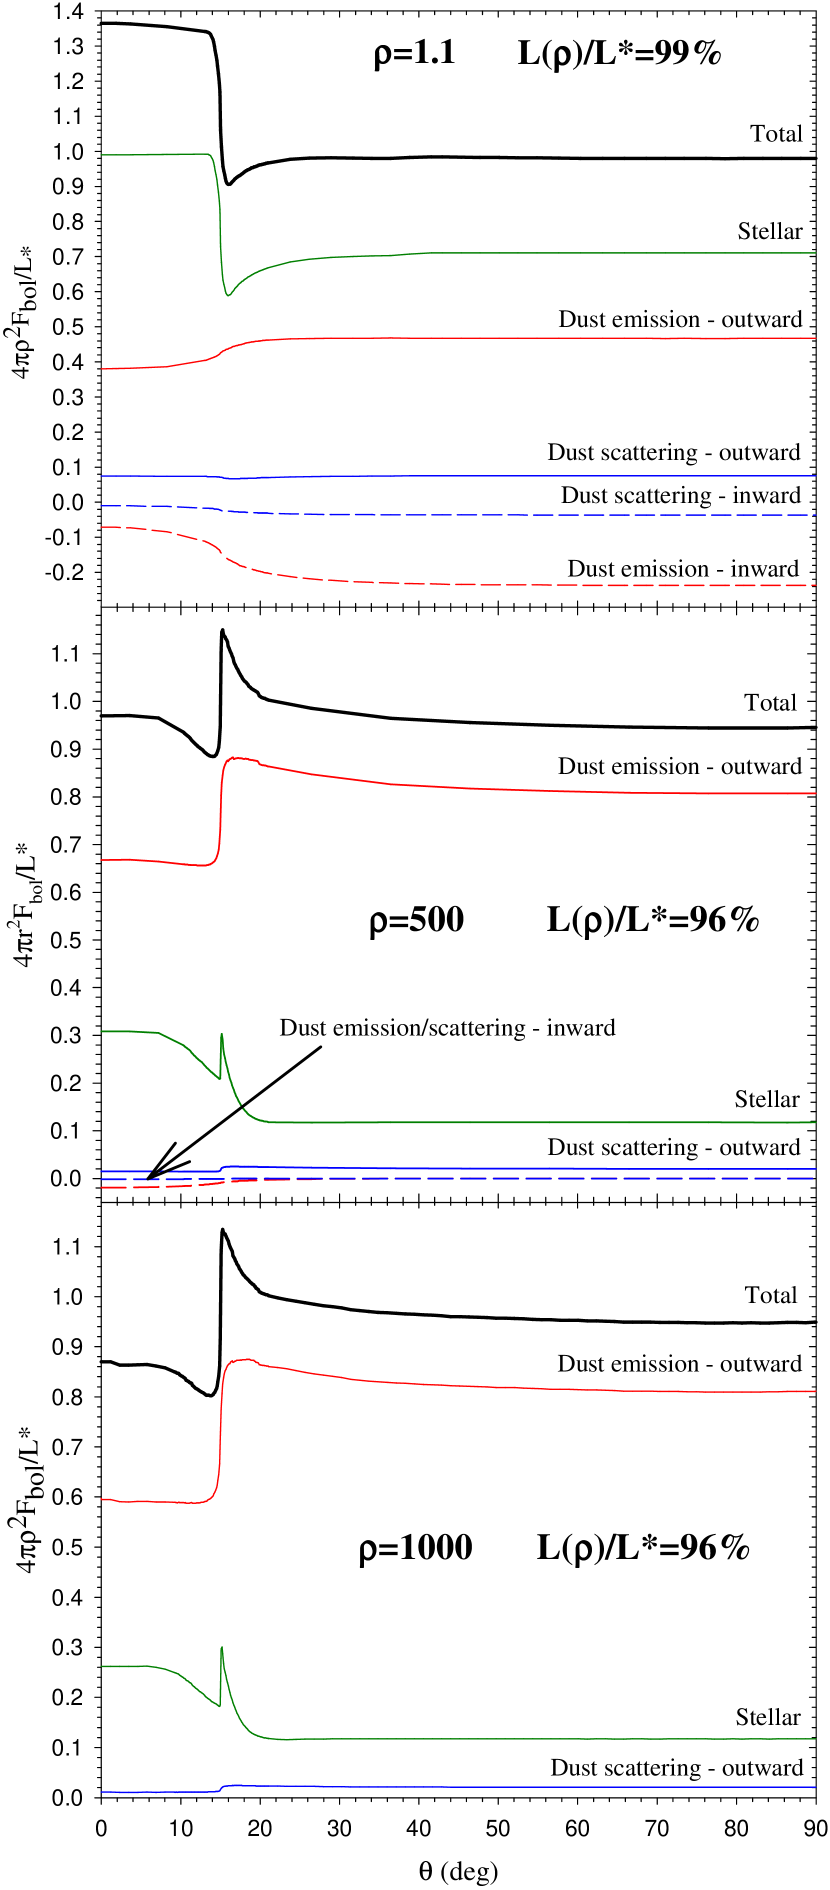
Figure 9 shows LELUYA’s computational grid for the best fit minimal model described in §3.1. Three grids of different resolutions were created for three sets of wavelengths, based on the density and optical depth variation. The first grid has 2982 points and starts with at 0.2m, the shortest wavelength considered; this is the grid shown in the figure. The second grid has 2836 points and starts at wavelengths with . The third has 2177 grid points for wavelengths with . Angular integration around a grid point is performed over a highly non-uniform self-adaptive angular grid (with about 550 rays on average).
A.1 Luminosity Conservation
Luminosity conservation is the test determining convergence to the correct physical solution. A decrease in computed luminosity indicates energy sink due to insufficient spatial grid resolution, while an increase reflects energy excess due to a coarse angular grid. It is important to note that because of the lack of spherical symmetry, the bolometric flux does vary over spherical surfaces. The conserved quantity is luminosity, the energy transmitted per unit time across any surface enclosing the star. For a sphere of radius , the luminosity is computed from the radial component of the bolometric flux vector via
| (8) |
and the luminosity conservation relation is
| (9) |
at every , where is the stellar luminosity. In spherical symmetry is -independent and . When the spherical symmetry is broken becomes -dependent and can exceed unity in certain directions, corresponding to locally enhanced energy outflow.
Our model calculations conserve luminosity within 5% at all radii. Figure 10 shows the angular variation of and its following five contributions: stellar, inward and outward emission, and inward and outward scattered flux. These angular variations are shown at = 1.1, 500 and 1000. The small spikes in close to are real, reflecting the irregular shape of the dust condensation surface. Even though these irregularities are spatially small, their effect on optical depth variations magnifies their importance. At small radii, energy outflow through the cones is enhanced in comparison with the wind and is the main reason for their higher temperature. This region is dominated by stellar contribution. At large radii these roles are reversed, the diffuse radiation (mostly dust emission) takes over and the temperatures inside and outside the cones become equal.