Black hole masses in narrow-line Seyfert 1 galaxies
Abstract
The masses of central supermassive black holes in a soft X-ray selected sample of the narrow-line Seyfert 1 galaxies (NLS1s) are estimated by some different methods to test their theoretical models. Apart from the methods using the H linewidth and the [O III] linewidth, soft X-ray excess as a prominent character of NLS1s is used to estimate the black hole masses. The virial mass derived from the H linewidth assuming random orbits of broad-line reigns (BLRs) is consistent with that from the soft X-ray bump luminosity for NLS1s but with a larger scatter. The virial black hole masses showed that most of NLS1s are in the super-Eddington accretion state while most of broad-line Seyfert 1 galaxies (BLS1s) are not. We found that the black hole mass estimated from [O III] linewidth is not in agreement with above two methods. Using the Eddington limit relation for the super-Eddington accretion suggested by Wang (2004), we found that there are 16 NLS1s satisfied with this Eddington limit relation. The masses of these 16 NLS1s derived from X-ray luminosity are systematically larger than that from H linewidth assuming random BLRs orbits. If the mass derived from X-ray luminosity is true, the mean disk inclination to the line of sight in these 16 NLS1s is about , which provided new support for the pole-on orientation effect in NLS1s.
keywords:
black hole physics — galaxies: active — galaxies: nuclei — galaxies: Seyfert — X-rays: galaxies.1 INTRODUCTION
Narrow-line Seyfert 1 galaxies (NLS1s) are a peculiar class of active galactic nuclei (AGNs). They are characterized (Osterbrock & Pogge 1985): smaller H FWHM (less than ), strong optical Fe II multiplets, the line luminosity ratio of [O III] 5007 to H is less than 3, steep soft X-ray excess (Boller et al. 1996), and rapid soft/hard X-ray variability (Leighly 1999; Cheng et al. 2002). A popular model of NLS1 is that they contain less massive black holes, but have higher accretion rates radiating at close Eddington luminosity, namely high Eddington ratios (Pounds et al. 1995; Laor et al. 1997; Mineshige et al. 2000). It has been suggested that NLS1s might be in the early stage of AGNs evolution (Grupe 1996, Grupe et al. 1999, Mathur 2000; Bian & Zhao 2003a) and black hole grows fast via a higher fraction of Eddington accretion rate (Sulentic et al. 2000; Boroson 2002). To test this hypothesis we need to estimate the black hole mass of NLS1s.
There are several methods to calculate the black hole masses in AGNs: 1) virial mass derived from the H FWHM and the sizes of broad line regions (BLRs) from the reverberation mapping technique or the empirical size-luminosity formula (Ho 1998; Wandel et al. 1999; Kaspi et al. 2000; Peterson et al. (2000); Vestergaard 2002; Bian & Zhao 2003b; 2004); 2) soft X-ray variability (Czerny et al. 2001; Bian & Zhao 2003c); 3) the relation between the mass and the bulge stellar velocity dispersion (M- relation) or the bulge luminosity (M- relation)(McLure & Dunlop 2001; Tremaine 2002). We are not sure whether above methods can apply to NLS1s for their special properties. Applying reverberation mapping technique to NLS1s is difficult since they are usually less variable in optical band (Shemmer & Netzer 2000). Whether the assumption of the random BLRs orbits in NLS1s is suitable or not is a question open to debate (Bian & Zhao 2002). The empirical size-luminosity relation is only based on many broad-line Seyfert 1 galaxies (BLS1s) and a few NLS1s (Kaspi et al. 2000). Peterson et al. (2000) suggested that NLS1s and BLS1s follow the same size-luminosity relation. However, BLRs physics in NLS1s is possibly special and different compared with BLS1s (e.g. Boller et al. 1996). Therefore, whether NLS1s follow this relation or not should be confirmed by future observation in NLS1s. The relation may not apply to NLS1s since they are most likely in the early stage of AGNs evolution, which is intimately related with the black hole growth process (Mathur et al. 2001; Wandel 2002; Lu & Yu 2003; Shields et al. 2003; Bian & Zhao 2004; Grupe & Mathur 2004).
As an extreme feature in NLS1s, Soft X-ray excess may most likely be caused by high accretion rate in units of Eddington accretion rate. This character could be used to probe the black hole mass since the photon trapping effect gives a saturated luminosity, namely the luminosity is almost independent to the accretion rate (Wang & Zhou 1999; Wang et al. 1999; Ohsuga et al. 2002). Recently Wang & Netzer (2003) presented a extreme slim disk with a hot corona to explain the soft X-ray bump in NLS1s and suggested that soft X-ray humps in NLS1s are natural consequences of super-Eddington accretion. They found that the hump X-ray luminosity is weakly dependent on the accretion rate and almost completed determined by black hole mass in their model:
| (1) |
Where is the soft X-ray luminosity in the flat part of the bump. It provides new method to estimate the black hole masses in NLS1s with super-Eddington accretion rates.
In this paper, we compared the results from different methods to estimate the black hole masses in a sample of NLS1s and BLS1s (Grupe et al. 2004). We tried to find which method is suitable to estimate the black hole masses in NLS1s and whether the disk inclinations to the line of sight in NLS1s compared with BLS1s are small or not. All of the cosmological calculations in this paper assume , , .
2 Sample
There are many samples suitable for this kind of research. Boller et al. (1996) presented an optically selected sample of 46 NLS1s with extremely steep soft X-ray spectra observed with ROSAT. Verron-Cetty et al. (2001) compiled a sample of 64 NLS1s and systematically studied their optical spectra. Willams et al. (2003) presented a sample of 150 NLS1s found within the Sloan Digital Sky Survey (SDSS) Early Data Release (EDR), which is the largest sample of NLS1s. Grupe et al. (2004) presented a complete sample of 110 soft X-ray selected AGNs adopting the criterion of Hardness ratio less than zero and found about half of them are NLS1s. In order to estimate the central supermassive black hole masses in NLS1s, we used different methods including that from soft X-ray hump luminosity and that from the H width. Here we used the sample of Grupe et al. (2004) for its completeness. This sample can also be used to do a comparable study on NLS1s and BLS1s (Grupe 2004 ).
3 Methods
As the first method, we can estimate the virial masses from H linewidth based on the assumption that the BLRs clouds are controlled by the central black hole gravitational potential (Kaspi et al. 2000). If we know the BLRs sizes () and BLRs velocity (), we can derived the black hole mass () using Newton law, . The BLRs sizes can be derived from the reverberation mapping method or the empirical size-luminosity formula,
| (2) |
where is the monochromatic luminosity at 5100. Assuming the random BLRs orbits, the BLRs velocity can be derived from the H linewidth (),
| (3) |
This method has been discussed by some authors (Wang & Lu 2001; Bian & Zhao 2003b; Bian & Zhao 2004; Shields et al. 2003; Boroson 2003).
As the second method, we can derive the mass from the [O III] linewidth. There is a relation between the black hole mass, , and the bulge velocity dispersion, , found in the nearby normal galaxies (Tremaine 2002):
| (4) |
The bulge velocity dispersion can be derived by the [O III] linewidth emitting from the narrow line region (NLRs), where (Nelson 2000).
As the third method, we can use the soft X-ray hump luminosity to calculate the back hole masses in AGNs with the Eddington ratio (see equation (1)).
4 Results and discussion
| Name | log() | log() | log() | FWHM(H) | |
|---|---|---|---|---|---|
| TonS180 | 1.89 | 6.85 | 8.64 | 6.82 | 970 |
| RXJ0117.5–3826 | 2.09 | 6.91 | 7.93 | 7.97 | 900 |
| MS0117–28 | 2.27 | 7.96 | 9.39 | 8.11 | 1681 |
| RXJ0148.3–2758 | 2.12 | 7.02 | 8.83 | 7.78 | 1030 |
| RXJ0439.6–5311 | 2.39 | 6.59 | 10.01 | 7.71 | 700 |
| 1ES0614–584 | 2.46 | 6.23 | 6.64 | 6.95 | 1080 |
| RXJ1034.6+3938 | 2.38 | 5.8 | 7.56 | 7.1 | 701 |
| RXJ1209.8+3217 | 3.18 | 6.74 | 9.1 | 7.41 | 1320 |
| Mkn766 | 1.77 | 6.28 | 7.16 | 7.04 | 1100 |
| CBS150 | 2.13 | 7.36 | 8.09 | 7.98 | 1350 |
| PG1244+026 | 1.79 | 6.07 | 7.51 | 6.05 | 830 |
| RXJ1304.2+0205 | 2.38 | 7.19 | 9.1 | 7.64 | 1300 |
| RXJ1319.9+5235 | 1.6 | 6.25 | 6.8 | 6.69 | 950 |
| QSO1421–0013 | 1.72 | 7.27 | 8.64 | 7.7 | 1500 |
| RXJ2317.8–4422 | 2.87 | 6.53 | 7.51 | 7.28 | 1010 |
| MS23409–1511 | 2.03 | 7 | 8.8 | 7.55 | 1031 |
4.1 Eddington ratio
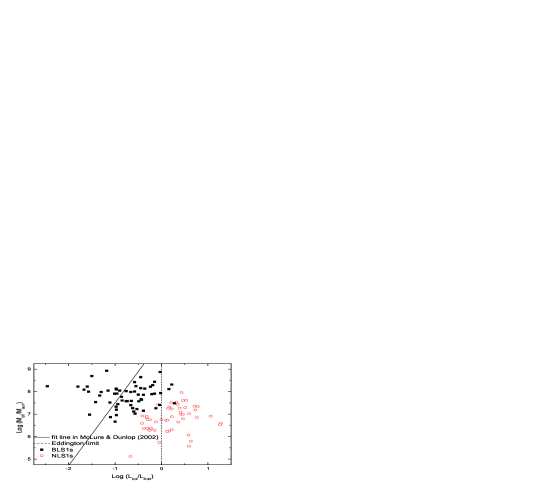
For all AGNs in the sample of Grupe et al. (2004) the black hole virial masses derived from H are firstly calculated. We also calculated the bolometric luminosity as a fraction of the Eddington luminosity, . Here the bolometric luminosity is from the Table 3 in Grupe et al. (2004), which is estimated from a combined powerlaw model fit with exponential cutoff to the optical/UV data and a power law with neutral absorption to the soft X-ray data (See Fig. 2 in Grupe et al. (2004)). The bolometric luminosities given in Grupe et al. (2004) are only approximate, because the EUV part of the spectral energy distribution of AGN is unobservable and therefore uncertain (e.g. Elvis et al. 1994). is derived from the virial mass via H linewidth. We simply defined the super-Eddington accretion as . From Fig. 1 we found that for most of NLS1s is larger than one and for most of BLS1s is less than one (also see Fig. 12a and 13a in Grupe 2004). The mean value of for 50 NLS1s is with a standard deviation of 0.44 and for 60 BLS1s it is with a standard deviation of 0.54. Wang & Netzer (2003) found that for the sample of Verron-Cetty et al. (2001) the mean value of is 0.08. The results from these two samples on NLS1s are consistent. Most of NLS1s are in the super-Eddington accretion state while BLS1s are not. The solid line in Fig. 1 is the best-fit relation for 72 objects found by McLure & Dunlop (2002). Although BLS1s seemed to follow the relation found by McLure & Dunlop (2002), it is obvious that NLS1s deviated from this relation, which confirmed our previous results on a small sample of NLS1s (Bian & Zhao 2003a). Because the distribution of the luminosities of BLS1s and NLS1s are very similar (Grupe et al. 2004), NLS1s have to accrete at higher Eddington ratios for their smaller black hole masses than BLS1s.
4.2 Black hole masses
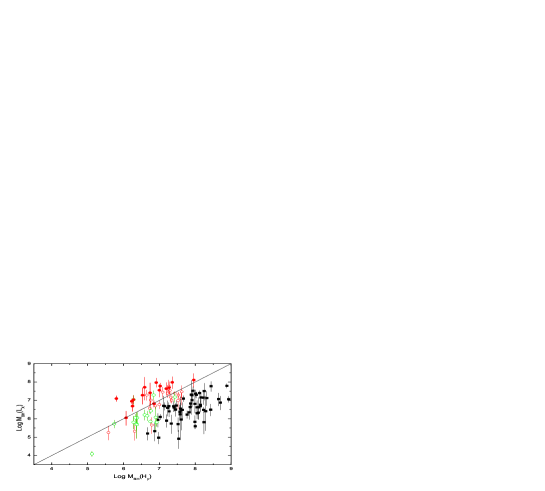
Apart from using equations (2)-(3) to calculate the black hole masses in AGNs, we also used equation (1) to calculate the masses in AGNs with super-Eddington accretion. In order to do a contrast, we also used equation (1) to calculate the mass of AGNs with sub-Eddington accretion in the sample of Grupe et al. (2004). The soft X-ray flux, the spectral index () and its error are from Grupe et al. (2001). We calculated the soft X-ray integrated luminosity in 0.2-2.0keV using the flux and the redshift. Using the spectral index and the soft X-ray integrated luminosity, we calculated the monochromatic luminosity at 0.1keV as the luminosity at the flat part of bump, which would give the black hole mass from equation (1). Here we considered the error of the spectral index to calculate the error of the luminosity at 0.1keV and then the error of mass using equation (1). The mean error in NLs1s is about 0.4 dex. In Fig. 2 we plotted the mass derived from the soft X-ray luminosity versus that from H linewidth for NLS1s and BLS1s in the sample of Grupe et al. (2004). The solid line in Fig. 2 means that these two masses are equal. From Fig. 2, we found that for all BLS1s the mass from H width is completely larger than that from X-ray luminosity while for NLS1s these two mass are consistent. The distribution of for 50 NLS1s is with a standard deviation of 0.61. The distribution of for 60 BLS1s is with a standard deviation of 0.78. Therefore the masses in NLS1s can be reliably derived from soft X-ray luminosity for their super-Eddington accretion. For BLS1s it is not the case and the soft X-ray luminosity can’t derive black hole masses in BLS1s. The consistency of and showed that these two methods are available to estimate the mass in NLS1s. Bian & Zhao (2004) found that and (mass from [O III] linewidth) are not consistent for the sample of NLS1s in SDSS (Willams 2003). Here we also found that it is the same to the sample of Grupe et al. (2004), which is consistent with the recent result from Grupe & Mathur (2004). This deviation of and is nothing else than the deviation of NLS1s from the M- relation. Therefore, compared with and , is not reliable in NLS1s. The [O III] linewidth or is not a good indicator for black hole masses in NLS1s. This supported the idea that NLS1s are in the early evolution stage of AGNs since the black hole is just growing in some ways.
The uncertainties of the virial mass from the H linewidth have been discussed by many authors (Krolik 2001; Wang & Lu 2001; Bian & Zhao 2003b). The error in this kind of mass estimate is about 0.5 dex (Wang & Lu 2001). The standard deviation of in all 50 NLS1s is 0.61, which is possibly from the error in the mass estimate from H linewidth or from . The mass obtained from soft X-ray luminosity is based on the assumption that soft hump spectrum is . Moreover, the reliability in the mass estimate from X-ray luminosity depended on whether NLS1s are in the super-Eddington accretion process or not. There are some NLS1s with sub-Eddington accretion (see Fig. 1). When we excluded the NLS1s with sub-Eddington accretion, the distribution of is with a standard deviation of 0.57.
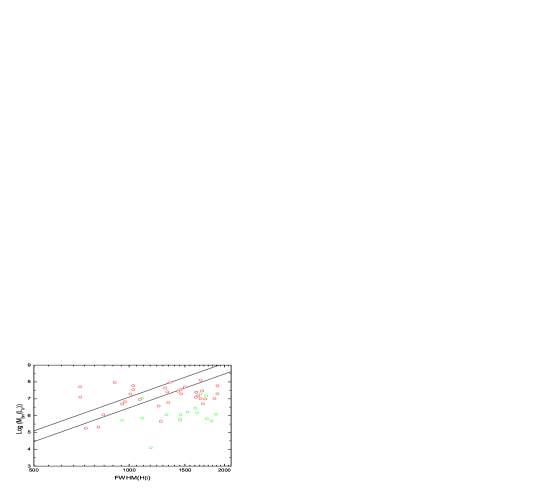
As mentioned above, we simply defined the super-Eddington accretion as . Wang (2004) suggested a Eddington limit relation for the super-Eddington accretion in a hybrid structure of photon trapping and photon bubble instability. The relation is
| (5) |
which is showed in Fig. 3. This relation is based on the detail calculations of emergent spectrum from slim disk (Wang et al 1999). Thus it is independent to the estimation of black hole mass from soft X-ray excess. Using this limit there are 16 AGNs with super-Eddington accretion (see Table 1). Not all NLS1s satisfied with are satisfied with the relation defined in above equation (5). The distribution of for these 16 NLS1s is with a standard deviation of 0.38. The masses from X-ray luminosity for these 16 NLS1s are all systematically larger than that derived from H linewidth.
4.3 Inclinations
The virial black hole mass derived from H linewidth and the BLRs size provides a simple method to calculate the disk inclination to the line of sight when we have other independent methods to obtain the black hole mass (Wu & Han 2001; Bian & Zhao 2002; Cao 2004; Bian 2004).
For the soft X-ray selected NLS1s, polarimetry measurements of Grupe et al. (1998) supported a pole-on orientation (e.g. Boller et al. 1996). However, observations of NLS1s showing strong optical reddening/polarization and X-ray absorption suggested the higher inclination (Goodrich 1989; Wills et al. 1992; Smith et al. 2004; Grupe et al. 2004), which is against the pole-on orientation model of NLS1s .
From Fig. 2 and Fig. 3, we found that 16 NLS1s satisfied with the Eddington limit relation defined by equation (5) (Wang 2004) are all satisfied with except Mrk 766. We also noticed that the masses from X-ray luminosity for these 16 NLS1s are all systematically larger than that derived from H linewidth. If we assume that the masses from X-ray luminosity in these 16 NLS1s with super-Eddington accretion are correct, the mass ratio between the virial mass from H linewidth to that from X-ray luminosity can be approximated by (Wu & Han 2001; Bian & Zhao 2002), where is the disk inclination to the line of sight. The mean value of for these 16 NLS1s, , suggested that the mean value of is about , which provided new support for the pole-on orientation effect in NLS1s.
Bian & Zhao (2003a) suggested that the mass ratio of black hole to the bulge in NLS1s () is an order of magnitude lower than that in BLS1s. Considering the possibility of smaller inclination in NLS1s, we need do a careful work on their bulges to clarify this suggestion. Bian & Zhao (2004) used the widths of H line and [O III] lines to investigate the black hole - bulge relation in radio-loud AGNs, radio-quiet AGNs and NLS1s. Bian & Zhao (2004) found NLS1s deviated from the relation and suggested that the deviation of NLS1s may be due to the small inclination of BLRs to the line of sight or the reliability of the [O III] linewidth as the indicator of stellar velocity dispersion because of its complex multiple components. Here we found that the mean inclination is about for 16 NLS1s with super-Eddington accretion defined equation (5). The smaller inclination can partly explain the difference of () between NLS1s and BLS1s. The smaller inclination can also partly explain why NLS1s can’t follow the defined inactive galaxies. Recently Wu et al. (2004) suggested a method to estimate the black hole mass using the H line luminosity instead of optical continuum luminosity. They showed that this method is better especially for radio-loud AGNs. Although it is usually believed that most NLS1s are radio-quiet AGNs, some cases of radio-loud NLS1s are reported (e.g. Zhou 2003). It is necessary to use this method to estimate the mass of NLS1s, which would be helpful to understand the physical property of NLS1s. In order to clarify all these questions, it is urgent to measure the bulge velocity dispersion in NLS1s. Botte et al. (2004) recently suggested that NLS1s follow the same relation as BLS1s, but still deviate from relation defined in the equation (4). Here we should notice that the bulge luminosity given by Botte et al. (2004) is from total host luminosity corrected by the Hubble type. It is necessary to do a two-dimension decomposition of NLS1s host images.
5 Conclusion
Different methods are used to estimate the black hole masses in a sample of NLS1s and BLS1s (Grupe et al. 2004). The main conclusions can be summarized as follows:
-
•
The mass from the soft X-ray bump luminosity is consistent with that from the H linewidth for NLS1s. Most of NLS1s are in the super-Eddington accretion state considering . The black hole masses of NLS1s from the H linewidth and from soft X-ray luminosity are reliable while that from [O III] linewidth are not reliable.
-
•
The mean disk inclination to the line of sight in 16 NLS1s satisfied with equation (5) is about , which provided new support for the pole-on orientation effect in NLS1s.
Acknowledgments
J.-M. Wang is greatly acknowledged for careful reading the manuscript and the idea inputs in this paper. We thank the anonymous referee for valuable comments. This work has been supported by the NSFC (No. 10273007; No. 10273011) and NSF from Jiangsu Provincial Education Department (No. 03KJB160060).
References
- [] Bian W., Zhao Y., 2002, A&A, 395, 465
- [] Bian W., Zhao Y., 2003a, PASJ, 55, 143
- [] Bian W., Zhao Y., 2003b, MNRAS, 343, 164
- [] Bian W, Zhao Y. 2003c, ApJ, 591, 733
- [] Bian W., Zhao Y., 2004, MNRAS, 347, 607
- [] Bian W. 2004, Chinese J. Astron. Astrophys., accepted
- [] Boller T., Brandt W.N., Fink H.H., 1996, A&A, 305, 53
- [] Boroson T. A., 2002, ApJ, 565, 78
- [] Boroson T. A., 2003, ApJ, 585, 647
- [] Botte V. et al. 2004, AJ, in press, astro-ph/0402627
- [] Cao X., 2004, ApJ, in press, astro-ph/0403298
- [] Czerny B, et al. 2001, MNRAS, 325, 865
- [] Cheng L., Wei J., Zhao Y., 2002, Chinese J. Astron. Astrophys., 2, 207
- [] Elvis M., Fiore F., Wilkes B.J., McDowell J., 1994, ApJ, 422, 60
- [] Goodrich R. W., 1989, ApJ, 342, 224
- [] Grupe D., 1996, PhD Thesis, University Gottingen
- [] Grupe D., Wills B. J., Wills D., Beuermann, K ., 1998, A&A, 333, 827
- [] Grupe D., et al. 1999, A&A, 305, 805
- [] Grupe D., Thomas H.-C., Beuermann K., 2001, A&A, 367, 470
- [] Grupe D., Wills B. J., Leighly K. M., Meusinger H., 2004, AJ, 127, 156
- [] Grupe D., Mathur S., 2004, ApJL, in press, astro-ph/0312390
- [] Grupe D., 2004, AJ, in press (astro-ph/0401167)
- [] Grupe D., Mathur S., 2004, AJ, in press, astro-ph/0402268
- [] Ho L.C., 1998, In “Observational Evidence for Black Holes in the Universe”, ed. S.K. Chakrabarti (Dordrecht: Kluwer) P157 (9803307)
- [] Kaspi S., Smith P.S., Netzer H., Maoz D., Jannuzi B.T., Giveon U., 2000, ApJ, 533, 631
- [] Krolik J.H., 2001, ApJ, 555, 72
- [] Laor A., Fiore F., Elvis M., Wilkes B. J., McDowell J. C. 1997, ApJ, 477, 93
- [] Leighly K. M., 1999, ApJS, 125, 297
- [] Lu Y. J., Yu Q. J., 2003, ApJ, astro-ph/0311405
- [] Mathur S., et al. 2001, New Astr., 6, 321
- [] Mathur S., 2000, MNRAS, 314, L17
- [] McLure R. J., Dunlop J. S., 2001, MNRAS, 327, 199
- [] McLure R. J., Dunlop J. S., 2002, MNRAS, 331, 795
- [] Mineshige S., Kawaguchi T., Takeuchi M., Hayashida K., 2000, PASJ, 52, 499
- [] Nelson C. H., 2000, ApJ, 544, L91
- [] Ohsuga K., Mineshige S., Mori M., Umemura M., 2002, ApJ, 574, 315
- [] Osterbrock D. E., Pogge, R, 1985, ApJ, 297, 166
- [] Peterson B. M., et al. ApJ, 542, 161
- [] Pounds K. A., Done C., Osborne, 1995, MNRAS, 277, L5
- [] Shemmer O. & Netzer H., 2000, astro-ph/0005163
- [] Shields G. A., et al., 2003, ApJ, 583, 124
- [] Smith J.E., Robinson A., Alexander D.M., Young S., Axon D.J., Corbett E.A., 2004, MNRAS, accepted, astro-ph/0401496
- [] Sulentic J. W., et al. 2000, ApJ, 536, L5
- [] Tremaine S., et al., 2002, ApJ, 574, 740
- [] Veron-Cetty M.-P., Veron, P., Goncalves A. C., 2001, A&A, 372, 730
- [] Vestergaard M., 2002, ApJ, 571, 733
- [] Wandel A., Peterson B.M., Malkan M.A., 1999, ApJ, 526,579
- [] Wandel A., 2002, ApJ, 565: 762
- [] Wang J. M., Zhou Y. Y., 1999, ApJ, 516, 420
- [] Wang J. M., Szuszkiewicz E., Lu F. J., Zhou Y. Y., 1999, ApJ, 522, 839
- [] Wang J. M., Netzer H., 2003, A&A, 398, 927
- [] Wang J. M., 2004, AJ, 125, 2859
- [] Wang T. G., Lu Y. J., 2001, A&A, 377,52
- [] Willams R.J., Pogge R.W., Mathur S., 2003, AJ, 124, 3042
- [] Wills B.J., Wills D., Evans N.J., Natta A., Thompson K.L., Breger M., Sitko M.L., 1992, ApJ, 400, 96
- [] Wu X., Han J., 2001, ApJ, 561, L59
- [] Wu X., et al., 2004, A&A, in prees, astro-ph/0403243
- [] Zhou H. Y., et al. 2003, ApJ, 584, 147