A Mushroom-shaped Structure from the Impact of a Cloud with the Galactic Disk
We propose that the mushroom-shaped structure of the Galactic worm GW 123.4–1.5 is created by a cloud collision with the Galactic gas disk. A hydrodynamic simulation shows that a mushroom-shaped structure is created after the cloud crosses the Galactic midplane. The lifetime of the mushroom-shaped structure is of order the dynamical time scale of the disk, years. We find that the velocities across the cap of the mushroom-shaped structure in the simulation are consistent with the observed values. The simulation also predicts a structure on the opposite side of the Galactic plane which is created by the Kelvin-Helmholtz instability after the cloud passes through the disk.
Key Words.:
Galaxy: structure – ISM: clouds – ISM: individual (GW 123.4–1.5) – ISM: structure1 Introduction
The Canadian Galactic Plane Survey (Taylor et al. 2003) revealed that the Galactic worm candidate GW 123.4–1.5 was an unusual mushroom-shaped cloud (English et al. 2000). It is hundreds of parsecs in size and unrelated to conventional shell or chimney structure. The mass of the cap is about 4 times greater than that of the stem, and the total mass is estimated to be about , although such an estimate depends strongly on the distance in which there is some ambiguity. A position-velocity map in the upper portion of the cap shows no velocity gradient. However, the lower portion of the two lobes of the cap that extend back toward the Galactic plane are blueshifted with respect to the central cap region by 5 km/s.
One possible origin for the mushroom-shaped cloud is the rise of buoyant gas. This model was studied by English et al. (2000), in the form of a supernova event, and Avillez & Mac Low (2001), in the form of bubbles rising from hot gas reservoirs. They showed that a mushroom-shaped cloud was created by the sweeping effect of the buoyant bubble when the bubble rises from the Galactic plane. The gas swept up by the bubble cooled down and increased in density.
In this paper, we propose another possible origin of the mushroom-shaped structure: a cloud collision with the Galactic disk. This scenario was first studied by Tenorio-Tagle et al. (1986, 1987). However, no one has yet performed a simulation demonstrating that a cloud impact would generate the mushroom-shaped structure like GW 123.4–15.
2 The modeling of a gas collision with the galactic disk
We perform a hydrodynamic numerical simulation. As a first step, we simply assume adiabatic gas and axial symmetry. We model a local region of the Galaxy and use the axially symmetric cylindrical coordinate , where represents the distance from the axis and the vertical distance from the midplane of the Galaxy.
According to observations, the vertical gravitational field of the Galaxy is near the midplane, where for the solar neighborhood (Spitzer 1978; Bahcall 1984; Tenorio-Tagle et al. 1987). The hydrostatic equilibrium density of the interstellar isothermal gas near the midplane is,
| (1) |
where is the density at the midplane. In equation (1), the scale length is
| (2) |
where is the specific heat ratio, assumed to be , and is the sound speed at the midplane. Since the gravitational field of the Galaxy gradually tends to be constant when is large, we simply let
| (3) |
which tends to when and to when . We take in the simulation. Some calculations were done by using larger values of , but the results were not sensitive to it.
We also assume that the interstellar gas has two temperatures at the initial time so that
| (4) |
where is the temperature as a function of . The temperature at the midplane is the constant . It becomes another constant at with a transition length of . We take , and . Although observations currently indicate a multi-temperature galactic atmosphere (e.g., Lockman & Gehman 1991), a two temperature model of the Galactic disk is a first step that adds a level of sophistication beyond the isothermal atmospheres explored by Tenorio-Tagle et al. (1986; 1987).
As an initial condition of the Galactic plane, we assume a hydrostatic equilibrium of the gas determined by the gravity of equation (3) and the temperature of equation (4). When , the gravitational field is proportional to and the density has a Gaussian distribution like equation (1). There is a transition region of the density at due to the two temperature model of equation (4). Because the gravity tends to a constant where , the density structure finally tends to an exponential atmosphere at large . The hydrostatic equilibrium of the two temperature atmosphere makes a cold dense sheet which is sandwiched between hot gas layers. As we will see later, this dense sheet plays an important role in making a stem structure of the mushroom.
The density distribution in our simulation is not exactly the same as that shown by Dickey & Lockman (1990) who found that the -distribution of the disk density was approximated by a summation of two Gaussians which have different velocity dispersions. The distribution they found does not show a clear discontinuity in the temperature. However, their distribution is the average density along the line of sight. In this paper, we assume that the cold gas matter is compact and can be locally well separated from the warm gas. In addition to this, we assume that the cold gas is located in a sheet near the midplane of the disk. If the cold gas clouds along the line of sight have a distribution of heights about the midplane of the Galaxy, then a transition region of density or temperature would become unclear in the observations.
We also note that the temperatures ( and ) of the gas in this simulation are effective temperatures. Observations show that the scale height of the Galactic interstellar medium is much larger than the scale height that is estimated from the temperature of the gas. The effective temperature that makes the large scale height is considered to be caused by turbulent motions.
Into this equilibrium atmosphere, we introduce a cloud with density () and -component of velocity ():
| (5) |
| (6) |
where
| (7) |
and is the central position of the cloud on the axis. In equations (5) and (6), and are constants which parameterize the initial cloud density and the -component of the cloud initial velocity. The parameters and determine radii within the cloud for the density and velocity distributions respectively, and is a transition length. We use , , and . We let be a little larger than in order to avoid a velocity gradient within the dense cloud. (If we take , a part of the cloud near the edge moves slower than the center of the cloud.)
In this simulation, we take as a unit of length, as a unit of velocity and as a unit of density. If we use the value of for the solar neighborhood and km/s (which corresponds to K) as the turbulent velocity in the Galaxy, then pc. The unit of time is year. The important parameters in this simulation are the initial density of the cloud, , and the initial velocity of the cloud, . In this paper, we will show the result of , which means that the initial density of the cloud is the same as that of the cold dense sheet on the midplane of the Galaxy (e.g., cm-3). We will show two cases of the initial velocity; km/s and km/s. The former is the order of the line-of-site motion of a high-velocity cloud (Wakker & van Woerden 1997), and the latter corresponds to a intermediate-velocity cloud (Danly 1989; Kuntz & Danly 1996).
We use the CIP method (e.g., Yabe, Xiao & Utsumi 2001) to solve the finite difference equations of hydrodynamics. The minimum grid size is in both the and directions. In the -direction, we gradually increase the grid size where . The computational region is , . The outer boundary conditions are free boundaries for both the and directions.
3 Results
3.1 The case of km/s
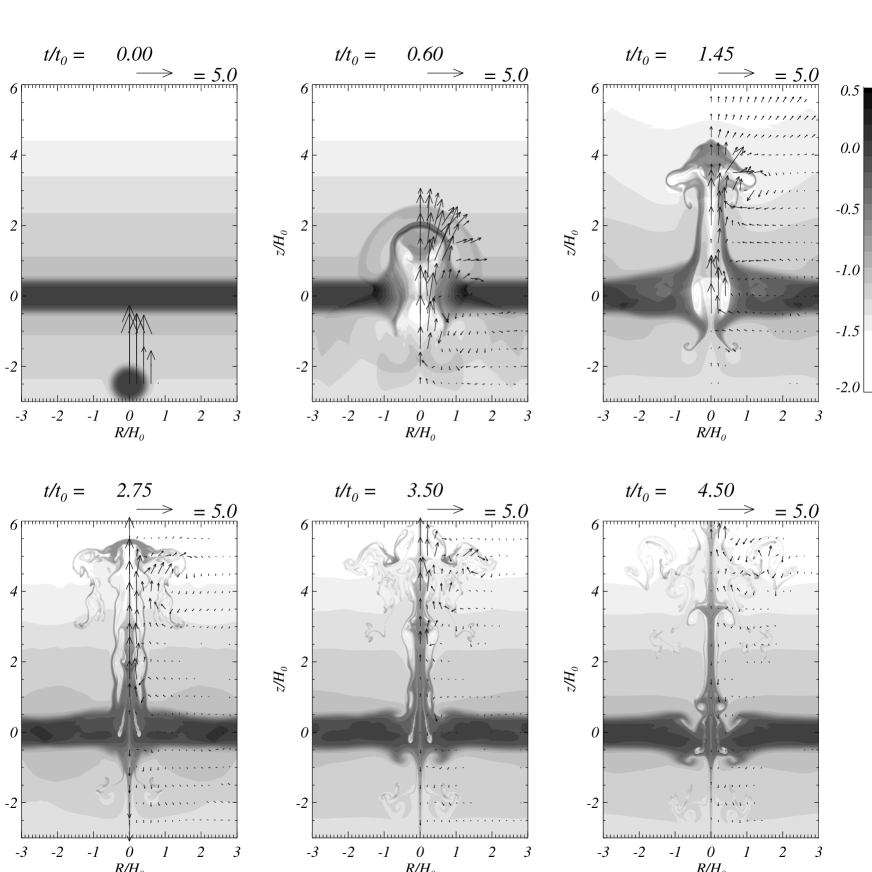
Figure 1 shows the time evolution of the density. The top-left panel shows the initial condition (). The initial atmosphere is hydrostatic equilibrium determined by equations (3) and (4). A gas cloud is input in the atmosphere according to the equations (5) and (6).
As the cloud impacts the midplane of the Galaxy, it goes through the dense sheet in the Galactic plane (). After that, the cloud is decelerated by gravity () and is broken by eddies of the hot gas flow generated behind the cloud after it passes through the disk (). The cloud broken by eddies forms a cap of a mushroom-shaped structure.
When the gas cloud passes though the Galactic plane, a part of the dense sheet in the Galactic plane goes along with the cloud and forms a shell-like structure (). This shell is elongated and forms the stem of the mushroom-shaped structure (). Moreover, when the hole that was made by the cloud passage is refilled with the gas on the plane, a flow appears near the axis (). This flow lifts a part of the dense gas in the Galactic plane, which also contributes to the stem (). These processes show the importance of the dense sheet in the Galactic atmosphere that results from our assumed transition in effective temperature. During this process, the stem is getting narrow (). The simulation also shows the development of small structures on the opposite side of the Galactic plane (). The two-sided eddies, evident at and in Figure 1 at , are created by the Kelvin-Helmholtz instability after the cloud passes through the disk (). Finally, the cap is diffused by eddies and becomes unclear (). The lifetime of the mushroom-shaped structure is the order of the dynamical time scale, year. The movie for the density clearly shows the time evolution.
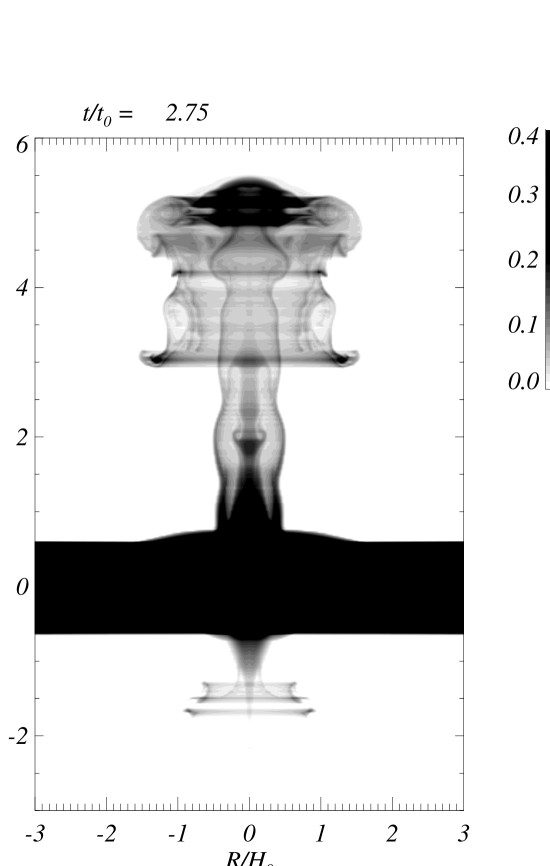
Figure 2 shows a snapshot of the column density at . Since this is an axially symmetric simulation, we can integrate the density perpendicular to the plane to get a column density. Here, we have integrated the low temperature gas () when we calculate the column density, in order to avoid including the gas which is surrounding the mushroom-shaped structure. Sampling the low temperature gas makes the mushroom-shaped structure clear to understand, though this is not exactly the same column density which is obtained by observations. The column density of low temperature gas has a clear stem and cap structure which resembles the mushroom-shaped structure of GW 123.4–15. (The movie for the column density also shows its time evolution.) The width ratio of the cap and stem at this snapshot is about 3:1, and the mass ratio is about 2.4:1. These results are consistent with a observational ratio of 3:1, and the mass ratio of 4:1. However, the maximum height of the mushroom at is about pc, which is greater than the mushroom-shaped structure of GW 123.4–15 though the scale depends on the ambiguous distance.
The column density in Figure 2 also shows a smaller structure on the opposite side of the Galactic plane (around ). This structure is created by the Kelvin-Helmholtz instability after the cloud passes through the disk. The lifetime of this structure is also year.

Another important comparison with observations is the velocity structure of the mushroom-shaped structure. The observational velocity, which is obtained by the Doppler shifts of neutral hydrogen, is considered to be sampling a component of -velocity if the mushroom-shaped structure is tilted relative to the line of sight. In order to show the velocity structure from our simulation, we calculate the averaged -component of the velocity along a line of sight perpendicular to the plane. The averaged velocity is calculated in the following manner:
| (8) |
where is the length along a line perpendicular to the plane. The integration was also done only for the cold gas in the same way that we get the column density. Figure 3 shows the averaged velocity across the cap. The top panel shows the velocity along , and the bottom along . At the lower portion of the cap (), the flow goes up near the axis but goes down near the edge of the cap, while all of the cap is gradually going up in the upper portion (). The velocity of the upper portion () is in between the maximum and minimum velocities of the lower portion of the cap. These velocity structures are consistent with Figures 1c and 1d of English et al. (2000).
3.2 The case of km/s
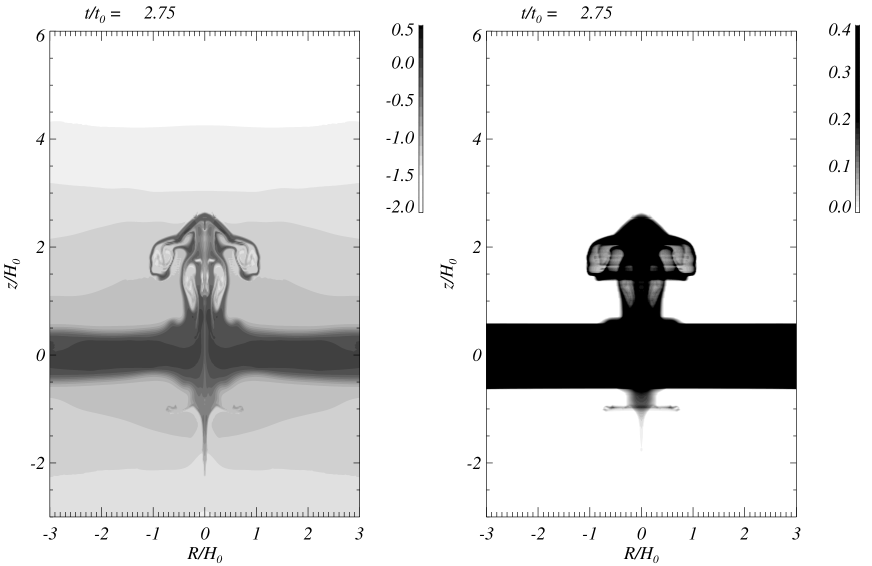
Here, we will show the case of km/s. The time evolution of the cloud is similar to the case of km/s. Figure 4 shows the snapshot of density and column density at . We can see the similar mushroom-shaped structure around , though the size of the mushroom is a little smaller than the case of km/s. The maximum height of the mushroom at is about pc, which is almost the same size as that of GW 123.4–15. The width ratio of the cap and stem is about 2:1 and the mass ratio is about 4:1, which also show good agreements of the observation.
Figure 5 shows that averaged velocity across the cap at . The top panel shows the velocity along , and the bottom along . The lower portion of the cap shows that the flow goes up near the axis but goes down near the edge of the cap, while the upper portion of the cap shows the flow goes up in wider region than that of the lower cap. This is also consistent with the observation. Movies of the density and column density for this model further illustrate the evolution.
3.3 Parameter study
We have performed a parameter study for the velocity () and density () of the impact cloud, as well as the specific heat ratio ().
When the velocity is ( km/s), the mushroom-shaped structure does not appear. The cloud does not reach enough height after it goes though the dense sheet, so that the cap and stem structure is not apparent (the cap is prominent, but the stem is not). Therefore, we need at least about 50 km/s to get a mushroom-shaped structure when the density of the cloud is the same order of that of the dense sheet on the Galactic plane.
If the density of the cloud is much less than that of the Galactic plane (), our simulations show that the cloud does not go through the plane even in the case of km/s. Therefore, the cloud density should be of the same order as that of the dense sheet of the Galactic plane unless the velocity of the cloud is extremely high.
In order to see the effect of cooling mechanisms (radiative cooling and/or dissipation of turbulence), we ran simulations with . Even for this small specific heat ratio, we had similar mushroom-shaped structures both for high and low velocity cases. Therefore, we think that the effect of cooling does not affect the basic result. However, we found some differences: (1) the impact cloud reaches a higher position (about 20% higher) than that of the adiabatic case after it goes through the dense sheet. (2) Both stem and cap become a little narrower (by about 10%) than those of the adiabatic case.

4 Discussion and Conclusion
Based on our simulations, we conclude that a cloud collision with the Galactic disk is one of the possible models of the mushroom-shaped structure, GW 123.4–1.5. The density and column density clearly show a cap and stem structure which resembles the observed structure for both cases of a high-velocity cloud ( km/s) and an intermediate-velocity cloud ( km/s). The case of km/s shows a better agreement with the size of the mushroom-shaped structure as well as the mass ratio of the cap and stem. It may mean that GW 123.4–1.5 is created by the collision of an intermediate-velocity cloud into the Galactic plane, though the stem in our simulation is a little thicker than that of the observation.
However, mushroom-shaped structures may not be commonly observed unless the densities of the impact cloud are comparable to the density of the Galactic plane and the frequency of the impacts is high. In order to get a mushroom-shaped structure, we found that the cloud density should be at least the same order as the disk density. Given a disk number density cm-3, the column density of the impact cloud is cm-2. Observations show that such large column densities are not common both for high-velocity clouds (Wakker & von Woerden 1997) and intermediate-velocity clouds (Benjamin & Danly 1997). Nevertheless, there are some exceptions, such as the Ursa Major intermediate-velocity cloud (Snowden et al. 1994; Benjamin et al. 1996) which has velocity km/s, column density cm-2, and estimated size ( pc) which implies a number density cm-3. The numerical simulations also show that the lifetime of the mushroom-shaped structure is only about a dynamical time, years. These results may be some of the reasons that only one mushroom-shaped structure has yet been found near the Galactic plane.
The cloud collision model in this paper is an alternative to the buoyant model. The velocity structures across the cap in this model are consistent with observations of GW 123.4–1.5, but it is not obvious that the buoyant model has a similar velocity structure. More detailed kinematical analysis of GW 123.4–1.5 would distinguish the two models. In addition to the velocity, the stem near the midplane of the Galaxy is clear in our model, while it is not clear in the buoyant model. Our model shows that the stem directly connects to the dense gas near the midplane of the Galaxy, which seems to be the same as the observation. Moreover, our model predicts small structures on the opposite side of the Galactic plane (in Figure 2 around , and in Figure 4 around ). These structures may not be significant in current observations, but may be an interesting target in the future in order to distinguish the two models.
We have assumed a Galactic atmosphere with two effective temperatures. The resulting dense sheet of gas near the midplane contributes to the formation of the stem of the mushroom-shaped structure. In our model, the stem originates from material lifted up from the dense sheet, while the cap is formed primarily by the breakup of the impact cloud. A dense stem is actually not clear in single-temperature models that we performed with the same initial impact clouds. A distinct transition between cold (weakly turbulent) and warm (highly turbulent) gases is not obvious from observations which measure the integrated gas along the line of sight. However, the mushroom-shaped structure we have obtained in our simulations may suggest that the cold gas clouds which are located near the midplane of the Galaxy are locally well separated from the warm gas.
Future work can improve upon this model by including a self-consistent treatment of turbulent pressure, and the effect of radiative cooling of the thermal gas. Moreover, the magnetic pressure is comparable to the effective turbulent pressure in the ISM, and a collision exactly perpendicular to the Galactic plane would be rare in a real situation. Three-dimensional simulations including the magnetic field, heating and cooling, and turbulent gas would be an ultimate work for the future in order to have more detailed comparison between the numerical simulations and observations.
Acknowledgements.
The authors acknowledge comments from and discussions with Jayanne English and Ashish Asgekar. The authors also wish to thank the anonymous referee for comments which substantially improved the paper. TK acknowledges support due to a Fellowship from the Canadian Galactic Plane Survey. TK also benefited from a Fellowship from SHARCNET, a high-performance computing project funded by ORDCF and CFI/OIT. SB was supported by an individual research grant from NSERC. Numerical computations were carried out mainly on the VPP5000 at the Astronomical Data Analysis Center in the National Astronomical Observatory of Japan.References
- (1) Avillez, M. A., & Mac Low, M.-M. 2001, ApJ, 551, L57
- (2) Bahcall, J. N. 1984, ApJ, 276, 169
- (3) Benjamin, R. A., Venn, K. A., Hiltgen, D. D., & Sneden, C., 1996, ApJ, 464, 836
- (4) Benjamin, R. A., Danly, L. 1997, ApJ, 481, 764
- (5) Danly, L. 1989, ApJ, 342, 785
- (6) Dickey, J. M., & Lockman, F. J. 1990, ARA&A, 28, 215
- (7) English, J., Taylor, A. R., Mashchenko, S. Y., Irwin, J., Basu, S., & Johnstone D. 2000, ApJ, 533, L25
- (8) Kuntz, K. D., Danly, L. 1996, ApJ, 457, 703
- (9) Lockman, F. J., Gehman, C. S. 1991, ApJ, 382, 182
- (10) Snowden, S. L., Hasinger, G., Jahoda, K., Lockman, F. J., McCammon, D., & Sanders, W. T. 1994, ApJ, 430, 601
- (11) Spitzer, L., Jr. 1978, Physical Processes in the Interstellar Medium, New York, Wiley and Sons
- (12) Taylor, A. R. et al. 2003, AJ, 125, 3145
- (13) Tenorio-Tagle, G., Bodenheimer, P., Rozyczka M., & Franco, J. 1986, A&A, 170, 107
- (14) Tenorio-Tagle, G., Franco, J., Bodenheimer, P., & Rozyczka M. 1987, A&A, 179, 219
- (15) Wakker, B. P., & van Woerden, H. 1997, ARA&A, 35, 217
- (16) Yabe, T., Xiao, F., & Utsumi, T. 2001, J. Comput. Phys., 169, 556