Obscured star formation in the central region of the dwarf galaxy NGC 5253111Based on observations with the NASA/ESA Hubble Space Telescope, obtained at the Space Telescope Science Institute, which is operated by the Association of Universities for Research in Astronomy, Inc. under NASA contract No. NAS5-26555.
Abstract
We present HST/NICMOS observations (m) and m spectroscopy of the central region of the dwarf galaxy NGC 5253. The HST/NICMOS observations reveal the presence of a nuclear double star cluster separated by or pc (for a distance Mpc). The double star cluster, also a bright double source of Pa emission, appears to be coincident with the double radio nebula detected at 1.3 cm. The eastern near-infrared star cluster (C1) is identified with the youngest optical cluster, whereas the western star cluster (C2), although it is almost completely obscured in the optical, becomes the brightest star cluster in the central region of NGC 5253 at wavelengths longer than m. Both clusters are extremely young with ages of approximately 3.5 million years old. C2 is more massive than C1 by a factor of 6 to 20 (, for a Salpeter IMF in the mass range ). Analysis of the circumnuclear spectrum excluding C1 and C2, as well as of a number of other near-infrared selected clusters with a range of (young) ages, suggests that the star formation was triggered across the central regions of the galaxy. We have also modelled the nuclear UV to mid-infrared spectral energy distribution (SED) of NGC 5253 and found that the infrared part is well modelled with a highly obscured (mag) young starburst with a stellar mass consistent with our photometric estimates for C1 and C2. The SED model predicts a moderately bright polycyclic aromatic hydrocarbon (PAH) feature at m that is not detected in our nuclear -band spectrum. NGC 5253’s low metallicity and a top-heavy IMF likely combine to suppress the PAH emission that is commonly seen in more massive starburst systems.
1 Introduction
It has long been recognized that the starburst occurring in the central region of NGC 5253 must be among the youngest in the local Universe, and that this star forming process may be the first to have occurred in this galaxy in the last yr (van den Bergh 1980; Moorwood & Glass 1982; Rieke, Lebofsky, & Walker 1988). NGC 5253 appears to have been a metal poor dwarf elliptical before the current burst of star formation, and after the current burst of star formation it may evolve back to a dwarf elliptical galaxy with a bright core such as those in the Virgo and Fornax clusters (Caldwell & Phillips 1989).
One of the longstanding questions is the triggering mechanism for the central starburst of NGC 5253. It has been suggested that the nuclear burst of star formation was triggered as the result of an interaction with the neighboring galaxy M83 (van den Bergh 1980; Caldwell & Phillips 1989). Recently Meier, Turner, & Beck (2002) have found that only the giant molecular cloud in the dust lane intersecting the galaxy, among the five detected in CO(2-1), is sufficiently nearby to be associated with the central starburst. More interestingly, these authors have shown that gas is falling into the nucleus of this galaxy, suggesting that this may be the mechanism for fuelling the starburst.
Evidence for an extremely young and powerful burst of star formation in the central region of NGC 5253 comes from different observational clues. The nuclear radio and millimeter continuum emission are almost entirely due to thermal emission from H ii regions (Beck et al. 1996; Mohan, Anantharamaiah, & Goss 2001; Meier et al. 2002). Both the detection of Wolf-Rayet optical features (Walsh & Roy 1987; Conti 1991) and the high stellar temperature ( K), inferred from the near-infrared He i(m)/Br10 line ratio (Vanzi & Rieke 1997) and mid-infrared emission lines (Beck et al. 1996; Crowther et al. 1999; Thornley et al. 2000), can only be explained with the presence of massive stars (IMF extending to at least , see Rigby & Rieke 2004). Finally Cowan & Branch (1982) searched for two historical supernovae in this galaxy using the VLA, and did not detect them, or any other radio supernovae, indicating that the burst must be very young. The star formation appears to be occurring in a relatively small region of the galaxy on the observed H emission (Calzetti et al. 1997) and the compact mid-infrared emission of this galaxy (Rieke 1976). Thus, NGC 5253 offers us an ideal opportunity to study the early stages of extragalactic star formation in the relatively confined nuclear region of this galaxy.
Throughout the paper we assume a distance to NGC 5253 of Mpc (Sandage et al. 1994).
2 Observations
2.1 HST/NICMOS Near-Infrared Imaging
HST/NICMOS observations of NGC 5253 were obtained in January 1998 using the NIC2 camera, with a pixel size of 0.076″ pixel-1. The filters used were F110W, F160W and F222M, roughly equivalent to ground-based filters , and respectively. In addition, narrow band observations through the F187N and F190N filters, covering the Pa (m)+ continuum and m continuum, respectively, were obtained.
The raw images were reduced with routines from the package NicRed (McLeod 1997). The main steps in the data reduction involve subtraction of the first readout, dark current subtraction on a readout-by-readout basis, correction for linearity and cosmic ray rejection (using FULLFIT), and flat fielding. The flux calibration was performed using the conversion factors derived from measurements of the standard star P330-E during the Servicing Mission Observatory Verification (SMOV) program (Marcia Rieke, private communication 1999).
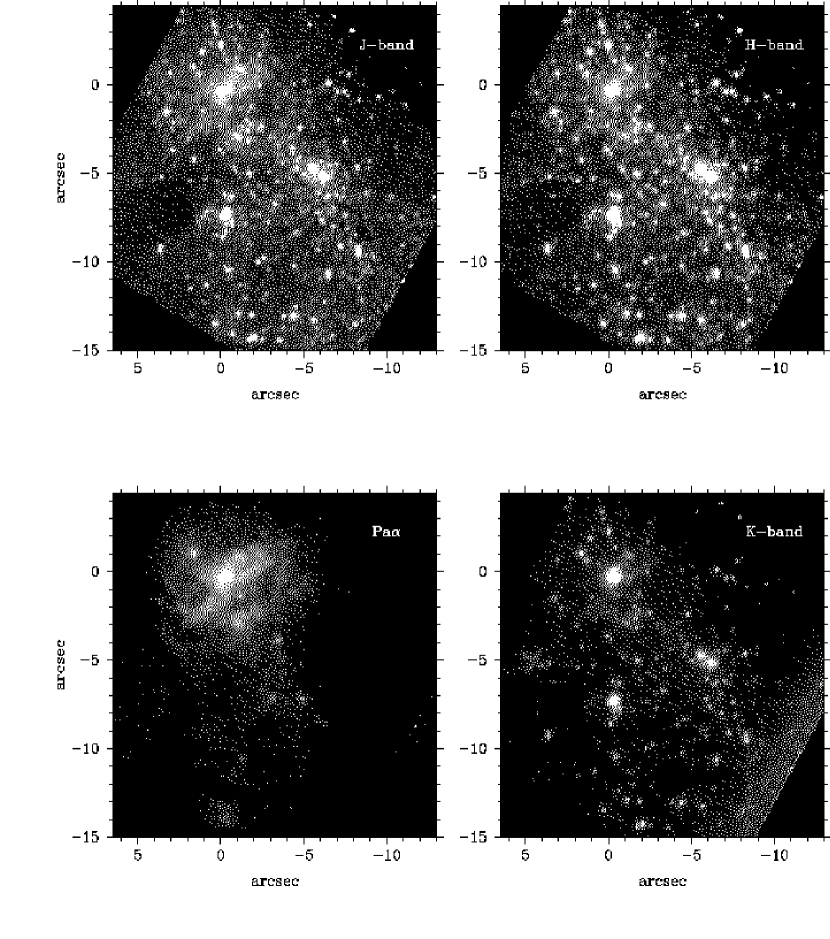
NICMOS only provides continuum bands to the red of the emission lines. The extinction in the nuclear region of NGC 5253 is known to be very high (even at infrared wavelengths; e.g., Turner et al. 2003 and references therein), and a straight subtraction of the longer wavelength continuum image may result in an overcorrection of the continuum at the wavelength of the emission line. We fit the continuum between m and m (using the NIC2 F160W and NIC2 F190N line-free images) on a pixel-by-pixel basis, and interpolate to estimate the continuum at m. This interpolated continuum is then subtracted from the line+continuum image to produce the continuum subtracted Pa image. The fully-reduced images were rotated to the usual orientation with north up, east to the left. They are shown in Fig. 1. In addition, we constructed infrared color maps equivalent to ground-based (F110W - F160W) and (F160W - F222M) color maps.
2.2 IRTF/Spex Near-Infrared and -band Spectroscopy
We have obtained simultaneous intermediate resolution (m) and band (m) spectroscopy of the central region of NGC 5253 using Spex (Rayner et al. 2003) at the 3 m NASA IRTF telescope on Mauna Kea in March 2003. We used the 0.15″ pixel -1 plate scale and a slit width of 1.6″ which provided a spectral resolution of in the -band. The slit was oriented approximately North-South to cover the nucleus (C1+C2, Section 3.1, Fig. 2) of NGC 5253 plus the bright star cluster C3+C3’ to the southwest of the nucleus (see Table 1 and Fig. 2). The C4+C5 cluster (see Fig. 2) was sufficiently bright and pointlike at the guider resolution that we could use it for the tip-tilt capability, thus improving the spatial sampling of the data. The total on-source integration time was 30 minutes. The seeing conditions as measured from standard star observations were approximately (FWHM) in the -band. We also obtained spectroscopy of two comparison galaxies Henize 2-10 and NGC 2903 in a similar fashion. Observations of solar-type stars were interspersed with the galaxy observations selected to be at similar air masses, and used to perform the telluric correction.
We used the data reduction package SpexTool (Cushing, Vacca, & Rayner 2004) especially developed to reduce Spex data. Briefly, we created calibration frames (flatfields and arcs), median combined the galaxy observations, flatfielded the data, extracted 1D spectra, and performed the wavelength calibration using sky lines and arcs. The 1-D spectra of the nuclear region of NGC 5253 were extracted with apertures: and . We also extracted a -band spectrum of the C3+C3’ cluster through a aperture.
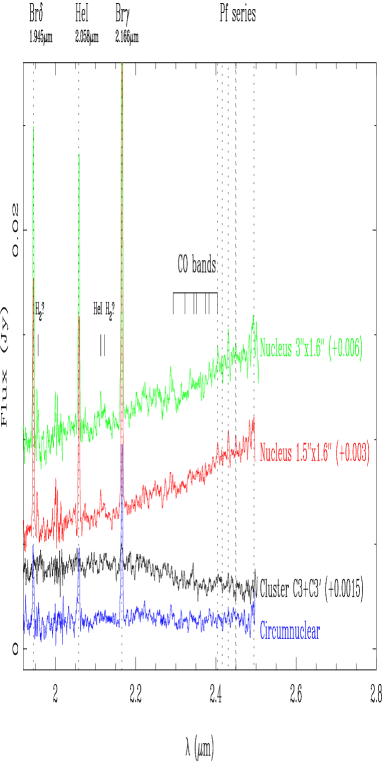
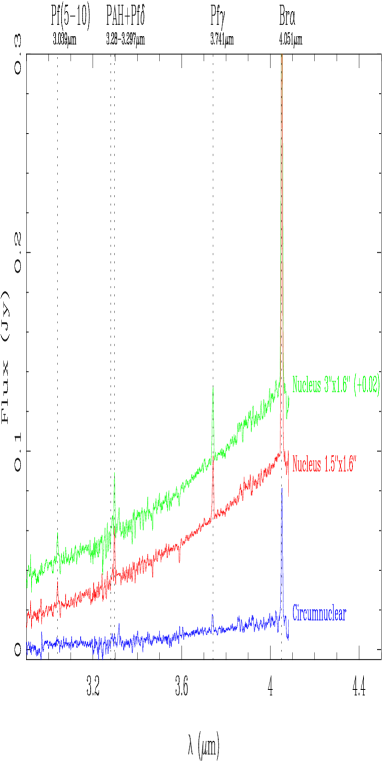
Standard stars at a similar airmass observed before and after the galaxy were reduced in a similar fashion and used to perform the correction of the galaxy spectra for atmospheric transmission. The flux calibration of the galaxy spectra was obtained from the observations of the standard stars. We compared the Spex -band continuum level with the flux measured in the NIC2 F222M images through the same extraction apertures and found that they agree to within 10%. The fully reduced Spex spectra corrected for the standard star blackbody temperature, flux-calibrated and shifted to rest frame wavelengths are shown in Fig. 3. Line fluxes and equivalent widths (EW) for the main emission lines are given in Table 2.
2.3 HST/WFPC2 UV and Optical Imaging
Fully reduced HST/WFPC2 images of NGC 5253 through the F255W, F547M and F814W filters (Calzetti et al. 1997) were retrieved from the HST archive. These observations placed the central part of the galaxy on the WP3 chip providing a plate scale of pixel-1. In addition we retrieved images through the F555W and F814W filters where the galaxy was centered on the WP1 chip providing higher spatial resolution. Because the [O iii]5007Å emission line in the central region of NGC 5253 is bright (e.g., González-Riestra, Rego, & Zamorano 1987), we expect it to have a large contribution to the photometry through the F555W filter. We thus use the F555W image for comparing the optical and near-infrared morphologies, but not for star cluster photometry.
2.4 ISO/ISOCAM Mid-Infrared Imaging
We obtained fully reduced ISO/ISOCAM images of NGC 5253 observed through five filters: LW1 (m), LW2 (m), LW6 (m), LW10 (m), and LW9 (m). The pixel size is 1.5″ pixel-1, which provides a field of view of .
| Cluster | Possible ID | |||||||
|---|---|---|---|---|---|---|---|---|
| () | () | (Å) | ||||||
| Central Double Cluster | ||||||||
| C2 | 0.0 | 0.0 | Dominant 1.3cm source | |||||
| C1 | 0.3E | S | NGC5253-5, UV-12, Harris1 | |||||
| Secondary 1.3cm source | ||||||||
| Other Bright Clusters | ||||||||
| C3∗ | 0.1E | S | NGC5253-1, UV-2, Harris2 | |||||
| C3’∗ | 0.3E | S | ||||||
| C3+C3’ | 0.1E | 7.1S | (0.3W,7.0S) | |||||
| C4 | 5.7W | S | NGC5253-3, UV-4, Harris3 | |||||
| C5 | 5.1W | S | NGC5253-2, Harris5 | |||||
| C6 | 0.4E | 2.5N | Harris32 | |||||
| C7 | 1.6W | 13.9S | Harris27 | |||||
| C8 | 7.9W | 9.2S | NGC5253-6?, Harris9 | |||||
| C9 | 1.3W | 4.8S | ||||||
| C10 | 4.0W | 12.8S | ||||||
| C11 | 6.1W | 10.3S | ||||||
| C12 | 7.8W | 9.0S | NGC5253-6? | |||||
Note. — and are the measured offsets in arcseconds relative to the position of C2. The magnitudes, colors, and EWs are measured through a -diameter aperture (except for C3+C3’, see below), and are not corrected for extinction. The column ’ID’ indicates possible correspondences with sources detected at other wavelengths. “NGC5253-1, NGC5253-2, NGC5253-3, NGC5253-5, and NGC5253-6” are optical star clusters from Calzetti et al. 1997. “UV-2, UV-4 and UV-12” are UV clusters identified by Meurer et al. 1995. Also listed are correspondences with clusters reported by Harris et al. (2004). The 1.3cm radio sources are from Turner et al. 2000. The near-infrared hot spots in Davies et al. 1998 are named after the offsets quoted in their paper relative to the nucleus, where (0.3W,7.0S) corresponds to C3+C3’ and (5.8W,4.6S) to C4+C5.
∗The C3 and C3’ clusters are severely blended and thus the colors and magnitudes are strongly affected by deconvolution errors. We give magnitudes and colors for C3+C3’ through a -diameter aperture.
| Line | Aperture | Flux | EW | |
|---|---|---|---|---|
| (m) | (erg cm-2 s-1) | (Å) | ||
| Pa | 1.877 | |||
| Br | 1.945 | 177 | ||
| 146 | ||||
| Hei | 2.058 | 113 | ||
| 116 | ||||
| Br | 2.166 | 255 | ||
| 250 | ||||
| circumnuclear | 216 | |||
| cluster C3+C3’ | ||||
| Pf | 3.741 | 32 | ||
| 37 | ||||
| Br | 4.051 | 205 | ||
| 235 |
Note. — Pa measurements are from the narrow-band HST/NICMOS imaging data. Other measurements are from the IRTF Spex spectroscopy.
3 Photometry
3.1 -band selected star clusters
We choose to identify the star clusters in the central region of NGC 5253 using the -band (NIC2 F160W filter) data because this wavelength represents the best compromise between spatial resolution and reduced effects of extinction. We used IRAF daophot routines and detected a total of 269 clusters. The positions of the clusters identified in the -band were then used as input for daophot at the other four wavelengths, 1.1, 1.87, 1.9 and m. Since most of the clusters appear to be slightly resolved, we constructed at each wavelength a point spread function (PSF) from bright sources in the images to model the photometry instead of using theoretical PSFs. These PSFs are used by daophot to model the cluster photometry simultaneously for all the sources detected in the field of view. The cluster photometry was obtained through a 10 pixel=0.76″ (pc) diameter aperture. The underlying galaxy emission was measured from annuli surrounding the source. In addition to the continuum photometry, we compute for each cluster the EW of Pa.
Table 1 lists the photometry for the brightest star clusters selected in the -band with absolute magnitudes . The quoted errors are the output of daophot. Since most of the clusters, and in particular the bright ones, appear to be slightly resolved, we did not apply an aperture correction to the magnitudes measured through the -diameter. The aperture corrections (for point sources) are , and for the F110W, F160W and F222M magnitudes, respectively, and mag for the colors, based on photometry of point sources generated with Tiny Tim (Krist et al. 1998).
3.2 H ii regions
We identified and performed photometry of H ii regions in the continuum subtracted Pa image of the central region of NGC 5253. We used the software region, kindly provided by C. H. Heller (see Pleuss, Heller, & Fricke 2000, and references therein for a detailed description).
region is a semiautomated method that locates and computes statistics of H ii regions in an image, based on contouring taking into account the local background. We set the limit for the size of an H ii region to 9 contiguous pixels, which at the distance of NGC 5253 corresponds to minimum linear sizes (diameters) of approximately 5 pc. Briefly, the H ii selection and photometry procedure is as follows. First the program selects local maxima; then we set a brightness limit for the pixel to be included as part of an H ii region that the pixel must have an intensity above the local background of at least 3 times the rms noise of the local background (see Rand 1992 for more details on the criteria employed). After identifying the H ii region, the software measures its position, size (area), and Pa flux by subtracting the closest local background (selected interactively by the user) from the observed flux.
In Table 3 we present the photometry of H ii regions with measured Pa luminosities (not corrected for extinction) . The diameters listed in this table are ’equivalent diameters’ computed assuming that the area covered by the H ii region is circular.
3.3 Nuclear Spectral Energy Distribution
In deriving the nuclear spectral energy distribution (SED) we can only zoom in as tightly as the smallest of our extraction apertures () for the -spectroscopy. We thus matched the photometry at other wavelengths to this size, and paid special attention to subtracting the underlying galaxy emission to isolate as much as possible the nuclear emission. In what follows, we describe the procedure for obtaining the photometry and estimating the galaxy contribution. The nuclear photometry is summarized in Table 4.
For the photometry of the HST/WFPC2 and NICMOS broad-band images we simulated the spectroscopy aperture on the images, and the local background was estimated from annuli around the nucleus taking care that they did not include faint star clusters. We estimated the continuum at m from the narrow-band F190N image in a similar fashion.
The ISOCAM images of NGC 5253 show at all five wavelengths a bright point source superimposed on a faint extended component. The emission from the point source is unresolved, as determined from the comparison of the measured FWHM of the nuclear source with the sizes of theoretical PSFs (with sizes typically of FWHM depending on the wavelength, Okumura 1998). We assume that the unresolved flux at all five wavelengths arises from the nuclear region. The local background was estimated from areas near the edges of the images.
We also make use of mid-infrared data from the literature. The mid-infrared narrow-band and broad-band fluxes of Frogel, Elias, & Phillips (1982) were observed through an 8″-diameter aperture. This photometry is in good agreement with the m spectrophotometry through a 5.4″-diameter aperture of Aitken et al. (1982). Other ground-based measurements from the literature include the 11.7 and m unresolved fluxes from Gorjian et al. (2001), and the 10 and m fluxes through a 5.4″-diameter aperture of Rieke (1976) and Lebofsky & Rieke (1979). From comparison of the ground-based measurements, the only discrepant point for the nuclear photometry is the 8”-diameter flux at m from Frogel et al. (1982). The ground-based small aperture mid-infrared fluxes are consistent with the ISOCAM unresolved fluxes, giving us confidence that most of the small aperture mid-infrared emission is from the nucleus.222We note that Rieke (1976) and Lebofsky & Rieke (1979) already remarked that NGC 5253 has a compact m source with a much higher surface brightness than other star forming galaxies in their sample. Gorjian et al. (2001) used Keck and measured a size for the central mid-infrared source of 0.62″, supporting the fact that the mid-infrared flux originates in a very small nuclear region. The IRAS fluxes (Roche et al. 1991) and the SCUBA (James et al. 2002) data point will be taken as upper limits for the modeling of the nuclear SED (Section 7) as they encompass the entire galaxy.
4 Morphology of the central super star cluster/H ii Region
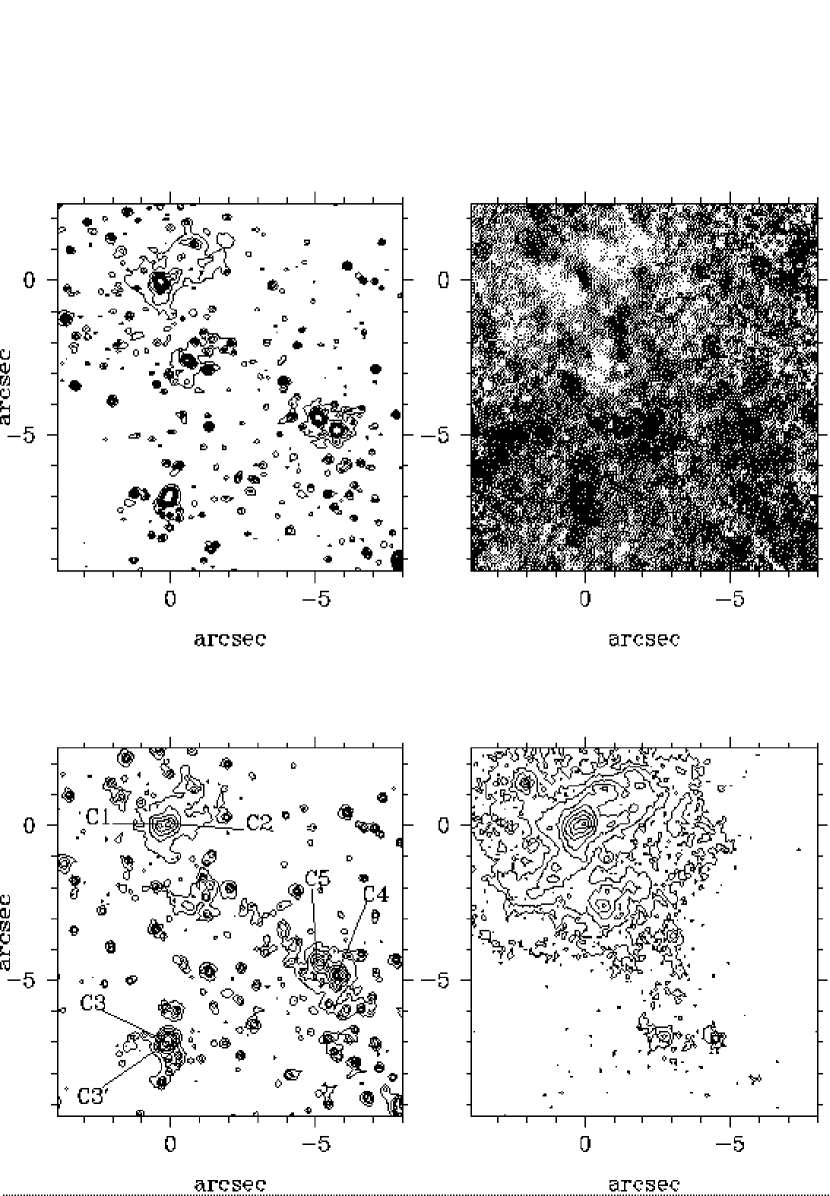
The most striking feature revealed by the HST/NICMOS images is the presence of a double star cluster (see also Turner & Beck 2004) in the nucleus of NGC 5253, which we term C1 for the eastern cluster and C2 for the western cluster (see Table 1). Fig. 2 shows close-ups of the central of NGC 5253 in the optical (WFPC2 F814W) and at near-infrared wavelengths. We also indicate the locations of the five brightest clusters in the -band (see also Table 1). In Fig. 4 the close-ups show the central .
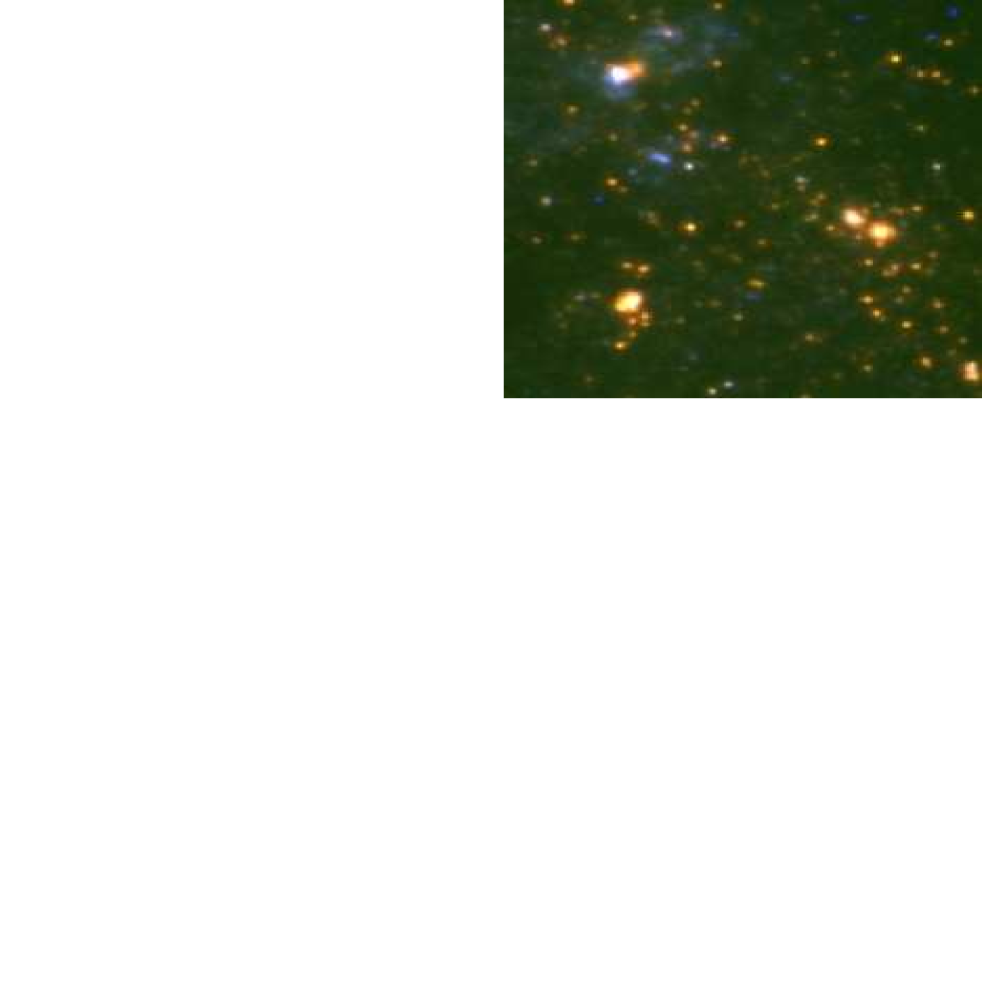
The double star cluster is most conspicuous at m (see Fig. 4), where both clusters show similar apparent brightness (see Table 1). The distance between the two star clusters as measured at m is or pc for the assumed distance. Turner et al. (2003) have recently reported that the brightest source at m is offset by to the northwest of the youngest optical source and peak of the H emission —referred to as NGC 5253-5 and UV-12 in Calzetti et al. (1997) and Meurer et al. (1995), respectively. Indeed the NICMOS F222M image shows that the western cluster C2 dominates the emission at m. We thus identify the eastern star cluster C1 with the peak of the H emission and youngest optical star cluster (NGC 5253-5 in Calzetti et al. 1997 notation). The western star cluster C2 becomes the brightest source at m (see Table 1, and Fig. 2), and is so reddened that it is hardly detected in the optical (see the WFPC2 F814W image shown in Fig. 2). This fact is also illustrated in the false color image of the central region of NGC 5253 shown in Fig. 5.
Bright Pa emission is detected from both star clusters, and the two H ii regions are named H2 (at the location of C2) and H1 (at the location of C1), see Table 3. The H luminosity derived from the Pa luminosity (not corrected for extinction) using the theoretical line ratios in Hummer & Storey 1987) of H2 indicates that this source has the typical brightness of giant H ii regions, e.g., 30 Doradus.333Note that the near-infrared magnitudes and EWs of C1 and C2 do not correspond to exactly the same spatial extent as the double H ii region because of the two (unavoidably) different methods for doing photometry of star clusters (approximately point sources) and H ii regions (extended sources).
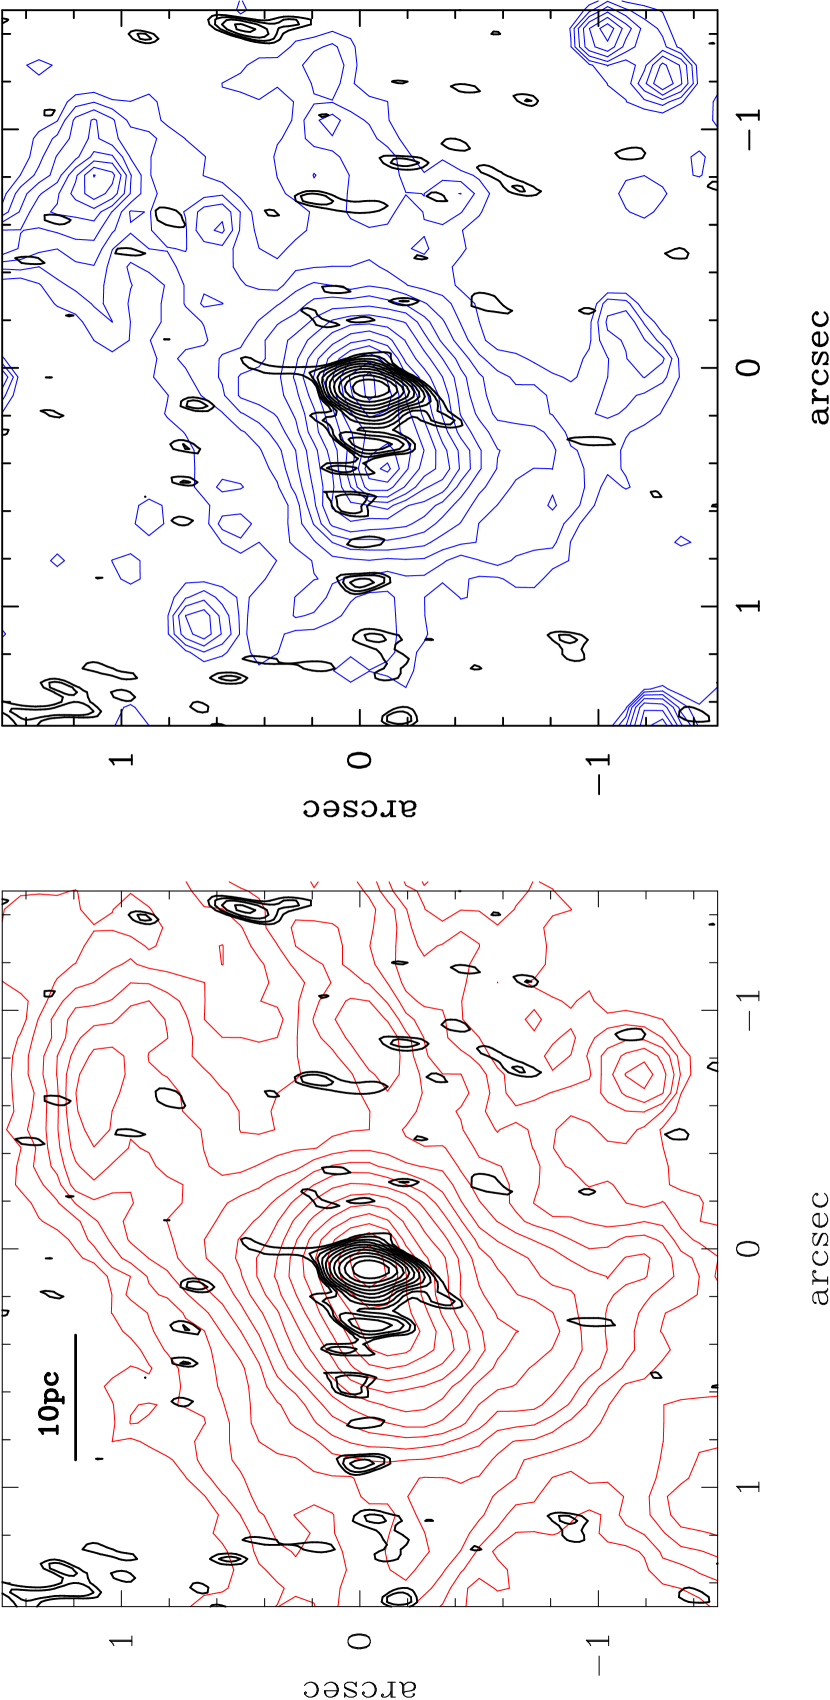
Turner, Beck, & Ho (2000) obtained 1.3 cm and 2 cm VLA images of NGC 5253 at subarcsecond resolution and detected at both wavelengths a bright supernebula. Their 1.3 cm map also displays a secondary peak within the central 0.5″. Fig. 4 compares the radio and near-infrared morphologies (Pa emission and m) of the central . Assuming that the brightest radio source and the C2 star cluster (also the H2 H ii region) are coincident, then the secondary radio peak appears to be at the location of secondary H ii region (H1) and at the approximate location of the star cluster C1. The central double cluster/H ii region appears also to be coincident with the bright mid-infrared source detected by Gorjian, Turner, & Beck (2001). It is likely that the bright near-infrared cluster C2 is actually responsible for most of the mid-infrared emission (see Turner & Beck 2004).
| HII | Diameter | ID | |||
|---|---|---|---|---|---|
| Region | () | () | (″) | (erg s-1) | |
| Central Double H ii Region | |||||
| H2 | 0 | 0 | 2.0 | 38.91 | C2, Dominant 1.3cm source |
| H1 | 0.3E | 0.1S | 1.1 | 38.42 | C1, Secondary 1.3cm source |
| NGC5253-5, UV-12 | |||||
| Other H ii Regions | |||||
| H3 | 0.8W | 0.1S | 1.2 | 38.11 | |
| H4 | 1.1E | 1.7S | 1.5 | 38.07 | |
| H5 | 0.8W | 1.1N | 1.1 | 38.00 | |
| H6 | 0.7W | 2.6S | 1.3 | 38.00 | NGC5253-4, UV-1, Harris4 |
Note. — and are the measured offsets in arcseconds relative to the position of H2. The Pa luminosities are not corrected for extinction. The diameters listed in this table are ’equivalent diameters’ computed assuming that the covered area by the H ii region is circular. The Pa luminosities correspond to these areas, and are not corrected for extinction. The column ’ID’ indicates possible correspondences with sources detected at other wavelengths. “NGC5253-5/UV-12” and “NGC5253-4/UV-1” are young star clusters detected in both the optical and UV, Calzetti et al. 1997 and Meurer et al. 1995, respectively. “Harris4” is an optical cluster reported by Harris et al. (2004). The 1.3cm radio sources are from Turner et al. 2000.
| Aperture | Reference | Uncertainty | ||
|---|---|---|---|---|
| m | mJy | |||
| 0.255 | 0.20 | 1.5”x1.6” | WFPC2 F255W | 7% |
| 0.547 | 0.40 | 1.5”x1.6” | WFPC2 F547M | 3% |
| 0.814 | 0.84 | 1.5”x1.6” | WFPC2 F814W | 5% |
| 1.1 | 1.20 | 1.5”x1.6” | NICMOS NIC2 F110W | 7% |
| 1.6 | 1.20 | 1.5”x1.6” | NICMOS NIC2 F160W | 6% |
| 1.9 | 1.58 | 1.5”x1.6” | NICMOS NIC2 F190N | 6% |
| 2.2 | 3.55 | 1.5”x1.6” | NICMOS NIC2 F222M | 4% |
| 2.2 | 4.20 | 1.5”x1.6” | Spex spectroscopy | 10% |
| 3.0 | 19.0 | 1.5”x1.6” | Spex spectroscopy | 10% |
| 3.5 | 48.4 | 1.5”x1.6” | Spex spectroscopy | 10% |
| 4.0 | 92.5 | 1.5”x1.6” | Spex spectroscopy | 10% |
| 7.8 | 867. | circular-8” | Frogel et al. 1982 | 27% |
| 8.6 | 817. | circular-8” | Frogel et al. 1982 | 13% |
| 9.6 | 1067. | circular-8” | Frogel et al. 1982 | 14% |
| 10.4 | 1541. | circular-8” | Frogel et al. 1982 | 11% |
| 11.4 | 1574. | circular-8” | Frogel et al. 1982 | 12% |
| 12.4 | 2041. | circular-8” | Frogel et al. 1982 | 22% |
| 10.0 | 1298. | circular-8” | Frogel et al. 1982 | 6% |
| 20.0 | 6098. | circular-8” | Frogel et al. 1982 | 15% |
| 10.0 | 1500. | circular-5.4” | Lebofsky & Rieke 1979 | |
| 21.0 | 2800. | circular-5.4” | Lebofsky & Rieke 1979 | 25% |
| 11.7 | 2200. | unresolved | Gorjian et al. 2001 | 10% |
| 18.7 | 2900. | unresolved | Gorjian et al. 2001 | 10% |
| 4.5 | 143. | point-source | ISOCAM | 4% |
| 6.7 | 520. | point-source | ISOCAM | 9% |
| 7.7 | 829. | point-source | ISOCAM | 7% |
| 12.0 | 2060. | point-source | ISOCAM | 4% |
| 14.9 | 4100. | point-source | ISOCAM | 4% |
| 12.0∗ | 2730. | entire galaxy | IRAS-Roche et al. 1991 | |
| 25.0∗ | 12630. | entire galaxy | IRAS-Roche et al. 1991 | |
| 60.0∗ | 30630. | entire galaxy | IRAS-Roche et al. 1991 | |
| 100.0∗ | 29490. | entire galaxy | IRAS-Roche et al. 1991 | |
| 850.0∗ | 192. | 41″ | SCUBA-James et al. 2002 | 12% |
Note. — ∗Upper limits to the nuclear emission.
The errors account for the photometric calibration uncertainty, and when possible, the uncertainty from estimating the contribution from the underlying galaxy (see Section 5.1). The absolute photometric calibration uncertainties for the ISOCAM data are from the ISOCAM handbook (Blommaert et al. 2001).We also make use of the m spectrophotometry of Aitken et al. (1982).
| Aperture | Lines | Ref. | |
|---|---|---|---|
| Infrared estimates | |||
| Br/Br | mag | 2 | |
| Br/Br | mag | 1 | |
| Pa/Br | mag | 1 | |
| Br/Br | mag | 1 | |
| Br/Br | mag∗ | 3 | |
| Circular 5.4″ | m Silicate feature | 10mag | 3,4 |
| Optical estimates | |||
| Central | H/H | mag∗∗ | 5 |
Note. — References: 1. This work. 2. Turner et al. 2003. 3. Kawara, Nishida, & Phillips 1989. 4. Aitken et al. 1982. 5. Walsh & Roy 1989.
∗ obtained from the Br/Br line ratio reported in Kawara et al. 1989 and the extinction of Rieke & Lebofsky 1985
∗∗ Observed range of in the central region of NGC 5253.
5 The Nuclear Stellar Population
5.1 Age
The spectroscopy through the aperture can be used to derive the properties of the stellar population of the central cluster C1+C2, as long as it is not heavily contaminated by other faint clusters/H ii regions. We can compare the Pa luminosities of the H ii regions H1 and H2 (Section 3.2) believed to represent well the luminosities of the two nebulae, with that measured simulating the Spex aperture on the continuum subtracted Pa image. We find that these two measurements are within of each other, and thus we believe that the spectroscopic data are mainly sampling the double cluster/H ii region.
The EWs of hydrogen recombination lines are reliable age estimators of young (that is, the lines are in emission) stellar populations for the case of instantaneous star formation (e.g., Alonso-Herrero et al. 1996) since EWs measure the ratio between massive (young) stars and the total number of stars. Moreover, if the extinction to the gas is the same as the extinction to the stars (cf. Calzetti 2001) then the EWs are extinction-independent age indicators. The observed EW of Br (Table 2) yields an age for the nuclear stellar population of C1+C2 of approximately yr, similar to that estimated by Davies, Sugai, & Ward (1998) using Br narrow-band imaging. We have used Starburst99 (Leitherer et al. 1999) for a stellar population formed in an instantaneous burst with solar metallicity and a Salpeter IMF with lower and upper mass cutoffs of and , respectively. This age estimate is not very dependent on the metallicity of the stars, but it is rather sensitive to the choice of IMF (see Leitherer et al. 1999).
Using daophot on the HST/NICMOS images we have been able to separate both clusters/H ii regions and measure their near-infrared magnitudes and EW of Pa (see Table 1). Assuming that the age of young clusters is well represented by the observed EW of Pa, we find that C1 and C2 are both young star clusters, with similar ages of approximately yr, in good agreement with other estimates. For instance, Calzetti et al. (1997) obtained an age of yr for the peak of the H emission (presumably our cluster C1) based on UV and optical photometric data, and the EW of H. Tremonti et al. (2001) using UV spectroscopy fitted the age of the brightest optical cluster to yr. Ground-based and ISO mid-infrared spectroscopy of the central region of NGC 5253 suggests a stellar population yr old (Beck et al. 1996 and Crowther et al. 1999).
The non-detection of the -band CO bands (see Fig. 3) sets an upper limit to the age of the population in the central double cluster of yr. We also extracted a circumnuclear -band spectrum by subtracting the spectrum from the one. Even in the region surrounding C1 and C2 there is no evidence for the presence of CO bands. One possibility for the non-detection of the CO bands even in the circumnuclear region would be the presence of dust emission peaking in the mid-infrared. This component would fill in the CO bands in the -band, and weaken them as observed in many Seyfert 1 and 2 galaxies with a strong thermal infrared continuum (e.g., Ivanov et al. 2000). Indeed from Fig. 3 it is clear that in the nuclear region the m continuum is very steep and may have a significant contribution from thermal emission (see discussion in Sections 5.2.2 and 7.2). This is not however the case for the circumnuclear spectrum where the continuum slope resembles that of less reddened starbursts (see Fig. 3). Thus we believe that the lack of CO bands in the nuclear region of NGC 5253 is not fundamentally due to the presence of a red continuum.
We note however that age estimates based on the CO bands may be dependent on the metal abundance ([Fe/H]) of the stars as there is a dependence of the strength of the near-infrared CO bands on the metallicity of the stars (Origlia et al. 1997; Frogel et al. 2001; Ivanov et al. 2004). The upper limit for the age of the stellar population based on the non-detection of the CO bands remains approximately constant (yr) even if we consider the models with the lowest metallicity in Starburst99 (). This together with the measured EW of Br of the circumnuclear region (Table 2) suggests that the stellar population within the entire central () region of NGC 5253 is very young (yr), and it is not only confined to the double star cluster C1+C2.
5.2 Extinction
The interpretation of the properties of the central double cluster requires an accurate estimate of the extinction to the source. The extinction to the gas can be estimated from hydrogen recombination line ratios, so long as the comparison is based on measurements with the same beam sizes. To determine the extinction to the stars we can compare observed colors (or the SED) with the outputs of Starburst99 for the age range derived in the preceding section. The determination of the extinction to the gas and stars is described in the next two sections.
5.2.1 Extinction to the gas
There have been a number of estimates of the extinction to the gas in the central region of NGC 5253, based primarily on optical and near-infrared hydrogen recombination lines. The largest uncertainty in the extinction by far comes from the unknown distribution of dust within the source. Meurer et al. (1995) studied the UV properties of a sample of starburst galaxies that included NGC 5253, and concluded that the dust geometry can be effectively described in terms of a foreground screen configuration near the starburst. However, their galaxies were UV-selected and may be biased toward low extinction and possibly an unrepresentative distribution of the dust.
We use the observed emission line fluxes of Pa, Br, Br and Br and the extinction law of Rieke & Lebofsky (1985) to infer the extinction to the central . In Table 5 we show our results together with estimates from the literature using a foreground dust screen model. All the near-infrared estimates of the visual extinction to the gas are consistent to within the errors, whereas the optical estimates are significantly lower (see discussion in Calzetti et al. 1997). The differing values of the extinction as a function of wavelength are the usual indication that the extinction is either patchy or mixed with the emitting sources along the line of sight (or both). Indeed, Calzetti et al. (1997) have argued that a young star cluster will be deeply embedded in its natal molecular cloud and thus the stars, gas and dust are likely to be mixed, providing an efficient way of “hiding” the dust.
Using a value of the extinction of mag (which is consistent with all our estimates) and the observed fluxes through the apertures we infer a number of ionizing photons . This is similar to, although slightly lower than, the radio estimates of Turner et al. (2000, 2003) and Turner & Beck (2004). The radio H92 observations of Mohan et al. (2001) predict , but this line is only sensitive to a narrow range of nebular densities.
5.2.2 Extinction to the stars and dust emission at near-infrared wavelengths
A qualitative description of the extinction to the stars can be obtained from color maps (see the color map of the central in Fig. 2) and false color images (e.g., Fig. 5, and also Turner et al. 2003). The C2 cluster is heavily obscured, but it becomes the brightest source in this galaxy at m. On the other hand, the region surrounding C2 and the region to the southeast of C2 appear blue with respect to other star clusters due to the youth of the ionizing stars. Also, there is evidence for the dust lane that crosses the galaxy approximately east-west.
Evidently the high value of the central extinction derived in the previous section must be mostly associated with C2, as the infrared colors of C1 appear to be quite blue (see Table 1) consistent with outputs from Starburst99 for a young starburst. A stellar population created in an instantaneous burst after yr shows infrared colors: and . The observed near-infrared colors of C1 are consistent with mag. The color of C2 is consistent with mag for the same age range as above. Using a model where the central cluster is hidden behind a thin dust layer and is completely embedded in a thick dust cloud Calzetti et al. (1997) found that values of the extinction mag were necessary to account for the observed UV-optical colors of the central cluster. The dereddened color of C2 is still very red. As we shall see in Section 7, this is the effect of hot dust emission with a significant contribution in the -band and/or differential extinction. If we assume that there is no differential extinction between the and the -band, then approximately 70% of the -band emission in C2 could be produced by hot dust (with some small contribution from gas emission as well).
5.3 Stellar mass of the double cluster
Using the age and the extinction estimates, we can infer the stellar masses of the two clusters for a Salpeter IMF with mass cutoffs of and , using their absolute -band magnitudes. For C1 we estimate a stellar mass of (see also Fig. 6). If we continued the high mass slope all the way down to the total stellar mass would be . For the C2 cluster since the current dataset does not allow us to distinguish between hot dust emission in the -band and differential extinction, we can only obtain a range of stellar masses. If there is no differential extinction between the gas and the stars, and up to 70% of the -band emission is due to hot dust, then the stellar mass of C2 would be (or for a Salpeter IMF extending down to ). The upper limit to this estimate would be if all the -band emission were stellar in origin (implying that there is differencial extinction) and we corrected the observed color to that corresponding to Myr; in this case the stellar mass would be (or for an IMF down to ). In any case, C2 dominates C1 by mass for any plausible C2 age and extinction. Using the number of ionizing photons (corrected for extinction) derived in Section 5.2.1 we would require a mass for the two ionizing clusters of (or for an IMF down to ), for the same star formation history.
6 -band selected star clusters in the central
6.1 Bright clusters
In Table 1 we give the photometry, colors and observed EW of Pa of bright clusters (mag) selected in the -band. In the last column of this table we give possible associations with star clusters detected at other wavelengths. The correspondences are solely based on the measured relative offsets taking into account the fact that C1 is easily identified in the UV and optical, and at near-infrared wavelengths m.
We find near-infrared counterparts to five of the six star clusters optically selected by Calzetti et al. (1997), as well as some of the clusters reported by Harris et al. (2004), as shown in Table 1. The absolute and magnitudes (not corrected for extinction) are typical of near-infrared star clusters detected in other hot-spot galaxies and starbursts (e.g., Alonso-Herrero, Ryder, & Knapen 2001; Elmegreen et al. 2002; Maoz et al. 2001). Except for star cluster C2, the rest of the central clusters in NGC 5253 are not as bright as the near-infrared super star clusters identified in luminous and ultraluminous infrared galaxies (Scoville et al. 2000, Alonso-Herrero et al. 2002) and interacting galaxies (e.g., the Antennae, Gilbert et al. 2000; Mengel et al. 2002).
At ground-based resolution the star cluster C3+C3’ appears as the second brightest near-infrared cluster after C1+C2, and was identified by Davies, Sugai, & Ward (1998) as one of the bright three near-infrared hot spots (see Figs. 1 and 2) in this galaxy. The third brightest cluster identified in Davies et al. (1998) corresponds to the C4+C5 cluster in our notation (see Table 1). The -band spectrum of C3+C3’ is presented in Fig. 3. Note that the extraction aperture possibly includes other fainter star clusters (see e.g., Fig. 2). The measured EW of Br sets a lower limit to the age of this cluster of approximately yr, using outputs of Starburst99 under the same assumptions used for the central cluster. This age is consistent with that derived from the observed EW of Pa (yr). The lack of m CO bands, on the other hand, sets an upper limit to the age of the cluster of approximately million years, although this limit is dependent on the metallicity of the stars. Davies et al. (1998) using the measured EW of Br (Å; note that they used a 2″-diameter aperture) from narrow-band imaging derived an age for this cluster of 10 million years, although using Starburst99 we would get yr. Calzetti et al. (1997) estimated an age for C3 of yr.
Tremonti et al. (2001) studied in detail clusters C4 and C5 (clusters NGC5253-3 and NGC5253-2 in their notation) using HST UV spectroscopy, and derived ages of 3 Myr and 8 Myr, respectively. Their result is in good agreement with the age from the measured EW of Pa of C5 (see also Harris et al. 2004). However the young age Tremonti et al. (2001) inferred for C4 appears to be inconsistent with the lack of bright Pa emission at the location of this star cluster. Harris et al. (2004) on the other hand find an age for this cluster of between 10 and 14 Myr consistent with our finding. For other near-infrared clusters in common with those optically selected by Harris et al. (2004) we find ages and stellar masses (see next section) consistent with their photometric and EW of H based estimates.
6.2 Young versus old star clusters
The only optically bright star cluster that is not bright in the near-IR is NGC5253-4, using the notation of Calzetti et al. (1997). This star cluster, however, is detected as a bright H ii region (H6, see Table 3) and is also the brightest UV source (Meurer et al. 1995). Based on the observed EW of Pa we derive a very young age for this cluster/H ii region (yr), similar to that of C1 and C2. Harris et al. (2004) derive an age for H6 (their cluster # 4) of yr using the EW of H. The youth of H6 explains why the ionizing cluster has not become infrared bright (that is, its absolute magnitude is fainter tha mag). Starburst99 suggests that if the H ii region H6 was formed in an instantaneous burst the ionizing cluster will become near-infrared bright in the next three or four million years (see Fig. 6 for the location of H6 and future time evolution of its near-infrared magnitude). The age derived from the EW of Pa is consistent with that derived in Calzetti et al. (1997) using UV and optical magnitudes, together with the EW of H.
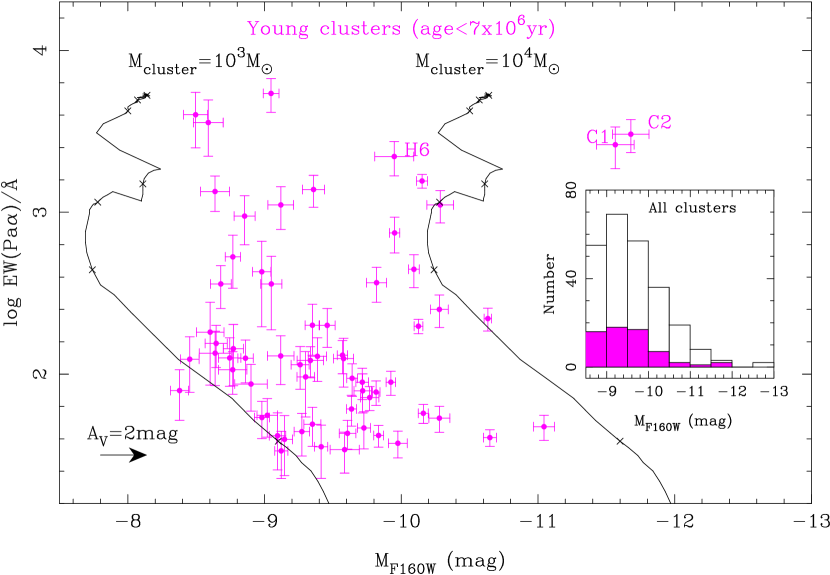
As we have shown, the EW of Pa is a useful indicator of the age of young star clusters444However, in general for higher metallicity galaxies, Pa must be used in this way with some caution due to the delayed episode of ionization from WR stars (Rigby & Rieke 2004).. For all the 269 clusters detected in the -band we can determine from a statistical point of view both the masses of the young clusters, and what fraction of all the detected infrared clusters are young. The main panel of Fig. 6 shows the absolute magnitude vs. the EW of Pa for young clusters selected in the -band. We show clusters with observed EW of PaÅ or ages of less than million years. We also show outputs of Starburst99 (Leitherer et al. 1999) for clusters with masses and formed in an instantaneous burst with a Salpeter IMF between 1 and . The arrow shows what would be the effect of correcting the observed absolute magnitudes by 2 magnitudes of visual extinction for the case of a foreground dust screen (assuming extinction to stars and line emission is the same). From the colors of bright clusters (Table 1) and the color map in Fig. 2 it is clear that the young clusters are not very obscured, and thus the observed absolute magnitudes can be used to infer the stellar mass. From Fig. 6 we find that the young clusters have stellar masses of between and , in good agreement with the findings of Harris et al. (2004). Unfortunately for older clusters where we do not have EW of Pa based ages, we cannot derive the stellar masses as the near-infrared mass-to-light ratio is dependent on the age of the stellar population.
The insert of Fig. 6 also shows the distribution of absolute magnitudes of all the clusters detected and that of the the young (age million years) clusters. We find that approximately % of the clusters detected in the -band have ages of less than 7 million years. This fraction remains roughly constant in all magnitude bins.
| Property | Nuclear Region | Entire Galaxy1 |
|---|---|---|
| Star Formation | Burst | Infall model |
| Age of stellar population | yr | |
| Effective optical depth | ||
| Size of the emitting region | pc | pc |
| Mass of HI | ||
| Dust Mass | ||
| Stellar Mass2 | ||
| Bolometric Luminosity |
Note. — 1Results from the modelling of the entire galaxy are from Takagi et al. (2003b), using an infall model of chemical evolution with a timescale of Myr (i.e., SFR ), recomputed for the distance assumed in this paper (Mpc).
2Stellar masses are for a Salpeter IMF with mass cutoffs of and .
7 The Nuclear SED of NGC 5253
7.1 The Model
We used the SED model of Takagi, Vansevicius & Arimoto (2003) to reproduce the UV to mid-infrared SED of the nuclear region of NGC 5253 (Table 4). This model makes use of the population synthesis model of Kodama & Arimoto (1997) to predict the stellar emission. For the nucleus of this galaxy we assumed an instantaneous burst of star formation with solar metallicity and a Salpeter IMF with lower and upper mass cutoffs of and , respectively. In the SED model of Takagi et al. (2003a), stars are centrally concentrated in a spherical region with a density profile given by the King model, while the dust grains are homogeneously distributed throughout the emitting region. The equations of radiative transfer are numerically solved by considering multiple scattering of photons and self-absorption by dust (see Takagi et al. 2003a for more details). The main parameters of this model are the age of the stellar population, the equivalent -band optical depth measured from the center to the outer edge of the region, and the size of the emitting region, . Note that is defined by the column density of dust, whereas is defined by the luminosity ratio of input and output at -band. The latter optical depth was used to verify the SED models of star forming galaxies of Takagi, Arimoto, & Hanami (2003b) because it is directly comparable with observations. The extinction curve can be chosen from three types: MW, LMC, and SMC. Using this model, we manually found the best-fitting model to the nuclear SED, i.e. we calculated a new model in each step of the fitting process until convergence was reached.
7.2 Results from the modelling
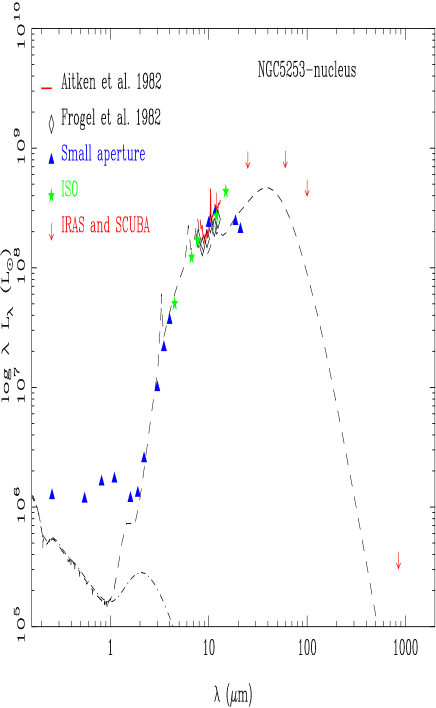
In Table 6 the results of the modelling of the nuclear SED of NGC 5253 are presented and compared with those from the modelling of the entire galaxy emission (Takagi et al. 2003b). The fit to the nuclear SED is shown in Fig. 7. There is a degeneracy in several of the model parameters — age, , and — for the overall nuclear SED from m to m, but the depth of tbe silicate feature at m can be used to constrain the model parameter ranges. We could not obtain reasonable fits with either a LMC or a SMC-type extinction curve. For both these extinction curves the fraction of silicate grains is larger than that in the MW-type (see Takagi et al. 2003a). We found a conservative limit of from the observed silicate absorption (see also Aitken et al. 1982; Kawara et al. 1989 and Fig. 7) with the MW-type extinction curve. With this , the observed nuclear SED from m to m was reproduced with SEDs in which the contribution from red supergiants at near-infrared wavelengths is still negligible, i.e. Myr in the adopted population synthesis model. An older age would need values of the optical depth to fit the SED from m to m because the relative brightness of the intrinsic SED in the near-infrared increases as the system ages. Since the observed depth of the silicate feature is relatively shallow, we fit values of the optical depth and the age Myr. The fitted age is in good agreement with the values obtained in Section 5.1. To compare the fitted optical depth with observations of the gas emission, we need to use . When is large, it is not straightforward to compare with as derived from the emission lines. For a meaningful comparison, we need to choose a wavelength to calculate at which there be still significant stellar emission from the central region and be close to the wavelengths used to estimate . For the model with Myr and , we derived an effective optical depth at m of from the luminosity ratio of the input and the attenuated stellar emission. For the MW extinction curve, this corresponds to = 15.7 or mag. This is in good agreement with the estimate of from the infrared lines in Section 5.2.1.
Considering these results, the best fit to the nuclear SED is reached for a stellar mass of (for a Salpeter IMF with mass cutoffs and ) formed in an instantaneous burst, with an age of 3.2 Myr, with the MW extinction curve. The fitted size for the emitting region is 21 pc. The stellar mass needed to account for the observed nuclear SED of NGC 5253 is in good agreement with the stellar mass of the double cluster C1+C2 derived in Section 5.3 (taking into account the correction factor to use the same lower mass cutoff of the IMF). The gas and dust masses are M⊙ and M⊙, respectively. The resulting bolometric luminosity is L⊙. One interesting result from comparing the fitting results of the nuclear and galaxy SEDs (Table 6) is that up to half of the total dust mass in NGC 5253 appears to be concentrated in the nuclear region, with the consequence that a similar fraction of the bolometric luminosity is due to the central cluster.
We find that the fluxes at m are not well reproduced with this model (Fig. 7). It is possible that these fluxes are still contaminated by background radiation from the underlying galaxy (that is, not arising from the double cluster) and/or photons leaking through gas clouds, an effect that is not taken into account in the model. However a more likely explanation is the complicated geometry of the central double cluster. As discussed in Section 4, most of the UV and optical fluxes measured through the small aperture come from cluster C1 which is not significantly obscured, at least as infered from its observed near-infrared colors (Table 1 and Section 5.2.2) and color maps (Fig. 2). Cluster C2 on the other hand, only starts becoming visible in the near-infrared and dominates the nuclear emission at wavelengths longer than approximately m, indicating that it is deeply embedded. It is clear that the near-infrared to mid-infrared SED is dominated by C2, and thus the UV and optical fluxes should be taken as upper limits to the emission of C2. This is suggestive of different dust geometry and optical depth for each of the two nuclear clusters.
The ISO m flux and the ground-based m flux observed with the large aperture size (Frogel et al. 1982) could not be well reproduced with the model, indicating that there may be some contribution from emitting sources other than the central double cluster. Note however, that the smaller aperture fluxes of Lebofsky & Rieke (1979) and Gorjian et al. (2001) are well reproduced with the model. At m, the emission from very small grains (graphite) dominates, and because of this, there is a ’shoulder’ in the SED. Although the small aperture m data seems to indicate a single peak of hot dust emission, no SED model has such a single peak. If we reduced the size of the emitting region to move the peak of the SED toward shorter wavelengths, then the near-infrared fluxes would be significantly over-estimated. Therefore, there should be a true peak at m due to large grains, unless the emission from very small grains is significantly deficient. Finally, the best fit model shows that the m polycyclic aromatic hydrocarbon (PAH) feature is still present, but is not very prominent since the continuum produced by very small grains is high, effectively reducing the equivalent width of this feature. A similar fit to the nuclear SED of NGC 5253 could be obtained if we reduced the amount of PAH carrier, since the infrared SED remains the same, except for the PAH feature (i.e., PAHs have negligible contribution to continuum). We return to this issue in Section 7.3.
7.3 The non-detection of the m PAH feature in the nucleus of NGC 5253: age or metallicity effect?
Most massive star-forming galaxies display infrared emission features at 3.3, 6.2, 7.7, 8.6, and m (Roche et al. 1991; Uchida et al. 2000; Helou et al. 2000) that have been attributed to bending and stretching modes of CH and CC bonds in PAHs (Duley & Williams 1981; Léger & Puget 1984; Puget & Léger 1989). Among others, Roche et al. (1991) and Clavel et al. (2000) have shown that the strength of the m PAH feature depends strongly on environment: galaxies classified as Seyfert 1 show little to no m emission, while many type 2 AGN (see also Imanishi, 2002 and 2003 for a study of the m feature) and most pure starburst galaxies show strong PAH features. This behavior implies that as the radiation field density increases, the PAH carrier is progressively destroyed. This picture is supported by M82 where the m PAH emission is found to be anti-correlated with both the centrally peaked continuum emission and also with the Br emission (Normand et al. 1995). A similar situation is observed in NGC 253 where there is a decrease of the ratio of m PAH emission to continuum at the sites of strong star formation (Tacconi-Garman et al. 2004).
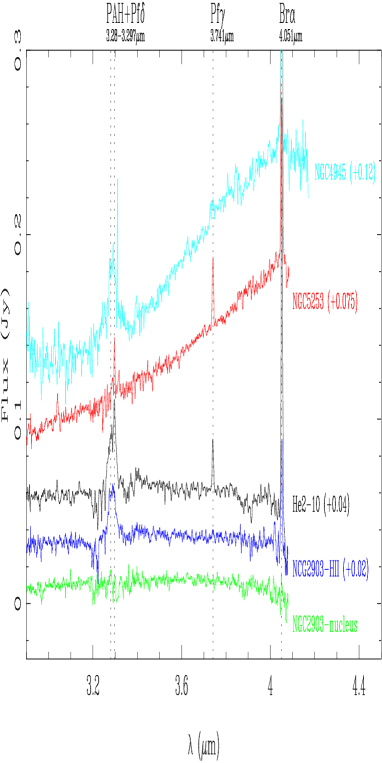
Dwarf galaxies in the metallicity range tend to show weak or no mid-infrared PAH features from ISO data (Madden 2002; Thuan, Sauvage, & Madden 1999) or ground-based observations (Roche et al. 1991), including NGC 5253 with . We are obtaining -band spectroscopy of a sample of starburst galaxies with a range of metallicities using Spex on the IRTF. Fig. 8 are the spectra for some of these galaxies, including a second dwarf galaxy, He2-10, with an age of Myr and metallicity of (Kobulnicky, Kennicutt, & Pizagno 1999). For NGC 2903 we have spectra for the quiescent nucleus and one of the bright H ii regions to the north of the nucleus (see Alonso-Herrero et al. 2001). The m feature is clearly detected in He2-10 and in the bright H ii region of NGC 2903, as well as in all starburst galaxies in our sample with metallicities . We also show that the highly obscured starburst/AGN NGC 4945 (-band spectroscopy from Spoon et al. 2003) has bright m PAH emission, indicating that this feature can be detected regardless of the extinction (Imanishi 2002).
The effects of metallicity and a harsh environment are coupled for young starbursts as in the nucleus of NGC 5253. As metallicity decreases stars present harder spectra, and Wolf-Rayet stars require larger mass progenitors thus creating a hard and intense radiation field that could suppress the formation of the m PAH feature. As discussed in Tacconi-Garman et al. (2004) and references therein, in strong radiation fields the efficiency of m PAH emission can be lowered by photoionization of the PAH molecules, or by destruction of the PAH molecules. Rigby & Rieke (2004) have demonstrated that the observed mid-infrared fine structure lines of the low metallicity starbursts NGC 5253 and II Zw40 can only be reproduced with a Salpeter IMF extending to , whereas for their sample of high mass, solar metallicity starbursts the interstellar radiation field will not include the outputs of stars above because most of them are probably embedded in compact H ii regions. Although the number of low metallicity starbursts analyzed in Rigby & Rieke (2004) is small, there seems to be an indication that in these systems the interstellar medium is less effective in confining ultracompact H ii regions, and thus a harsher radiation field environment is present that can effectively decrease or even suppress the m PAH emission.
8 Discussion and Conclusions
We have analyzed HST/NICMOS observations (m) and obtained m spectroscopy of the central region of the dwarf galaxy NGC 5253. The NICMOS images have revealed the presence of a double cluster (C1+C2) in the nucleus of the galaxy separated by ″ or pc for the assumed distance of Mpc. This double cluster is also a bright double source of Pa emission. We have also analyzed HST/WFPC2 observations and found that the western cluster (C2) is almost entirely obscured at UV and optical wavelengths, but becomes the brightest source in the galaxy at m. The double cluster C1+C2 appears to be coincident with the double radio nebula detected at 1.3 cm by Turner et al. (2000), and it is likely to be responsible for most of the mid-infrared nuclear emission in this galaxy (see also Turner & Beck 2004).
The high spatial resolution of the HST/NICMOS images allows us to measure the near-infrared magnitudes, EW of Pa and Pa luminosities of C1 and C2. If the star formation in the double cluster C1+C2 occurred in an instantaneous burst, C1 and C2 have virtually the same age ( million years). This young age for the double cluster is consistent with estimates by other authors for cluster C1 from UV/optical imaging and spectroscopy (e.g., Calzetti et al. 1997; Harris et al. 2004), and the presence of Wolf-Rayet features in the optical spectrum of the nucleus of the galaxy (Walsh & Roy 1987; Conti 1991). Although both nuclear clusters appear to be coeval, C2 is more massive and obscured than C1. The stellar mass for C2 is in the range of (for a Salpeter IMF in the mass range ), depending on the dust emission contribution to the observed -band magnitude, thus putting C2 in the category of super star clusters. The stellar mass of C1 is .
The fact that both C1 and C2 appear to be coeval but C2 is much more massive than C1 appears to conflict with the naive expectation that more massive clusters would blow away their birth clouds first. Using and -band hydrogen recombination lines and near-infrared colors we have inferred a very high obscuration for C2, suggesting that this young star cluster may be still (partially) embedded in its natal cloud. The age derived using the EW of Pa assumes that the extinction to the stars and gas is the same. If this is not the case, as discussed in Calzetti et al. (1997), that is, stars, gas and dust are mixed, then the derived age of C2 would be only an upper limit.
Turner & Beck (2004) have put forward some alternative explanations to that of the presence of a coeval double cluster in the nucleus of NGC 5253. One possibility they discuss is that cluster C1 is not a cluster but a reflection nebula from a gap opening in the cocoon around the infrared cluster. Their second scenario is that the supernebula is cometary and that what we are seeing in the nucleus of NGC 5253 is motion of the H ii region/cluster to the west and north. We favor the interpretation of a double cluster in the nucleus of NGC 5253 that has resulted from triggered star formation, due to infalling gas along the minor axis of the galaxy (see Meier et al. 2002). The south-east elongation of the radio supernebula detected by Turner & Beck (2004) shows a morphology similar to the Pa emission (Fig. 4, left panel), but we find that the bright nuclear Pa emission is extended over scales of a few arcseconds, whereas the radio supernebula is very compact (, see Turner & Beck for more details). From the -band NICMOS image of the central it is clear that there are a number of near-infrared clusters with no Pa emission, but there must be other ionizing clusters (not detected as bright sources of m emission) that are responsible for the extended Pa emission. Moreover, we have derived a very young age ( million years) using the -band spectrum for the circumnuclear region excluding C1 and C2. This all seems to indicate that what we are seeing are the effects of self-propagating star formation in the central region of NGC 5253.
In addition to the nuclear double cluster, we have identified a total of 269 star clusters in the -band over the observed region of , and measured their near-infrared magnitudes as well as the EW of Pa. Assuming that the EW of hydrogen recombination lines are good indicators of the age, we find that of the detected clusters in the -band have ages younger than approximately 7 million years. These young clusters have stellar masses of between and .
We finally model the nuclear UV to mid-infrared SED of NGC 5253 using the model of Takagi et al. (2003a), and compare it to the SED of the entire galaxy. For the nuclear SED we have taken special care to measure and subtract the underlying galaxy emission to isolate as much as possible the UV to mid-infrared emission of the double star cluster. For a Salpeter IMF we find that the nuclear infrared SED is well reproduced with a total stellar mass of and an age of 3.2 million years in good agreement with the estimates using the photometry and spectroscopy of C1+C2. The modelling of the nuclear SED shows that the young starburst is very obscured, mag, in good agreement with extinction estimates obtained from near-infrared hydrogen recombination lines. The UV-optical SED of the nuclear region is not well reproduced by the model probably due to the complicated dust and emitting source geometry of the nuclear region. The comparison between the nuclear and entire galaxy SED modelling shows that up to 50% of the dust mass in this galaxy is concentrated in the nucleus.
The model of the nuclear SED of NGC 5253 also predicts a moderately bright m PAH feature that is not observed in our nuclear -band spectrum. The m PAH feature along with the mid-infrared PAH features are detected in most massive starburst galaxies, but appear to be weak or absent in low mass and metallicity dwarf star forming galaxies. Rigby & Rieke (2004) have recently demonstrated that the star formation properties of NGC 5253, in particular the mid-infrared fine structure line ratios, can only be reproduced with a Salpeter IMF where the upper mass cutoff is . In the other more massive and metal rich starbursts in their sample the interstellar radiation field may not include the outputs of stars above because most of them are probably embedded in compact H ii regions. The fact that low metallicity stars produce a harder radiation field together with the presense of massive stars in the nuclear starburst of NGC 5253 result in a more intense and harder radiation field that could effectively suppress the production of the m PAH feature.
We thank Henrik Spoon for providing us with the -band spectrum of NGC 4945, and J. Turner and S. Beck for providing us with the VLA radio data of NGC 5253. We are also grateful to Mike Cushing for advice on Spex data reduction, Jason Harris for providing data for the optical clusters in electronic format, Karl Gordon for interesting discussions, and Alice Quillen for assistance with the Spex observations. AAH acknowledges support from NASA Contract 960785 through the Jet Propulsion Laboratory, and the Spanish Programa Nacional de Astronomía y Astrofísica under grant AYA2002-01055.
References
- (1) Aitken, D. K., Roche, P. F., Allen, M. C., & Phillips, M. M. 1982, MNRAS, 199, 31
- (2) Alonso-Herrero, A., Aragón-Salamanca, A., Zamorano, J., & Rego, M. 1996, MNRAS, 278, 417
- (3) Alonso-Herrero, A., Ryder, S. D., & Knapen, J. H. 2001, MNRAS, 322, 757
- (4) Alonso-Herrero, A., Rieke, G. H., Rieke, M. J., & Scoville, N. Z. 2002, AJ, 124, 166
- (5) Beck, S. S., Turner, J. L., Ho, P. T. P., Lacy, J. H. & Kelly, D. M. 1996, ApJ, 457, 610
- (6) Blommaert, J. et al. 2001,The ISO HandBook, Volume III, Version 1.2, ESA
- (7) Caldwell, N., & Phillips, M. M. 1989, ApJ, 338, 789
- (8) Calzetti, D., Meurer, G. R., Bohlin, R. C., Garnett, D. R., Kinney, A. L., Leitherer, C., & Storchi-Bergmann, T. 1997, AJ, 114, 1834
- (9) Calzetti, D. 2001, PASP, 113, 1449
- (10) Clavel, J. et al. 2000, A&A, 357, 839
- (11) Conti, P. S. 1991, ApJ, 377, 115
- (12) Contursi, A. et al. 2000, A&A, 362, 310
- (13) Cowan, J. J., & Branch, D. 1982, ApJ, 258, 31
- (14) Crowther, P. A., Beck, S. C., Willis, A. J., Conti, P. S., Morris, P. W., & Sutherland, R. S. 1999, MNRAS, 304, 654
- (15) Cushing, M. C., Vacca, W. D., & Rayner, J. T. 2004, PASP, 116, 363
- (16) Davies, R. I., Sugai, H. & Ward, M. J. 1998, MNRAS, 295, 43
- (17) Duley, W. W. & Williams, D. A. 1981, MNRAS, 196, 269
- (18) Elmegreen, D. M., Chromey, F. R., McGrath, E. J., & Ostenson, J. M. 2002, AJ, 123, 1381
- (19) Frogel, J. F., Elias, J. H., & Phillips, M. M. 1982, ApJ, 260, 70
- (20) Frogel, J. F., Stephens, A., Ramírez, S., & DePoy, D. L. 2001, AJ, 122, 1896
- (21) Gilbert, A. M. et al. 2000, ApJ, 533, L57
- (22) González-Riestra, R., Rego, M., & Zamorano, J. 1987, A&A, 186, 64
- (23) Gorjian, V., Turner, J. L., & Beck, S. C. 2001, ApJ, 554, L29
- (24) Harris, J., Calzetti, D., Gallagher, J. S. III, Smith, D., & Conselice, C. J. 2004, ApJ, 603, 503
- (25) Helou, G., Lu, N. Y., Werner, M. W., Malhotra, S., & Silbermann, N. 2000, ApJ, 532, L21
- (26) Hummer, D. G., & Storey, P. J. 1987, MNRAS, 224, 801
- (27) Imanishi, M. 2002, ApJ, 569, 44
- (28) Imanishi, M. 2003, ApJ, 599, 918
- (29) Ivanov, V. D., Rieke, G. H., Groppi, C. E., Alonso-Herrero, A., Rieke, M. J. & Engelbracht, C. W. 2000, ApJ, 545, 190
- (30) Ivanov, V. D., Rieke, M. J., Engelbracht, C. W., Alonso-Herrero, A., Rieke, G. H., & Luhman, K. L. 2004, ApJS, 151, 387
- (31) James, A., Dunne, L., Easles, S., & Edmunds, M. G. 2002, MNRAS, 335, 753
- (32) Kawara, K., Nishida, M., & Phillips, M. M. 1989, ApJ, 337, 230
- (33) Kleinmann, S. G. & Hall, D. N. B. 1986, ApJS, 62, 501
- (34) Kobulnicky, H. A., Kennicutt, R. C. Jr., & Pizagno, J. L. 1999, ApJ, 514, 544
- (35) Kodama, T., & Arimoto, N. 1997, A&A, 320, 41
- (36) Krist, J. E., Golimowski, D. A., Schroeder, D. J., & Henry, T. J. 1998, PASP, 110, 1046
- (37) Lebofsky, M. J., & Rieke, G. H. 1979, ApJ, 229, 111
- (38) Léger, A., & Puget, J.-L. 1984, A&A, 137, L5
- (39) Leitherer, C. et al. 1999, ApJS, 123, 3
- (40) Lumsden, S. L., Puxley, P. J., & Doherty, R. M. 1994, MNRAS, 268, 821
- (41) McLeod, B. 1997, in Proc. STScI Symp., The HST Calibration Workshop, ed. S. Casertano, R. Jederzejewski, C. D. Keyes, & M. Stevens (Baltimore: Space Telescope Science Institute), 281
- (42) Madden, S. C. 2000, NewAR, 44, 249
- (43) Maoz, D., Barth, A., Ho, L. C., Sternberg, A., & Filippenko, A. V. 2001, AJ, 121, 3048
- (44) Meier, D. S., Turner, J. L., & Beck, S. C. 2002, AJ, 124, 877
- (45) Mengel, S., Lehnert, M. D., Thatte, N., & Genzel, R. 2002, A&A, 383, 137
- (46) Meurer, G. R., Heckman, T. M., Leitherer, C., Kinney, A., Robert, C. , & Garnett, D. R. 1995, AJ, 110, 2665
- (47) Mohan, N. R., Anantharamaiah, K. R., & Goss, W. M. 2001, ApJ, 557, 659
- (48) Moorwood, A. F. M. & Glass, I. S. 1982, A&A, 115, 84
- (49) Normand, P., Rouan, D. Lacombe, F., & Tiphene, D. 1995, A&A, 297, 311
- (50) Okumura, K. 1998, ISOCAM PSF Report, Version 1.0, Additional CAM Documents, ESA
- (51) Origlia, L., Ferraro, F. R., Fusi Pecci, F., & Oliva, E. 1997, A&A, 321, 859
- (52) Pleuss, P. O., Heller, C. H., & Fricke, K. J. 2000, A&A, 361, 913
- (53) Puget, J.-L., & Léger, A. 1989, ARA&A, 27, 161
- (54) Rand, R. J. 1992, AJ, 103, 815
- (55) Rayner, J. T., Toomey, D. W., Onaka, P. M., Denault, A. J., Stahlberger, W. E., Vacca, W. D., Cushing, M. C. & Wang, S. 2003, PASP, 115, 362
- (56) Rieke, G. H., Lebofsky, M. J., & Walker, C. E. 1988, ApJ, 325, 679
- (57) Rieke, G. H. 1976, ApJ, 206, L15
- (58) Rieke, G. H. & Lebofsky, M. J. 1985, ApJ, 288, 618
- (59) Rigby, J. R. & Rieke, G. H. 2004, ApJ, 606, 237
- (60) Roche, P. F., Aitken, D. K., Smith, C. H., & Ward, M. J. 1991, MNRAS, 248, 6061
- (61) Sandage, A., Saha, A., Tamman, G. A., Labhardt, L., Schwengeler, H., Panagia, N., & Macchetto, F. D. 1994, ApJ, 423, L13
- (62) Scoville, N. Z. et al. 2000, AJ, 119, 991
- (63) Spoon, H. W. W., Moorwood, A. F. M., Pontoppidan, K. M., Cami, J., Kregel, M., Lutz, D., & Tielens, A. G. G. M. 2003, A&A, 499, 507
- (64) Tacconi-Garman, L. E., Sturm, E., Lehnert, M., Lutz, D., Davies, R. I., & Moorwood, A. F. M. 2004, A&A, sumbitted
- (65) Takagi, T., Vansevicius, V., & Arimoto, N. 2003a, PASJ, 55, 385
- (66) Takagi, T., Arimoto, N., & Hanami, H. 2003b, MNRAS, 340, 813
- (67) Thornley, M. D. et al. 2000, ApJ, 539, 641
- (68) Thuan, T. X., Sauvage, M., & Madden, S. 1999, ApJ, 516, 783
- (69) Tremonti, C. A., Calzetti, D., Leitherer, C., & Heckman, T. M. 2001, ApJ, 555, 322
- (70) Turner, J. L., Beck, S. C. & Ho, P. T. P. 2000, ApJ, 532, L109
- (71) Turner, J. L., Beck, S. C., Crosthwaite, L P., Larkin, J. E., McLean, I. S., & Meler, D. S. 2003, Nature, 423, 621
- (72) Turner, J. L. & Beck, S. C. 2004, ApJ, 602, L85
- (73) Uchida, K. I., Sellgren, K., Werner, M. W., & Houdashelt, M. L. 2000, ApJ, 530, 817
- (74) van den Bergh, S. 1980, PASP, 92, 122
- (75) Vanzi, L. & Rieke, G. H. 1997, ApJ, 479, 694
- (76) Walsh, J. R. & Roy, J.-R. 1989, MNRAS, 239, 297
- (77) Walsh, J. R. & Roy, J.-R. 1987, ApJ, 319, L57