XMM-Newton study of A3562 and its immediate Shapley environs.
Abstract
Using the mosaic of six XMM-Newton observations, we study the hydrodynamic state of the A3562, a cluster in the center of the Shapley Supercluster. The X-ray image reveals a sharp surface brightness gradient within the core of A3562, a 200 kpc ridge extending to the south-west. A nearby group, SC1329-313, imaged within this program also exhibits a tail aligned with the ridge. Study of the pressure and entropy identified the ridge with a 40% pressure enhancement. An associated Mach number of 1.15 relative to a polytropic sound speed for a 5 keV plasma requires the velocity of the group to be 1400 km/s, while the projected velocity difference between the cluster and the group amounts to 1200–1500 km/s. Apparent disruption of the group, if attributed to the ram pressure, also requires the velocity of the group in the cluster frame to amount to km/s. The sharp surface brightness gradient at the center is identified with a contact discontinuity, which together with dove tails in the the large-scale entropy distribution reveals a sloshing of the BCG in response to the passage of the SC1329-313 group. Using the extent of the low-entropy tails in A3562 we estimate the amplitude of sloshing motion to be kpc and the oscillation frequency 1 Gyr.
Subject headings:
galaxies: intra-galactic medium; clusters: cosmology; cosmic star-formation1. Introduction
Superclusters or second-order clusters of galaxies as they were first dubbed by George Abell (1958) are the largest coherent objects in the Universe. They are only 5 to 50 times denser than the field so that superclusters are not relaxed and should thus bear the imprints of the physical processes that are dominant during their formation. Their mildly or modestly nonlinear character offers direct clues about the ongoing growth of cosmic structures in the Universe. In the past few years observational evidence has increased in favor of a hierarchical formation of structure also on supercluster scales (Rines et al. 2001). From optical and X-ray data it was found that the core region of the Shapley Supercluster is close to turnaround, which is a rather unique state for a supercluster, as only a small fraction of them is expected to have collapsed by now. A mosaic of the A3562 cluster and its immediate environment was proposed for XMM-Newton to search for the cluster interaction within the supercluster, to understand its role in cluster formation within the supercluster. This also has an important link to studies of the origin of the non-thermal emission.
As will become clear in the course of our investigation, A3562 exhibits core oscillations in response to the passage of the SC1329-313 group, observed in the current XMM-Newton program. So, this paper is devoted to a detailed description of the disturbance the core oscillation brings to the cluster. We identify pressure features and provide their interpretation in connection to the interaction scenario for A3562. Our data on the SC1329-313 group show an interestingly high entropy level, suggesting that groups in superclusters are systematically underluminous. We attribute it to a high entropy of the intracluster gas in superclusters, possibly connected to the structure formation shocks. Cosmic shocks emerge during structure formation in the universe, due to gravitationally driven supersonic gas infall onto collapsing objects. We also note a high elemental abundance in the outskirts of both A3562 and the SC1329-313 group, which indicate an enhanced importance of feedback effects. This has important consequences for studies of the luminosity function of objects in superclusters.
We adopted the Mpc, Mpc and 57 kpc/arcminute plate-scale, which for of the cluster corresponds to km s-1 Mpc-1, and .
1.1. Overview of the previous X-ray results on A3562
A3562, as a part of Shapley supercluster, received a wealth of observing time at X-ray wavelengths. The Einstein observatory provided a first temperature estimate (Breen et al. 1994), joint Einstein and ROSAT analysis provided detailed mass estimates (Ettori et al 1997). A filamentary X-ray structure on a several degree scale was reported by ROSAT (Kull & Böhringer 1999). Spectral analysis of ROSAT data, revealing a complex temperature structure of A3562 has been presented in Bonamente et al. (2002). A chain of clusters including A3562 and the SC1329-313 group has been covered by both ASCA (Hanami et al. 1999) and BeppoSAX (Ettori et al. 2000, Bardelli et al. 2002).
In view of the observational results and their interpretation, reported in this paper, several results of the previous satellites are particularly important, so we list them here. Of primary concern to this paper is the temperature structure of A3562, which according to our XMM-Newton results, is hotter to the south and colder to the north. This matches very well the ASCA GIS results of Akimoto et al. (2003, see their Fig.8). The temperature range, reported by ASCA for the central is keV (Hanami et al. 1999) and by BeppoSAX LECS+MECS for the central is , and a radial gradient in temperature from keV in the central 5 arcminutes to keV at radii exceeding 10 arcminutes (Ettori et al. 2000). The ROSAT PSPC temperature for the central is keV (Ettori et al. 2000).
Our XMM results reveal temperature variations in the 3.8–5.1 keV range within the central , so various temperature measurements reported before are understood as due to a different sensitivity of the detectors to underlying temperature structure. XMM results also show that the temperature structure is asymmetric and thus is not removed in an analysis using concentric annuli. The high sensitivity of XMM to the soft band yields intermediate temperatures, typically keV, when averaged by mass of the gas.
However, the residuals in the hard energy band, claimed in ASCA analysis, could partially rise from the bright quasar, off center.
Prevalence of 3 keV gas outside the central of A3562, reported by Ettori et al. (2000) is also seen in XMM data.
With respect to a nearby to A3562 group, SC1329-313, which is also a subject of our XMM observation, the ASCA observation results in a temperature estimate of keV within the central (Hanami et al. 1999), while BeppoSAX yields keV within the central (Bardelli et al. 2002). The XMM observation yields keV within the central (most of the counts come from eastern and northern side of the group). As ASCA hardness ratio maps show (Akimoto et al. 2003), this group exhibits substantial color variation, with the center of the group being colder, while to the west there is a hot spot. The XMM data do not cover the area of hot emission, and the BeppoSAX extraction area only covers it partially. This may explain the range in the reported temperatures.

2. Data and Analysis
XMM-Newton (Jansen et al. 2001) has observed A3562 as a part of the GTO program of MPE. Tab.2 details the mosaic of the cluster, where column (1) is the name of the proposed field, (2) is the assigned XMM archival name, (3) R.A. and Decl. of the pointing, (4) net Epic-pn exposure after removal of flaring episodes, (5) pn filter used, (6) XMM-Newton revolution number. All Epic-pn observations were performed using the extended full frame mode with a frame integration time of 199 ms.
The initial steps of data reduction are similar to the procedure tested on other XMM-Newton mosaics and is described in detail in Briel et al. (2003). Details of our light curve screening are found in Zhang et al. (2004). The analysis consists of two parts: estimating the surface brightness and temperature structure of the cluster and verifying it through spectral analysis. The first part consists in producing temperature estimates, based on calibrated wavelet-prefiltered hardness ratio maps and producing the projected pressure and entropy maps. Wavelet reconstruction (filtering) is used to find the structure and control its significance. The background is considered differently in imaging and spectral analysis. In the first cases we use the in-field estimate of the background for every instrument and pointing, using events furthest from both the optical axis of the telescope and bright emission zones of the A3562, where instrumental background should dominate. To subtract the estimated background from the image we assume no vignetting in spatial distribution of the background, suitable for the soft proton component (Lumb et al. 2002). Discussion of the systematics of this method is presented in Henry et al. (2004).
XMM Epic-pn log of A3562 cluster observation.
| Obs. | Pointing | net | pn | XMM | |
|---|---|---|---|---|---|
| ID | R.A Decl. | exp. | Filter | Orbit | |
| (Eq.2000) | ksec | ||||
| f1 | 0105261301 | 203.2725 -31.6917 | 33.5 | Thin | 567 |
| f2 | 0105261401 | 202.9625 -31.8000 | 7.3 | Medium | 482 |
| f3 | 0105261501 | 203.5000 -31.5069 | 7.5 | Medium | 484 |
| f4 | 0105261601 | 203.1250 -31.6236 | 15.3 | Medium | 485 |
| f5 | 0105261701 | 203.2083 -31.8694 | 14.1 | Medium | 571 |
| f6 | 0105261801 | 203.5833 -31.7403 | 4.2 | Medium | 574 |
![[Uncaptioned image]](/html/astro-ph/0405092/assets/x3.png)
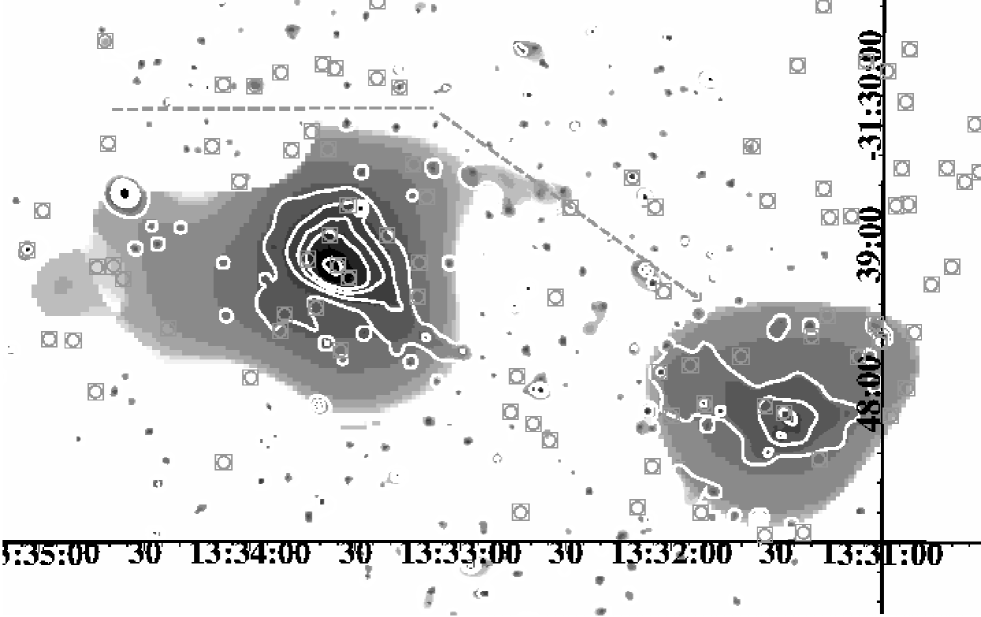
EPIC (PN+MOS) exposure map of the XMM-Newton survey of A3562 region of Shapley Supercluster, overlayed with contours of equal surface brightness in the 0.8–2 keV energy band. Coordinates correspond to epoch J2000.0.
In Fig.1 we show a wavelet reconstruction of the XMM mosaic with contours indicating the emission detected on the smallest scales from to . The surface brightness of both A3562 and the SC1329-313 group reveals distortions on the arcminute (50 kpc) scale, which were also observed previously by ASCA and BeppoSAX (Akimoto et al. 2003, Bardelli et al. 2002). The core of A3562 is characterized by a much shallower gradient in the surface brightness toward the north, as compared to that to the south and a 100 kpc enhancement in the emission toward the south-west. The morphology of the group core appears disrupted and does not reveal a single center (as indicated by presence of two peaks in contours displayed in Fig.1 as well as a zone of high emission bridging the two peaks, as seen in the color), and on the 100 kpc scale is characterized by the enhancement in the emission toward the north-east. As both enhancements in A3562 and in the SC1329-313 group point toward each other, it appears likely that there exists a connection in their origins, which we will pursue after a more detailed investigation of the nature of surface brightness distortions.
The second, spectroscopic part of the analysis uses a mask file, created based on the results of the hardness ratio analysis described above. The first application of this technique is presented in Finoguenov et al. (2004a). Specifics of the A3562 mosaic consists in having observations performed with a different filter. In our spectral analysis we combine the events obtained with both filters, use the response matrix without the filter information, and put the filter information in the arf files. Since in the merged event file, the filter information will be overwritten by one of the observations, we calculate the arf for merged observations with the medium filter (using a XMMSAS task clarf, developed by A. Finoguenov). The arf is calculated for the observation with the thin filter separately and later added. The weighting is achieved within clarf through a comparison of the exposure time stored in the PHA file and calculated for the input event file. For background removal we use the background accumulation, obtained with the medium filter, since subtle differences with the accumulation with the thin filter due to galactic foreground emission are not important for the analysis of the core of A3562, where the thin filter was used. We also use the 0.8–8 keV band in the analysis to avoid the possible complications due to a soft excess, which further reduces the differences in the backgrounds between the observations performed with the thin and medium filters.
3. Results

The advantage of XMM-Newton over previous missions consists in the ability to provide detailed temperature maps, which allows a study of pressure and entropy state of the cluster gas. In Finoguenov et al. (2004a) and Briel et al. (2003) we have developed a simple technique on how to select the regions for the spectral analysis, using both surface brightness and hardness ratio as an input. Given the observational setup, which is further illustrated in Fig.2, there is a limited ability to study the structure of the SC1329-313 group, as the total number of counts there provides only three spectra. The deep exposure on A3562 allows us to produce almost a hundred of spatially independent temperature estimates. So, while we list the properties of both A3562 and the SC1329-313 group in Tab.1 later in this section, we will concentrate on A3562 in the discussion of the 2d structure.
In our spectral analysis we use the APEC plasma code to measure the temperature, element abundance (assuming the solar abundance ratio of Anders & Grevesse 1989) and emission measure. By making an estimate of the volume, occupied by each emission component, it is then possible to recover the pressure and the entropy in absolute units. In general, volume estimates are not immediately taken as convincing, although errors resulting from it are small, typically on the 20% level (for details see Finoguenov et al. 2004a; 2004b; Henry et al. 2004). We also study projected pressure and entropy maps, where instead of the density we use the square root of the emission measure, which then includes the projected length. The second order effect due to multi-temperature components seen in projection was found to reduce the pressure enhancements due to shocks, as hotter components have lower emission measures. Also, due to the weighting of the temperature components by the density squared, X-ray analysis is mostly sensitive to the state of the most densest part in the projected length.
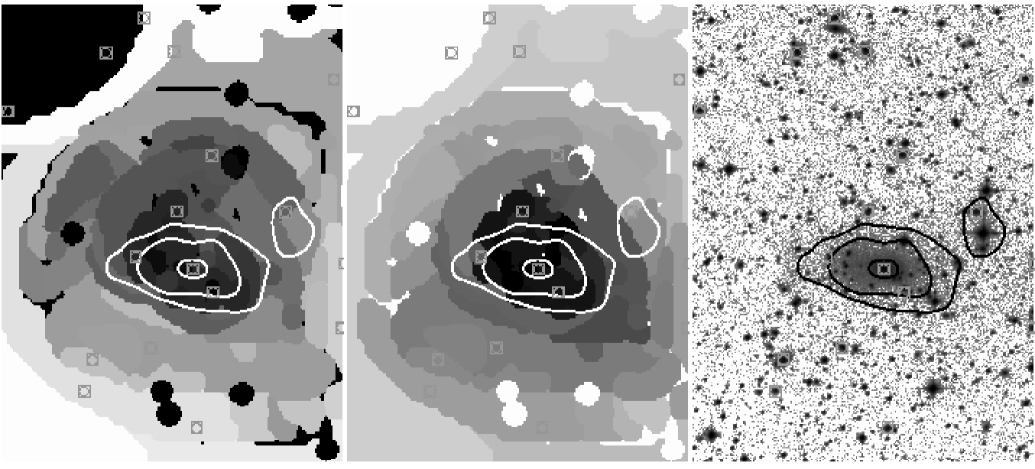
With the limitations given above, in Fig.2 we display the projected pressure and entropy maps derived in the spectral analysis. The peak of pressure and entropy is centered on the galaxy identified with the BCG of A3562 cluster by Postman & Lauer (1995), which has a heliocentric velocity of km/s.
Compared to the distribution of stars in the bright cluster galaxy (BCG) envelope, shown in overlay, both pressure and entropy of the gas is extended towards the north-east. The entropy map has an even larger extension to the north-east compared to the pressure map and breaks into two distinct tails there. The pressure map has an enhancement west to the galaxy. Thus, the core of A3562 appears to be disturbed in a number of ways. Given the importance of the large-scale entropy distribution for the picture of A3562, in Fig.3 we present the pseudo entropy map, derived as (Churazov et al. 2003; Briel et al. 2003) where is a surface brightness in the 0.8–2 keV and is derived from the calibrated hardness ratio map. This map illustrates the observed shape of the low entropy tails in A3562.
![[Uncaptioned image]](/html/astro-ph/0405092/assets/x7.png)
Entropy map of A3562, derived as . Coordinate grids are shown for the J2000.
| Radii | kT | Z | S | P | Gas mass |
|---|---|---|---|---|---|
| kpc | keV | keV | |||
| cm2 | ergs cm-3 | ||||
| A3562 | |||||
| 0–130 | |||||
| 130–300 | |||||
| 0–300 | |||||
| 300–600 | |||||
| 0–600 | |||||
| SC1329-313 | |||||
| 0–130 | |||||
| 130–600 | |||||
| 0–600 | |||||
Before proceeding with the interpretation, we first point out a degeneracy in the available solutions. Enhancements in the pressure maps could be treated either as dark matter distribution or hydrodynamic effects. The pressure enhancements discussed here occur at the 10–40% level. While these could indicate the presence of a weak shock, it is also feasible to obtain such pressure enhancements within subsonic gas motions, as soon as there is a change in the velocity of the gas. These processes are described by the Euler’s equation (e.g. Landau & Lifshitz 1959).
| (1) |
Here we neglect the action of viscosity on diminishing the velocity gradients as well as contributions of the magnetic field, which otherwise enter as
and
to the right hand side of the Eq. 1, respectively. We denote to be the magnetic field, as the velocity, as the thermal pressure, as the density, as the viscosity, as the gravitational potential.
Small changes in the entropy of the gas, characteristic of weak shocks, does not allow a robust differentiation between the two possibilities. Essentially, Eq.1 illustrates that the gas pressure traces the generalized stress tensor.
In the case of a bow-shock, there are further geometrical constrains on the appearance of the flying body, such as the angle of the bow-shock, which are not observed. The disturbed morphology of the SC1329-313 group south-west to A3562 as well as the presence of compressed gas to the south from A3562 argues in favor of a recent passage of the group. The X-rays of SC1329-313 group are centered on AM 1328-313, which is a galaxy with velocity 12928 km/s (NED). However, the galaxy has two distinct cores and redshift measurements reported with slight offset have higher velocity by 300 km/s.
The motion of the cluster core is likely to represent an oscillation in response to the passage of the subcluster, observed west to the A3562. On even large scale there is a good degree of symmetry in the pressure relative to the position of the BCG, yet with 30% pressure excess to the south. The entropy map on the large scale is also elongated in the north-south direction. One possible explanation of the observed picture would be that the cluster exhibits oscillations on two scales, on the larger scale (0.1 degree) the oscillation occurs in the north-south direction. On the smaller scale there is a significant east-west asymmetry in the pressure map. The length of the pressure enhancements to the east, where it enters into zones of lower surface brightness, supports an association of this pressure enhancement with the presence of a lateral shock caused by the passage of the SC1329-313 group.
Typical pressure enhancements are 40% and, if associated with the sloshing, imply that the oscillation velocity is 15% of the sound speed. The distribution of the entropy follows the oscillations yet at a fraction of the sound speed, typically 10–20% (e.g. Ricker & Sarazin 2001). Since the lowest entropy is found almost at the location of BCG, this scenario seems to be very likely. So, our conclusion is that the pressure enhancements are associated with a deceleration associated with the oscillation of both the BCG and the cluster. The BCG has stopped going north-east, the cluster has almost reached the most southern point in the oscillation period. We estimate the oscillation frequency of the BCG to be Gyr-1.
A question of the origin of the low entropy tails within the assumed subsonic motion of the A3562 core puts a tail of A3562 in correspondence with the remnant of the action of the Rayleigh-Taylor instability on disruption of cores of the cluster. In this scenario the change in the core velocity at the oscillation apogee produces a pull that balances the gravitation force and leads to an escape of low entropy gas. In this picture A3562 is a more advanced stage compared to A3667, where such disruption is also suggested (Briel et al. 2003). The duration of time for which such a feature is observed is determined by convective settlement of the gas to the potential minimum, as discussed elsewhere in this paper. One can not exclude, however, that the process is ongoing, which requires a different frequency (or a phase difference) for the oscillation occurring with the increasing distance from the cluster center, i.e. when the core flies to the south, the bulk of the cluster flies to the north, as has been suggested above already. Discussion of the galaxy substructure in A3562, presented in §3.2 is a strong support for this scenario. Yet another possibility is proposed by Heinz et al. (2003), who specifically considered the case of A3667. Within their scenario, the pull resulting in the Rayleigh-Taylor instability is created by the passage of the shock, which in the case of A3562 should be associated with interaction of the SC1329-313 group with the outskirts of A3562. In a summary, while it is rather certain that the Rayleigh-Taylor instability is the key process that explain the low entropy tails observed in A3562, there are a number of processes that could lead to such an observed effect.
Tab.1 lists the mass averaged properties of both the A3562 cluster and the SC1329-313 group. Col (1) specifies the radius, (2) Temperature, (3) element abundance, (4) entropy, (5) pressure, (6) the gas mass involved in weighting. As no account for the projected components is made, this is not the total gas mass within the radii quoted.
Our data on the SC1329-313 group show an interestingly high entropy level, indicating that groups in superclusters are systematically underluminous, in agreement with a study of Hanami et al. (1999), based on the relation. We attribute it to a high entropy of the intracluster gas in superclusters, possibly connected to the structure formation shocks.
3.1. Key properties of A3562
| N | Name | S | P, | ||||||
|---|---|---|---|---|---|---|---|---|---|
| keV | cm-3 | keV cm2 | ergs cm-3 | kpc | kpc | ||||
| 2 | pressure core | 0 | 65 | ||||||
| 3 | entropy core | 30 | 131 | ||||||
| 4 | main-1 | 38 | 158 | ||||||
| 5 | dove tail-1 | 92 | 265 | ||||||
| 6 | dove tail-2 | 201 | 628 | ||||||
| 7 | southern shock-2 | 223 | 377 | ||||||
| 8 | pressure ridge | 117 | 419 | ||||||
| 9 | main-2 | 101 | 363 | ||||||
| 10 | southern shock-1 | 97 | 322 | ||||||
| 11 | main-3 | 274 | 713 | ||||||
| 12 | outskirts-1 | 675 | 967 | ||||||
| 13 | outskirts-2 | 957 | 1420 |
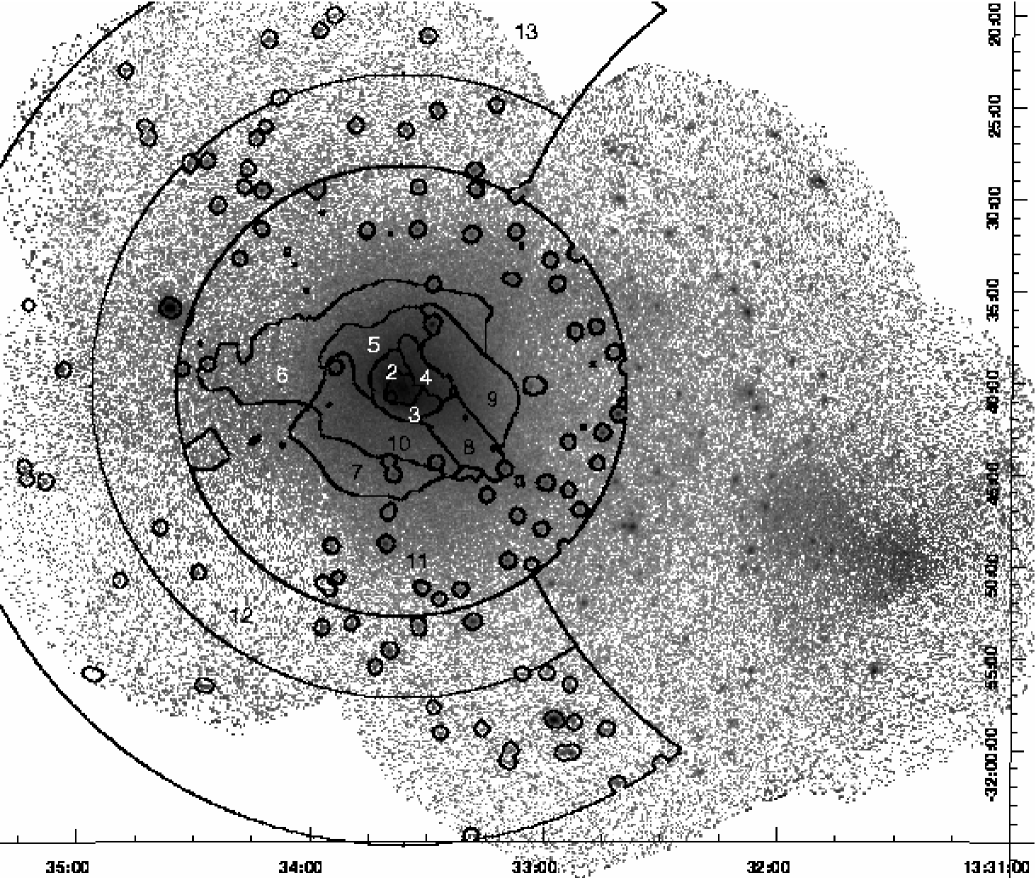

In order to tabulate the basic properties of the cluster we extracted the spectra from large zones that according to both the hardness ratio and the fine spectral analysis have similar pressure and entropy. We used the 1–10 keV energy band for the spectral analysis, as compared to 0.75–10 keV band used for the rest of the paper to avoid bias to lower temperature components resulting in this crude region selection. We list the properties obtained this way in Tab.2 with their errors for one parameter of interest. Col. (1) labels the region according to Fig.3, with the name of the region reported in (2), (3) lists temperature in keV, (4) iron abundance in solar photospheric units of Anders & Grevesse (1989). Derived quantities, that assume a center of A3562 at 203.40080, -31.67145 (equinox J2000.) and use an estimation of the projected length, as described above are reported in cols.(5–8). These are electron density, entropy, pressure and the (local) gas mass. Cols. 9–10 report the minimal and maximal distance to the extraction area. No account for the gas mass not associated with the directly observed component was attempted. Region 1, which is embedded in the region 2, is not reported in the Table as it turned to be an AGN from the X-ray spectral properties.
In Fig.3.1–3.1 we compare the obtained entropies and pressures with known scaling relations. In the adopted cosmology, estimate of the is 0.91 Mpc, where the scaling of with temperature is taken from Finoguenov et al. (2001) and the temperature of A3562 is taken as 4.3 keV. As both entropy and are scaled by a similar power of temperature, the deviation of data points in Fig.3.1 from the scaled entropy profile of Ponman et al. (2003) is not very sensitive to the adopted temperature. The normalization of the scaled entropy is taken to correspond to the clusters with temperature below 5 keV in Ponman et al. (2003).
The data show agreement with the scaling relations. The core of the cluster has higher entropy with respect to the scaling, which is typical also for the relaxed clusters (e.g. Pratt & Arnaud 2003). The dove-tale-like structure has lower entropy, but at the same time a typical pressure expected for its distance to the cluster center. The region (5) has, in addition, an iron abundance, which is similar to the core of the cluster, but higher than the rest. Comparison between regions (6) and (7) reveals almost a factor of two higher pressure of the latter, compared to lower (though comparable) entropy of the former. This results from pressure enhancement to the south, but mostly from extension of the low-entropy tails into the zones of low pressure to the north from the cluster center. Pressure discontinuities correspond to a transition zone between cluster core and the rest of the cluster, so it is difficult to estimate the unperturbed pressure value. However, comparing zones 8–10, one can see that they have a similar distance to the center and similar entropy. The ridge in the image, that corresponds to region (8), shows however only a marginal pressure enhancement, while the pressure enhancement to the south is clear and correspond to a 20% pressure enhancement. It is likely that spatial resolution of XMM-Newton data prevents us to perform a clean separation required to detect the hot component associated with the ridge, seen with Chandra (Ettori, S. 2004, private communication).
In order to provide some insights on the origin of the large-scale emission detected by Kull & Böhringer (1999), we have constructed two regions, (12–13), that reach distance from the A3562 center. Background subtraction becomes an issue for these regions and we have tried several background accumulations to test the robustness of our results. In addition to the level of instrumental background, as revealed by the data in the 5–12 keV band, we find a need to include an additional 0.2 keV component with solar element abundance typical to galactic halo emission. The XSPEC normalization, K, of this component per square arcminute is . In Tab.2 we list the hot thermal component, also seen in the spectral analysis. Given the complexity of the background situation for XMM-Newton, usual approach is to look for supporting measurement with satellites having lower background. We point out that the reported BeppoSAX LECS+MECS results of Ettori et al. (2000) yield similar temperature and pressure for parts of the A3562 cluster corresponding to our regions 12 and 13, therefore providing support that the component reported here originates from A3562. This component, having temperature of 2 keV is colder compared to the 3 keV temperature observed on the western part of A3562 (see Tab.1). State of the gas in regions 12–13 is characteristic of virial regions of clusters with already maintained pressure balance, but lower entropy level indicating either a survival of low-entropy gas or an incomplete thermalization. We point out that this situation has been observed in simulations before (e.g. Evrard et al. 1996) and correspond to the accretion zone of the cluster between virial radius and . While such entropy behavior is not unique to A3562, (e.g. Finoguenov et al. in preparation) we point out that deviations in the pressure profile from the -2.5 slope power law radial behavior are only seen in A3562 and might be a specific of supercluster environment.
![[Uncaptioned image]](/html/astro-ph/0405092/assets/x11.png)
Entropy profile of the main zones in A3562. Universal entropy scaling relation of Ponman et al. (2003) is shown with a dashed line.
![[Uncaptioned image]](/html/astro-ph/0405092/assets/x12.png)
Pressure profile of the main zones in A3562. A pressure slope of -2.5, typical for the relaxed clusters is shown with a dashed line. Normalization is done using the outmost point.
3.2. Geometry of the merger
The observed sloshing of gas, as a result of oscillations triggered by the passage of the SC1329-313 group, suggests that the group was initially flying in the western direction. After passage at perigee with A3562, the SC1329-313 group has been deflected acquiring a velocity component towards the A3562. A similar momentum in the opposite direction has been acquired by the cluster core, as for the rest of the cluster the fluctuations in the gravitational potential are negligible. Oscillations of the cluster core will be counterbalanced on the larger scale by the cluster to conserve the momentum initially acquired. An interesting confirmation of this statement comes from a comparison to a study of Bardelli et al. (1998), indicating that the major 3d galaxy concentration in A3562, T561, is displaced north to the BCG, and coincides with position of the dove-tail. The recession velocity of T561 is , similar to the velocity of the BCG, supporting therefore a subsonic motion of the later.
We suggest that the SC1329-313 group has passed north to A3562. Then A3562 is just finishing the first oscillation period. An extra half a period is required in the scenario when the group passes the cluster on its southern side. Lack of low-entropy tails in the south argue against it. Also the image of A3562 appears to be more disturbed in the north, which we relate to shock heating due to interaction of gaseous halos. In addition, the structure of the group suggests that it has a component in the southern direction.
It appears interesting to compare the conditions of the gas on the large-scale north and south from the cluster to see if it fits into the above suggested picture. The observed separation of the SC1329-313 group and A3562 is a factor 7–10 larger than the oscillation amplitude, suggesting that the characteristic Mach number of the interaction was in the 1.1–1.5 range (velocity of the group in the scale of the sound speed of the A3562 gas).
An apparent need for stronger interaction to explain the shock compared to the projected separation between A3562 and the SC1329-313 group, could partly be resolved in the significant projected velocity component, which is km/s when we formally take the velocity difference between the major galaxies. A large projected velocity difference also explains why the pressure feature appears only to the west from A3562.
The high velocity of the SC1329-313 group could further be checked by the comparison between the expected disruption of the group, occurring at the pressure level of ergs cm-3 and the suggested supersonic motion through a medium of cm-3 electron density (). The velocity of km/s, implied by this scenario, is in reasonable agreement with the other arguments.
3.3. Comparison to radio
It has been found for A754 that the faint radio emission correlates with the pressure map (Henry et al. 2004). In Fig.3.3 we provide a comparison of the radio emission (NVSS, 20 cm) with the pressure map of A3562. The point-like source represents the radio galaxy traveling through the core of A3562. There is again an association of the radio emission on the Jansky level with the pressure peak on the pressure level exceeding the ergs cm-3. Importance of the A3562 radio halo is that it is one of the weakest halos found, while A3562 is one of the coldest clusters with the presence of radio halo. The spectral index of the halo reveals its relatively young age (Venturi et al. 2000, 2003). Among abundant reacceleration mechanisms, discussed in the literature, a suggestion of Venturi et al. (2003) for A3562 on reviving of the radio plasma, seeded by the head-on radio galaxy, seems to be supported by complicated pressure structure in the core of A3562, as indicated by our data. Thus, the extent of radio emission in A3562, might be caused by the initial distribution of the seeds and not by the extent to which the shocks are propagated. Further discussion of the link between the XMM results and the radio structure of A3562 will be presented elsewhere.
![[Uncaptioned image]](/html/astro-ph/0405092/assets/x13.png)
Pressure map of A3562, overlaid with the radio contours.
4. Summary
The paper describes the results of XMM-Newton mosaic of A3562 and a nearby SC1329-313 group. The key measurements discussed are the tail of low entropy gas to the north of the core of A3562, 20% pressure enhancement to the south, and a distorted shape of the nearby SC1329-313 group. The presence of the low entropy tails is related to the action of Rayleigh-Taylor instability. The cause of both instability and the pressure enhancement could either be core oscillations induced by the passage of the group or by ongoing propagation of the shock wave through the A3562, which is induced by an interaction of the group with the outskirts of A3562. It is likely that the observed picture is the result of a combination of the two scenarios. Consideration of the projected velocity of the SC1329-313 group, a comparison of distorted shape of the group with inferred ram pressure, all support the supersonic motion of the group through the outskirts of A3562.
References
- (1) Abell, G. 1958, ApJS, 3, 211
- (2) Akimoto F., Kondou, K., Furuzawa, A., Tawara, Y., Yamashita, K. 2003, ApJ, 596, 170
- (3) Anders, E. and Grevesse, N. 1989, GeCoA, 53, 197
- (4) Bardelli, S., Pisani, A., Ramella, M., Zucca, E., Zamorani, G. 1998, MNRAS, 300, 589
- (5) Bardelli, S., De Grandi, S., Ettori, S., Molendi, S., Zucca, E., Colafrancesco, S. 2002, A&A, 382, 17
- (6) Bonamente, M., Lieu, R., Joy, M.K., Nevalainen, J.H. 2002, ApJ, 576, 688
- (7) Breen, J., Raychaudhury, S., Forman, W. Jones, C. 1994, ApJ, 424, 59
- (8) Briel, U.G., Finoguenov, A., Henry, J.P. 2003, A&A, subm.
- (9) Churazov, E., Forman, W., Jones, C., Böhringer, H. 2003, ApJ, 590, 225
- (10) Ettori, S., Bardelli, S., De Grandi, S., Molendi, S., Zamorani, G., Zucca, E. 2000, MNRAS, 318, 239
- (11) Ettori, S., Fabian, A.C., White, D.A. 1997, MNRAS, 289, 787
- (12) Evrard, A.E., Metzler, C.A., Navarro, J.F., 1996, ApJ, 469, 494
- (13) Finoguenov, A., Reiprich T., Böhringer H. 2001, A&A, 368, 749
- (14) Finoguenov, A., Pietsch, W.N., Aschenbach, B.R., Miniati, F. 2004a, A&A, 415, 415
- (15) Finoguenov, A., Böhringer, H., Zhang, Y.-Y., Schuecker, P. 2004b, A&A, subm.
- (16) Hanami, H., Tsuru, T., Shimasaku, K., Yamauchi, S., Ikebe, Y., Koyama, K. 1999, ApJ, 521, 90
- (17) Heinz, S., Churazov, E., Forman, W. and Briel, U.G. 2003, MNRAS, 346, 13
- (18) Henry, J.P., Finoguenov, A., Briel, U.G. 2004, ApJ, subm.
- (19) Jansen, F., Lumb, D., Altieri, B., et al. 2001, A&A, 365, L1
- (20) Kull, A., Böhringer, H. 1999, A&A, 341, 23
- (21) Landau, L.D., Lifshitz, E.M. 1959, Fluid Mechanics (London: Pergamon)
- (22) Lumb, D.H., Warwick, R.S., Page, M., & De Luca, A. 2002, A&A, 389, 93
- (23) Ponman, T.J., Sanderson, A.J.R., Finoguenov, A. 2003, MNRAS, 343, 331
- (24) Postman, M., Lauer, T.R. 1995, ApJ, 440, 28
- (25) Pratt, G.W., Arnaud, M., 2003, A&A, 408, 1
- (26) Ricker, P.M, Sarazin, C.L. 2001, ApJ, 561, 621
- (27) Rines, K., Geller, M., Diaferio, A., et al. 2001, ApJ, 124, 1266
- (28) Venturi, T., Bardelli, S., Morganti, R., Hunstead, R.W. 2000, MNRAS, 314, 594
- (29) Venturi, T., Bardelli, S., Dallacasa, D., Brunetti, G., Giacintucci, S., Hunstead, R. W., Morganti, R. 2003, A&A, 402, 913
- (30) Zhang, Y.-Y., Finoguenov, A., Böhringer, H., Ikebe, Y., Matsushita, K., Schuecker, P. 2004, A&A, 413, 49