2004 \SetConfTitleProceedings of the II International Workshop on Science with GTC
Formation and Evolution of Structures in the Universe
Abstract
We summarize our work on structures in different stages of aggregation, and spanning a wide range in redshift. We emphasize our work on high resdhift clusters. This comprises the analysis of 7 square degrees using deep images with several broad-band optical filters. We plan to complement these with near IR observations in 4 m telescopes. Preliminary results of the analysis in a field of 35 35 arcmin2 indicate the detection of several candidates to be clusters at redshifst . When all the fields are analyzed, we will have an adequate sample for future detailed studies with the GTC.
Presentamos un resumen de nuestro trabajo sobre estructuras del Universo en diferentes estados de agregación, poniendo especial énfasis en el estudio de cúmulos de galaxias con alto corrimienro al rojo. El mismo comprende el análisis de unos 7 grados cuadrados usando imágenes profundas con varios filtros ópticos anchos. Planeamos complementarlos con observaciones en el infrarrojo cercano con telescopios de 4 m. Los resultados preliminares de nuestro análisis en un campo de 35x35 minutos de arco indican la detección de varios candidatos a cúmulos con corrimiento al rojo mayor que 0.5. Cuando finalizemos el análisis de todos los campos dispondremos de una muestra adecuada para estudios detallados con GTC.
clusters of galaxies \addkeywordgalaxy evolution \addkeywordgalaxy formation \addkeywordcosmology
0.1 Introduction
In the last five years we have been conducting a project to analyze the morphology, kinematics, and dynamics of galaxies in different states of aggregation, from structures similar to our Local Group (Gutiérrez et al. 2002), compact groups (Gutiérrez et al. 2002), nearby clusters like Coma (Gutiérrez et al. 2004) and low redshift clusters (Trujillo et al. 2001). In these studies we have developed new techniques for the analysis of kinematics (Prada et al. 1996) and morphology (Trujillo et al. 2001) of galaxies. Here, we summarize some of the main results and present the current status of the project.
0.2 Satellite galaxies
The study of satellite galaxies is interesting for several reasons, one of the most important being the discrepancy between the observed number of such objects and the predictions of the standard cold dark matter (CDM) model (Klypin et al. 1999, Moore et al. 1999); in fact, the expected number of satellites orbiting galaxies like the Milky Way or Andromeda is an order of magnitude larger than that observed in the Local Group (Mateo 1998). This could be a strong objection against the hierarchical scenario proposed in the standard CDM model. To reconcile theory and observations several mechanisms that suppress the formation of satellites after the re-ionization in the early epoch of the Universe have been proposed (e.g., Bullock, Kravtsov, & Weinberg 2000). Satellite galaxies are also interesting for tracing the gravitational potential and for estimating the mass of the parent galaxy at distances unreachable with other methods (Erickson, Gottesman & Hunter 1999). The standard models predict a decline in satellite galaxy velocity with distance to the primary. This has been observationally explored by Zaritsky et al. (1997) and Prada et al. (2003).
Our knowledge of satellite galaxies beyond the Local Group is still very limited, owing to the intrinsic faintness of these objects. So detailed studies of external systems are limited to galaxies in the nearby Universe. The most complete compilation and study of such objects was conducted by Zaritsky et al. (1997), who presented a catalogue containing 115 satellites orbiting 69 primary isolated spiral galaxies. In Gutiérrez et al. (2002) and Gutiérrez & Azzaro (2004) we have initiated a morphological and photometric analysis of an important fraction of the objects in such catalogues. This analysis has allowed us to extend the color–color and color–magnitude diagrams known in the Local Group. We have shown that the vs. color–magnitude relation is similar to that found in the Fornax Cluster for galaxies with similar magnitudes. Figure 1 shows these relations. We also have measured the internal color gradients of nine early-type satellites and found . This study continues now with the analysis of images to study the star formation rate of such satellites, and especially the possible relation with the proximity of the parent and/or other satellites.

0.3 Clusters of galaxies
Clusters of galaxies are the largest gravitationally bound structures of the Universe and are ideal sites for testing cosmological models, especially at redshifts , where differences between competing evolutionary and cosmological models become important (see Henry 2000 and references therein).
0.3.1 Low redshift
Since Dressler (1980), it has been known that the properties of galaxies can vary depending on whether they reside in dense galaxy clusters or in the field. However, the morphology of galaxies in clusters was mostly based on visual classifications. The task of quantitative analysis had left unsolved questions such as whether the sizes of the elliptical galaxies in clusters are different from their field counterparts, or whether the properties of spiral galaxy disck, such as their scale-lengths, are affected by the enviroment. In Trujillo et al. (2001) we presented new software for studying the morphology of galaxies in a quantitative way. This method was applied to the study of the Coma cluster () and A2443 () in images taken with the Wide Field Camera (WFC) at the Isaac Newton Telescope (INT) and HIRAC at the Nordic Optical telewcope (NOT) respectively. In total we have obtained the parameters of 200 galaxies up to mag. For the Coma Cluster membership was established by means of the recessional velocity obtained from the compliation by Edwards et al. (2002), while for A2443 the membership was based on the position in the color–magnitude diagrams.
The analysis of the Coma galaxies showed several indications of the effect of the environment: for instance, in Trujillo et al. (2002) we showed that more concentrated elliptical galaxies tend to reside in denser regions within the cluster, and comparing the structural properties of the Coma cluster disk galaxies with disk galaxies in the field, we found (Gutiérrez et al. 2004) that the scale lengths of the disk galaxies in Coma are 30% smaller. This is illustrated in Figure 2.

0.3.2 High redshift
The abundance of clusters at redshift provides complementary information (Borgani et al. 2001) to that provide by the CMB anisotropies, the Hubble diagram of SNe 1a and the evolution of the galaxy power spectrum on large angular scales. This has motivated several searches for distant clusters using a variety of techniques at different wavelengths. As a result, remarkable progress has been made in recent years. However, the number of clusters discovered at high redshift is still very reduced. This makes it difficult to conduct statistical studies spanning a wide range in redshift because the structures are sparse and therefore, findings require large areas of the sky to be covered. Such large areas are not likely to be covered in the near future with X-ray or Sunyaev–Zel’dovich effect searches. The alternative that we are following is the use of wide field imaging in the optical and near IR to detect two-dimensional density enhancements complemented with the determination of photometric redshifts.
For optical data we use the released data of the NOAO () and DLS () deep surveys. With these two public surveys we have square degrees in several broad band optical filters (a few more degrees are expected to be released soon). For instance the limiting magnitude in the filter for the NOAO data is 25 mag. Previous analysis in the southern survey EIS (Benoist et al. 2002) show that the density of clusters at is per square degree, so a survey such as the one we are analyzing will provide a sample representative for statistical analysis, and for further spectroscopy with GTC.
Using the Sextractor software (Bertin & Arnouts 1996), we have built catalogues of objects comprising more than 105 objects per square degree (mostly galaxies). We have applied several methods based on two-dimensional density enhancements (e.g., Ramella et al. 2001) complemented with color and magnitude information (Gladders & Yee 2000). We also have applied the method of photometric redshifts using several codes (Fernández-Soto et al. 1999; Bolzonella et al. 2000). The methods have been tested by comparing with the known spectroscopic redshifts of objects in the field. This comparison is shown in Figure 3. We found a reasonably good agreement between spectroscopic and photometric redshifts. The rms is , although there is a small systematic effect that tends to make the photometric redshift slightly smaller than the real one. We are investigating the reasons for this.

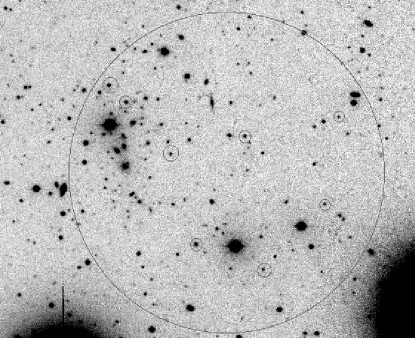
So far, we have analyzed one of the subfields of the DLS survey (see Juncosa et al. 2004, this volume) and have identified several good candidate clusters at . Figure 4 shows one of the candidates. However, the typical uncertainties in redshift at are which makes the detection of clusters difficult and produces some spurious identifications. This could be largely improved by including observations in the near IR. We therefore plan to complement these optical surveys with a wide near IR survey taking advantage of the capabilities and in particular the wide field of view of at the 3.5 m telescope at Calar Alto. This is one of the very few existing instruments that permits deep surveys (limiting magnitude of a few square degrees in the near IR in a reasonable exposure time. Follow-up of the structures detected will be carried out with spectroscopy of the member galaxies of these clusters with the Spanish GTC and its first-light instrument OSIRIS (). This will allow a deep study of physical properties such as their ages, metallicities and evolution according to redshift.
References
- Benoist et al. (2002) Benoist, C. et al. 2002, A&A, 394, 1
- Bertin & Arnouts (1996) Bertin, E., & Arnouts, S. 1996 A&AS, 117, 393
- Bolzonella et al. (2000) Bolzonella, M., Miralles, J. M., & Pelló, R. 2000, A&A, 363, 476
- Borgani et al. (2001) Borgani, S. et al. 2001, ApJ, 561, 13
- Bullock et al. (2000) Bullock, J. S., Kravtsov, A. V., Weinberg, D. H. 2000, ApJ, 539, 517
- Dressler (1980) Dressler, A. 1980, ApJSS, 42, 565
- Edwards et al. (2002) Edwards, S. A., Colless, M., Bridges, T. J., Carter, D., Mobasher, B., & Poggianti, B. M. 2002, ApJ, 567, 178
- Erickson et al. (1999) Erickson, L. K., Gottesman, S. T., & Hunter, Jr., J. H. 1999, ApJ, 515, 153
- Fernández-Soto et al. (1999) Fernández-Soto, A., Lanzetta, K. M., & Yahil, A. 1999, ApJ, 513, 34
- Gladders & Yee (2000) Gutiérrez, C. M., & Azzaro, M. 2004, ApJ (accepted), astro-ph/0404587
- Gutiérrez et al. (2002) Gutiérrez, C. M., López-Corredoira, M., Prada, F., & Eliche, M. C. 2002 ApJ, 579, 592
- Gutiérrez et al. (2004) Gutiérrez, C. M., Trujillo, I., Aguerri, J. A. L., Graham, A. W., & Caon, N. 2004, ApJ, 602, 664
- Henry (2000) Henry, J. P. 2000, ApJ, 534, 565
- Juncosa & Gutiérrez (2004) Juncosa, R., Gutiérrez, C. M., & Fernández-Soto, A. 2004 (this volume)
- Klypin et al. (1999) Klypin, A., Kravtsov, A. V., Valenzuela, O., & Prada, F. 1999, ApJ, 522, 82
- Mateo (1998) Mateo, M. L. 1998, ARA&A, 36 435
- Moore et al. (1999) Moore, B., Ghigna, S., Governato, F., Lake, G., Quinn, T., Stadel, J., & Tozzi, P. 1999, ApJ, 524, L19
- Prada et al. (2003) Prada, F. et al. 2003, ApJ, 598, 260
- Prada et al. (1996) Prada, F., Gutiérrez, C. M., Peletier, R. F., & McKeith, C. D. 1996, ApJ, 463, L9
- Ramella et al. (2001) Ramella, M., Boschin, W., Fadda, D., & Nonino, M. 2001, A&A, 368, 776
- Trujillo et al. (2001) Trujillo, I., Aguerri, J. A. L., Cepa, J., & Gutiérrez, C. M., 2001, MNRAS, 321, 269
- Trujillo et al. (2001) Trujillo, I., Aguerri, J. A. L., Gutiérrez, C. M., & Cepa, J. 2001, MNRAS, AJ, 122, 38
- Trujillo et al (2002) Trujillo, I., Aguerri, J. A. L., Gutiérrez, C. M., Caon, N., & Cepa, J. 2002, ApJ, 573, L9
- Zaritsky et al. (1997) Zaritsky, D., Smith, R., Frenk, C., & White, S. D. M. 1997, ApJ, 478, 39