An Overdensity of Extremely Red Objects
Around Faint
Mid-IR galaxies
We have searched for Extremely Red Objects (EROs) around faint mid-IR selected galaxies in ELAIS fields. We find a significant overdensity, by factors of 2 to 5, of these EROs compared to field EROs in the same region and literature random field ERO counts. The excess is similar to that found previously in the fields of known high redshift quasars and AGN. While with the present data it cannot be definitely shown whether the overdensity is physically connected to the mid-IR source, a derived radial distribution does suggest this. The fraction of EROs among -selected galaxies is high in the mid-IR fields in agreement with the picture that the EROs responsible for the overdensity are members of high redshift clusters of galaxies. We find selected EROs to be more clustered around the mid-IR galaxies than EROs, though statistics are weak because of small numbers. However, this would be consistent with a cluster/galaxy group scenario if, as we argue, the former colour selection finds preferentially more strongly clustered early type galaxies, whereas the latter selection includes a larger fraction of dusty EROs. Finally, using the mid-IR data, we are able to limit the fraction of ULIRG type very dusty EROs at magnitude to less than % of the total ERO population.
Key Words.:
galaxies: evolution – infrared: galaxies – cosmology: observations – galaxies: clusters: general1 Introduction
Galaxy formation and evolution is undoubtedly one of the major issues under debate in modern astronomy and cosmology. On the observational side, there has been a great effort to gather samples of galaxies against which the successes and short-comings of galaxy formation models can be weighed. Two useful approaches are determining the space densities and ages of the most massive galaxies at and beyond , and identifying clusters or proto-clusters of galaxies at those redshifts.
The definition of Extremely Red Objects (EROs) for example by colours of , is motivated by this selection pin-pointing the crucial evolved and most massive galaxies at from optical and near-infrared extragalactic imaging surveys. The models are often presented as two extremes, where on one side there are monolithic collapse models (e.g. Eggen, Lynden-Bell & Sandage Eg62 (1962); Larson La75 (1975)) with pure luminosity evolution, and on the other hierarchical assembly scenarios (e.g. White & Rees Wh78 (1978); White & Frenk Wh91 (1991); Somerville & Primack So99 (1999); Cole et al. Co00 (2000)). The predicted numbers of evolved galaxies at high redshift have been very different, at least until recently (see eg. Somerville et al. So04 (2004)), and thus in principle easy to test against observations. However, in addition to the fact that reality possibly is some mix of models (e.g. Roche et al. Ro02 (2002)), the results from observed numbers of high- ellipticals have also been inconclusive.
There are two difficulties in interpreting the ERO number count results. First of all, the extreme red colours can be attributed also to dust reddened starburst galaxies thus contaminating the old distant early type samples (see e.g. recent papers by Cimatti et al. Ci03 (2003); Yan & Thompson Ya03 (2003); Takata et al. Ta03 (2003); and references therein). According to Cimatti et al. (Ci02 (2002)) and Smail et al. (Sm02 (2002)) % of EROs at typical ERO brightnesses of might be dusty. At brighter levels, , we find a smaller percentage % of dusty EROs (Väisänen & Johansson 2004, hereafter Paper I). Recent HST morphological studies have complicated the picture somewhat by finding large fractions of disk galaxy EROs (Yan & Thompson Ya03 (2003); Moustakas et al. Mo04 (2004); Gilbank et al. Gi03 (2003)). In addition to morphological, spectroscopic, or colour property methods, the separation of dusty and early type EROs can also be done using detections at longer wavelengths, where ellipticals are not expected to radiate much. For attempts in sub-mm to radio see e.g. Mohan et al. (Mo02 (2002)), Smail et al. (Sm02 (2002)), Wehner, Barger, & Kneib (We02 (2002)), Webb et al. (We04 (2004)). In Paper I we used for the first time a mid-IR data-set to select dusty EROs – the difference of ellipticals and starforming galaxies is very large also in the mid-IR, and e.g. the identification problems of large sub-mm beams can be avoided. However, the exact relative fractions of different types of EROs as a function of magnitude is still an open question.
The second reason for varying numbers of EROs is their strong clustering (Daddi et al. 2000a ; Firth et al. Fi02 (2002); Roche et al. Ro02 (2002)), which is in fact expected if EROs are the counterparts of present day massive ellipticals. This clustering ties the ERO studies together with the second approach to understanding galaxy and large scale structure formation, namely the search for high redshift clusters of galaxies (see e.g. Olsen et al. Ol99 (1999); Gonzalez et al. Go01 (2001); Bahcall et al. Ba03 (2003); Mullis et al. Mu03 (2003)). It is feasible that EROs are found in clusters and concentrations of EROs can be used to locate high- clusters of galaxies.
Significant overdensities of EROs, compared to large field surveys, have been found in high- AGN and QSO fields (e.g. McCarthy, Persson, & West Mc92 (1992); Hu & Ridgeway Hu94 (1994); Dey, Spinrad, & Dickinson De95 (1995), Cimatti et al. Ci00 (2000); Chapman, McCarthy & Persson Cha00 (2000); Hall et al. Ha01 (2001); Sánchez & González-Serrano Sa02 (2002); Best et al. Be03 (2003); Wold et al. Wo03 (2003)). As discussed in these studies, it is not yet clear whether the overdensity is necessarily physically connected to the AGN: it is also possible that the EROs would be part of foreground overdensities of galaxies which enhance the probability of detection of these AGN via gravitational lensing (see e.g. discussion in Wold et al. Wo03 (2003)). Nevertheless, in either case the EROs can be used to identify candidates for high redshift galaxy clusters, and thus once again present themselves as an important window into the galaxy and structure formation era of the Universe.
We present here a NIR survey performed in the European Large Area ISO Survey (ELAIS; Oliver et al. Ol00 (2000)) fields, and derive surface densities of EROs. Rather than a survey with large continuous sky coverage (as in Paper I) the deeper NIR data-set of the present paper consists of numerous individual pointings around faint ELAIS ISOCAM detections or blank fields. We make use of the newly available Final band merged ELAIS Catalogue (Rowan-Robinson et al. Row04 (2004); Vaccari et al. 2004) and a publicly available optical survey.
In particular, as the main aim of this paper, we compare the distribution of EROs in “random” fields to those fields which are occupied by faint mid-IR detections. We are thus able to determine whether there are similar overdensity biases of EROs as in the case of verified high- AGN. Similar results are expected at least to some extent, since a significant fraction of faint ISOCAM sources appear to be AGN at (e.g. Fadda et al. Fa02 (2002); La Franca et al. La04 (2004); Johansson, Väisänen & Vaccari 2004, in prep.). As mentioned, locations of ERO overdensities may serve as candidates for high-redshift clusters and groups of galaxies, whose history in turn place strong constraints on structure formation scenarios. A demonstrated link between ERO concentrations and specific classes of sources (in this case AGN or certain mid-IR galaxies) would then further facilitate finding the crucial clusters using data such as large MIR surveys with the Spitzer Space Telescope.
The structure of this paper is as follows. In Sect. 2 we present the observational data. In Sect. 3 the properties of the ERO samples are defined and analysed, and Sect. 4 discusses the overdensity of EROs. We assume throughout this paper a flat () cosmology with , and .
2 Observations
2.1 ISO data
The ISO data used in this study comes from the Final band-merged ELAIS catalogue (Rowan-Robinson et al. Row04 (2004); Vaccari et al. 2004). For further description of the ELAIS project, observations, data reduction, source extraction and extragalactic source counts see Oliver et al. (Ol00 (2000)), Serjeant et al. (Se00 (2000)), and Efstathiou et al. (Ef00 (2000)). The observations used in this study were primarily made using the ISOCAM (Cesarsky et al. Ce96 (1996)) LW3 filter at 15 m.
2.2 Near-Infrared data
The observations presented here were carried out with the 3.0-m NASA Infrared Telescope Facility (IRTF) on Mauna Kea, and were conducted in the ELAIS fields N1 and N2, centered at and J2000.0 respectively. The data were acquired during five photometric nights in June 1998, and the seeing varied between . The data set consists of images taken at (very preliminary) ISOCAM detection positions where no obvious counterparts were found in the Digital Sky Survey (DSS). The sample used here consists of a total of 33 images. Of these, 9 were taken from the ELAIS N1 region and 24 from the ELAIS N2 region. The total surveyed area is . These areas are small non-continuous regions of the entire ELAIS N1 and N2 fields, which cover a continuous area of .
We used the NFSCam instrument containing a format InSb detector array. A pixel scale was used for all observations. Images were constructed from co-added dithered frames using standard NIR data reduction methods (such as in DIMSUM) written as IDL procedures. The final images have a field of view of . The total integration times were in the range of 20 – 30 minutes and the limiting magnitude for the deepest images was around .
2.3 Optical data
Optical photometric data were obtained from the Isaac Newton Telescope (INT) Wide Field Survey (WFS). The WFS data are publicly available on the Cambridge Astronomical Survey Unit (CASU) homepage111http://archive.ast.cam.ac.uk/. See McMahon et al. (Mc01 (2001)) for a review of the INT Wide Field Survey Project. We use data consisting of Vega-based band photometry (the apostrophes are dropped henceforth). The filters are similar to the SDSS (Sloan Digital Sky Survey) filters (Fukugita et al. Fu96 (1996)). We heavily rely on the bands, and use the following filter transformations to the standard Cousins system (Landolt La92 (1992); WFS webpage222http://www.ast.cam.ac.uk/wfcsur/index.php): and . Our adopted detection limits for a seeing are , , and (WFS webpage). For further details on the pipeline processing of INT wide field survey data consult Irwin & Lewis (Ir01 (2001)) and Gonzalez-Solares et al. (Go04 (2004)) for discussion of the WFS data in ELAIS fields in particular.
2.4 Other data
In addition to 90 and 175 m, and 20 cm data available in the ELAIS catalogue, we checked several other separate surveys in the same region. A region of the ELAIS N2 field has been surveyed in the sub-millimetre with SCUBA to a limit by Scott et al. (Sc02 (2002)). In the x-ray, the ROSAT (0.1-2 keV) all-sky survey was cross-correlated with ELAIS sources (Basilakos et al. Ba02 (2002)) and deep 75 ks Chandra observations were performed in N1 and N2 regions (Almaini et al. Al03 (2003); Manners et al. Ma03 (2003)). None of these surveys produced overlapping sources with the final list of EROs analyzed in this paper. In the same N2 area Roche et al. (Ro02 (2002)) have performed a deeper study of the clustering, number counts and morphology of EROs. Only one of our IRTF images overlaps with this very well studied region.
2.5 Astrometry and photometry
The final astrometry of the IRTF data was obtained by matching the visible sources with with Hubble Guide Star Catalog 2 objects (GSC2, available at the GSC homepage333http://www-gsss.stsci.edu/gsc/GSChome.htm) giving us an accuracy of . The INT astrometry was derived using GSC objects, which results in an external astrometric accuracy of (Irwin & Lewis Ir01 (2001)).
The photometry and calibration of the optical INT Wide Field Survey data were obtained from the archives (Irwin & Lewis Ir01 (2001); Gonzalez-Solares et al. Go04 (2004)).
All our near-IR photometry is performed using the SExtractor software (v.2.2.1 and v.2.3; Bertin & Arnouts Be96 (1996)). For detecting objects in the IRTF data we used the following SExtractor settings: a 1.25 (translating to mag for integration times min and mag for those with 10–15 min) detection threshold in a minimum area of 5 pixels (), with a detection filter of 2.5 pixels Gaussian FWHM, approximately matching the seeing.
For total magnitudes, the SExtractor BEST-magnitude was used – it is most often the Kron-magnitude (Kron Kr80 (1980)), where an elliptical aperture for photometry is defined by the shape and size of the detected object. We found these magnitudes to be robust over a wide range of magnitudes and source profiles and contain (nearly) all of the object flux. In very crowded regions the BEST-magnitude can also be the isophotal magnitude instead. However, since the WFS data is given in 2.4″ diameter apertures, we calculated corresponding aperture magnitudes from the IRTF images. All optical-near-IR colours given in this paper are thus calculated using matched apertures.
As mentioned, the deepest parts of the NIR data reach . Noticeable incompleteness starts affecting NIR source counts at mag. Since we are interested in the very reddest sources, and the detection limits of the optical bands are we will not consider NIR sources fainter than in this paper. We thus do not need any completeness corrections to number count data.
The magnitude calibration was determined from short exposures of UKIRT faint standard stars and HST/NICMOS IR standards. From these observations a magnitude zeropoint of 21.47 was derived, which is consistent with the IRTF/NFSCAM manual value. We estimate our -band photometry to be accurate within 0.06 mag. We also note that the ERO list in Roche et al. (Ro02 (2002)) has 4 objects within one of our IRTF frames. Of these, 3 have fully consistent magnitudes though the fourth is 0.7 mag brighter in our catalogue.
3 Construction of the ERO samples
3.1 Definition of EROs
Numerous different selection criteria have been defined for EROs, including , , , with -magnitude upper limits from 18 to 20. In this paper we use the following definition for EROs: and/or . Using the colour transformations given in Sec. 2.3 above, and typical colours of our objects, (see e.g. Fig. 2 of Paper I), it is seen that our choices correspond to the widely used , ERO selection criteria. All ERO selections are designed for selecting early type galaxies at – however, we note that since the model colours that different authors use vary, there might easily be 0.1-0.3 mag differences in the colours at . The elliptical galaxy models we used (GRASIL library; Silva et al. Si98 (1998)) become EROs at with the criteria defined above.
Figure 1 shows and model colours of several representative galaxies against redshift, along with the ERO criteria. Model SEDs are adopted from the GRASIL library (Silva et al. Si98 (1998); a sample set of model SEDs and procedures to calculate more are available online444http://web.pd.astro.it/granato/). Ordinary spirals never reach the red colours of EROs, while both ellipticals and reddened starbursts become EROs when seen beyond . For comparison, the colour of the prototype dusty ERO HR10 is also plotted as a function of redshift. The lowest panel shows the flux ratio – the degeneracy in the red colours of old ellipticals and dusty starbursts is clearly broken.

3.2 Matching of optical and NIR data
The optical counterparts of near-IR sources were extracted from the INT WFS catalogue using a 1.5″ search radius. Since the WFS catalogue contains multiple detections of the same source (due to overlapping CCD frames), optical counterparts within 0.5″ were averaged. After the purging, the brightest optical source of any remaining multiple counterparts was selected. There were NIR sources which were undetected in the WFS catalogue. This is expected, since the IRTF survey goes somewhat deeper than the WFS data. For undetected sources the respective limiting magnitude was assigned as the limiting brightness.
3.3 Star vs. galaxy separation
Next, stars were separated from galaxies. Stellarity indices are available from both the NIR catalogue (the SExtractor CLASS parameter) and the WFS catalogue, where a flag defines galaxies, definite stars, and various degrees of uncertain stellarities. Since the IRTF data is deeper the NIR data provide more reliable classifications than the WFS.
For the EROs we are interested in, the reddest and faintest objects in the lists, we found that a colour selection works at least as well, if not better, than the morphological separation. Please refer to Sect. 3.3 and Fig. 2 in Paper I, where a separating line of for galaxies is derived. At the regime there is no overlap between the populations. In essence, very late type cool stars (in particular of spectral type L) can have optical to NIR colours very similar to extragalactic EROs (e.g. Dahn et al. Dah02 (2002)). However, the colour is for these stars, whereas galaxies are bluer. Using this colour, extremely red stars can be discarded from the ERO samples.
In practice, we used a combination of methods: At we define the stellar sources according to NIR morphology (those with CLASS0.5). At those with CLASS0.5 and a stellar colour are assigned as stars (if detected optically, only morphology used if no optical detection was available). We find 128 stars at mag, which is in very good agreement with the prediction of 115 stars for these fields from the Galactic foreground point source model SKY (Cohen et al. Co94 (1994); see also Väisänen et al. Va00 (2000)). As for the colours of stars, approximately 55% and 35% of objects redder than (i.e. are found to be stars at the limits and , respectively. These are very consistent with respective values calculated from the stellar distribution model of Jarrett (Ja92 (1992); Wold, private communication; Wold et al. Wo03 (2003)). In summary, it should be noted that in contrast to fainter ERO surveys, brighter ERO surveys are significantly contaminated by very cool stars in our own Galaxy.
3.4 Extraction of EROs
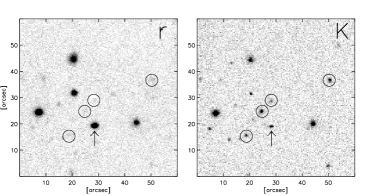
We searched for EROs from the resulting galaxy catalogue according to the colour definitions given above in Section 3.1. Only NIR detections at level and over were considered. As already mentioned, there were 118 sources which were not detected to the WFS survey limits: These are assigned magnitudes of and , and thus may enter our ERO catalogue with colours and . We then went through the resulting list checking our NIR maps as well as the WFS CCD images for any obvious spurious objects. Ultimately there were 27 EROs in the matched IRTF catalogue using the criterion and 27 using the limit — 14 EROs are common to lists resulting from both selection criteria, i.e. there were 40 EROs found in total (Table 2). Note in particular that 19/40 of the EROs have only upper limits in optical bands, ie. come from among those 118 sources detected only in the NIR. An example of an ERO field is shown in Fig. 2.
The total numbers of verified EROs are summarized in Table 1, along with some other survey characteristics. Colour-magnitude plots are shown in Fig. 3. We also note that of the 4 common EROs with the Roche et al. (Ro02 (2002)) catalogue, one is excluded from our survey as a star and another because of detection levels (i.e. it is not detected in the WFS, but a magnitude does not necessarily make it an ERO as far as our data is concerned).

| Area | EROs | ||||||||||
| (1) | (2) | (3) | (4) | (5) | (6) | (7) | (8) | (9) | (10) | (11) | (12) |
| IRTF | 722 | 128 | 74 | 19.5 | 3.80 | 2.90 | 27 | 27 | 14 | 0.36 | 0.122–0.189 |
| RA (J2000) | DEC (J2000) | ||||||
|---|---|---|---|---|---|---|---|
| 1 | 242.275418 | 54.967102 | |||||
| 2 | 242.365120 | 54.469628 | |||||
| 3 | 248.588973 | 41.052093 | |||||
| 4 | 248.593709 | 41.053258 | |||||
| 5 | 248.597116 | 41.044969 | |||||
| 6 | 248.925210 | 40.985268 | |||||
| 7 | 248.927333 | 40.982732 | |||||
| 8 | 248.931334 | 41.136512 | |||||
| 9 | 248.964062 | 41.101228 | |||||
| 10 | 248.994868 | 41.063800 | |||||
| 11 | 249.022827 | 40.783118 | |||||
| 12 | 249.059398 | 40.794446 | |||||
| 13 | 249.222717 | 40.992068 | |||||
| 14 | 249.311503 | 41.158857 | |||||
| 15 | 241.931449 | 55.037148 | |||||
| 16 | 242.382161 | 54.471598 | |||||
| 17 | 242.984000 | 54.705978 | |||||
| 18 | 248.598040 | 40.953026 | |||||
| 19 | 248.655921 | 40.951751 | |||||
| 20 | 248.870571 | 41.003286 | |||||
| 21 | 248.880417 | 41.007793 | |||||
| 22 | 248.880647 | 41.005380 | |||||
| 23 | 248.915574 | 40.988594 | |||||
| 24 | 248.936320 | 41.151117 | |||||
| 25 | 249.062402 | 40.825955 | |||||
| 26 | 249.311868 | 41.159109 | |||||
| 27 | 249.349512 | 41.090600 | |||||
| 28 | 242.362595 | 55.183170 | |||||
| 29 | 242.382952 | 54.472045 | |||||
| 30 | 242.570354 | 55.116371 | |||||
| 31 | 248.587252 | 40.971250 | |||||
| 32 | 248.589808 | 41.050045 | |||||
| 33 | 248.884767 | 41.009763 | |||||
| 34 | 248.923854 | 40.986371 | |||||
| 35 | 248.929511 | 41.137141 | |||||
| 36 | 248.930122 | 41.131120 | |||||
| 37 | 249.024081 | 40.781571 | |||||
| 38 | 249.047083 | 40.814442 | |||||
| 39 | 249.103560 | 41.404861 | |||||
| 40 | 249.234015 | 40.996663 |
4 Discussion
4.1 Separation of dusty and early type EROs
One of the motivations of this study is to attempt the se-paration of dusty EROs from the evolved early type population using mid-IR data. As seen in the lowest panel of Fig. 1 the flux ratio is below unity for an elliptical galaxy in the redshift range of , whereas the ratio is for a typical dusty ERO. The ratio is thus in principle a very powerful discriminator between dustfree and dusty EROs.
What fraction of the EROs, to a given flux limit, are detected in the mid-IR? Because our survey is not a pure field survey, but rather a targeted one, we cannot answer the question in general. Various limits can be obtained, however.
One clear ISO-ERO, and two ambiguous cases were detected among the total of 40 IRTF EROs. In one of the ambiguous cases, an ISOCAM source lies within 3″ of both an ERO and a spectroscopically confirmed non-ERO Sy1 galaxy at which is selected as the counterpart in the ELAIS catalogue (Rowan-Robinson et al. Row04 (2004)). In the other ambiguous case a MIR source is associated with a optical spectroscopic detection of a “spiral” galaxy in the ELAIS catalogue. However, the optical-NIR magnitudes, colours and size of this galaxy are that of Im type, and the strong 6.7 and 15 m emission detected would be difficult to understand (unless the source is a strong starburst or AGN, which should have been obvious from the spectrum). Instead, there is a very red ERO 6″ away to which the IR SED would fit much better (the positional uncertainty of the ELAIS MIR catalogue is ″). In fact, the preliminary ELAIS source in the source list used at the time of our NIR observations, was closer to this ERO than the dwarf.
If we assumed that the IRTF frames are a non-biased sample of the NIR sky, we would derive a lower limit of % for the dusty EROs in the total ERO population (ignoring detection limits for the moment). In fact, the assumption is not totally incorrect, since only 1/3 of our frames contain a ISOCAM source (the reason being the prelimary source list).
However, it is important to stress that the ELAIS mid-IR detection limit of mJy at 15m results in severe limitations. This detection limit corresponds to, for example, a starburst galaxy of brightness, with a SED shape of M82 located at . This would already be very close to the ULIRG limit of (see also e.g. Elbaz et al. Elb02 (2002)), and all our EROs are fainter than this in the NIR. As discussed in Paper I, deeper mid-IR imaging with e.g. the Spitzer/SIRTF mission, is clearly needed to detect counterparts of those dusty EROs which are not (ultra)luminous IR galaxies.
As for the more extreme dusty sources, an ARP220 SED-type object at and would have mJy at 15m, and thus should be readily detected by the ELAIS survey. For comparison with other dusty ERO searches (eg. Smail et al. Sm02 (2002)) this example case extreme dusty ERO corresponds to a star formation rate of (as calculated from Mann et al. Ma02 (2002) using total IR luminosity). At we have 16 IRTF EROs, and a maximum of two of them are detected in the mid-IR (the two ambigous cases). Since we were specifically targeting ISOCAM sources and thus would be biased to dusty EROs, we can assign a strong upper limit of % for EROs being strong starbursts of ULIRG type.
Separation of more quiescent EROs using broad band colours is difficult because of the lack of optical detections (or band data) for many of the EROs. However, we do note that for example EROs #15–27 in Table 2 are the same population as that identified in Paper I as early type galaxies based on their red but bluer colours (or equivalently, red and blue colour, see e.g. SEDs in Fig. 7. of Paper I). Since part of the other EROs are expected to also be ellipticals, the indication is totally consistent with other studies finding the early type vs. dusty EROs to be somewhere around 50% with a large uncertainty. We also calculated photometric redshifts for those of our EROs which have photometric detections in three or more bands using the HYPERZ code (Bolzonella, Miralles & Pelló Bo00 (2000)): These 14 EROs have redshifts ranging from 0.7 to 1.5, with an average of . Nearly all of them, 12/14, are best fitted by an evolved stellar population of at least Myr old after an instantaneous starburst, i.e. essentially an elliptical.
4.2 ERO counts and surface densities
We detect a total ERO surface density at of in the IRTF sample, depending on the colour selection criteria. See Table 3. At we have selected EROs. These IRTF counts are a factor of higher than average literature counts using the equivalent , limits: Daddi et al. (2000a ) give , Roche et al. (Ro02 (2002)) find objects. Yan & Thompson (Ya03 (2003)) give a compilation of numerous counts with different selection criteria, including , , and , which have an approximate average of at .
Some of the differences between the surface densities of the samples may of course be attributed to different selection criteria and different photometric measurement methods. Previous surveys have however found large field-to-field variations in ERO densities. As will be discussed in the next section, the apparent overdensity of our IRTF EROs results from strong clustering of bright EROs around several ISOCAM targets.
| All frames (area 74 arcmin2) | |||||||||
| limit | |||||||||
| (mag) | N | N | N | ||||||
| 3 | 0.041 | 2 | 0.027 | 2 | 0.027 | ||||
| 14 | 0.189 | 11 | 0.149 | 9 | 0.122 | ||||
| 27 | 0.365 | 12 | 0.162 | 19 | 0.257 | ||||
| 27 | 0.365 | 12 | 0.162 | 27 | 0.365 | ||||
| ISO frames (area 17.2 arcmin2) | |||||||||
| N | N | N | |||||||
| 2 | 0.116 | — | 1 | 0.058 | — | 1 | 0.058 | — | |
| 8 | 0.465 | 3.4 | 6 | 0.349 | 3.1 | 3 | 0.174 | 0.6 | |
| 13 | 0.756 | 2.6 | 7 | 0.407 | 3.8 | 7 | 0.407 | 1.1 | |
| 13 | 0.756 | 2.9 | 7 | 0.407 | 3.7 | 12 | 0.698 | 2.3 | |
| field frames (area 56.4 arcmin2) | |||||||||
| N | N | N | |||||||
| 1 | 0.018 | 1 | 0.018 | 1 | 0.018 | ||||
| 6 | 0.106 | 5 | 0.089 | 6 | 0.106 | ||||
| 14 | 0.248 | 5 | 0.089 | 12 | 0.213 | ||||
| 14 | 0.248 | 5 | 0.089 | 15 | 0.266 | ||||
4.3 ERO excess around ISOCAM fields
The ERO distribution is not uniform, qualitatively there are clearly more EROs in IRTF frames which also have an ISOCAM galaxy. The contrast is even larger when only faint MIR sources are considered. To obtain the result quantitavely, we calculated the surface densities of EROs within 90″ radii around those m ISOCAM sources which had spectroscopic or photometric redshifts above or which did not have redshift estimates (i.e. the faintest NIR cases with no optical counterparts to WFS limits). The search radius was selected to roughly match sizes of central regions of rich clusters at , where 90″ corresponds to Mpc. Cases where an ISOCAM source fell outside the IRTF frame but closer than 90″ from our NIR data, were included for the appropriate part of the frame area. The nearby, ISO-galaxies were excluded and added to the field sample, with one exception: we chose to assign source ELAISC15_J163541.7+405900, the second “ambiguous” source in Sect. 4.3, for reasons discussed therein, to an ERO 6″ away with a photometric redshift of instead of the official ELAIS catalogue identification of a spiral. The main results of this paper do not change with this decision, and results will also be given for the case with a contrary decision. The relevant ISO sources are listed in Table 4 with the corresponding number of detected EROs.
For the 20 ISOCAM source related EROs in an area of 17.2 arcmin2, we get a surface density of , whereas for the “field ERO” sample, N=20 in 54.6 , the surface density is . We calculated the densities in true non-MIR frames and nearby-MIR frames also separately: the results are 0.35 (N=14) and 0.38 (N=6) EROs per arcmin2, respectively. Changing the category of the 4 EROs found around ELAISC15_J163541.7+405900, the ISO-source ERO density would decrease to 1.06 arcmin2 and the field density increase to .
4.3.1 The EROs in ISO fields
Figure 4 shows the cumulative IRTF counts separated into the ISOCAM source related EROs (triangles) and field EROs (circles).
We note that the surface density measured from the ISOCAM frames is fully consistent with ERO surveys performed in fields of high- AGN, radio galaxies, or radio-loud QSO (eg. Wold et al. Wo03 (2003); Cimatti et al. Ci00 (2000); Hall & Green Ha98 (1998)). With this in mind, it is interesting to test how our EROs correlate with the ELAIS final catalogue radio-sources. We searched for EROs around (45″ radius used) VLA 1.4 GHz detections with spectroscopic or photometric redshifts of . The ERO density becomes , twice as high as the “field” value. We note that 2 of the 8 ISOCAM sources listed in Table 4 are also radio sources; also, 3 other listed cases have a radio source in the searched area. Thus, there clearly is no one-to-one corresponce of radio and mid-IR detections, though there is overlap. Further study of the relation of the mid-IR sources to the VLA sources is out of the scope of the present paper.
4.3.2 The field EROs
The derived field ERO surface density is totally consistent with other field ERO surveys. The surface density of EROs provides a constraint for passive evolution and hierarchical galaxy formation models. However, since the present survey does not add significantly to the covered area of large random field ERO surveys at the depth of our survey, we do not discuss the implications of surface density in detail here. Merely for reference, we plot a model from Daddi et al. (2000b ) in Fig. 4, which predicts the number of EROs resulting from a single -folding time Gyr starburst at and pure luminosity evolution since. It is seen that our IRTF counts, along with brighter counts from our Paper I and literature counts in the range fit this PLE model remarkably well.
| ISO Object | N EROs | Redshift | |
|---|---|---|---|
| 1 | ELAISC15_J163417.9+405653 | 2 | 1.0 |
| 2 | ELAISC15_J163515.6+405608 | 0 | 2.5 |
| 3 | ELAISC15_J163531.1+410025 | 4 | 1.150 |
| 4a | ELAISC15_J163541.7+405900 | 4 | 0.9 |
| 5 | ELAISC15_J163543.1+410750 | 4 | – |
| 6 | ELAISC15_J163615.7+404759 | 3 | 0.9 |
| 7 | ELAISC15_J163655.8+405909 | 2 | 2.610 |
| 8 | ELAISC15_J163730.9+410447 | 1 | – |
| 9b | ELAISC15_J160718.9+544406 | 0 | – |
| 10 | ELAISC15_J160741.1+550152 | 1 | 0.3 |
| 11 | ELAISC15_J161013.4+550648 | 1 | 0.4 |
| 12 | ELAISC15_J161101.3+543331 | 0 | 0.235 |
| 13 | ELAISC15_J161103.0+543220 | 0 | 0.147 |
| 14 | ELAISC15_J163359.3+410917 | 0 | 0.137 |
| 15 | ELAISC15_J163414.2+410317 | 4 | 0.040 |
| 16 | ELAISC15_J163629.1+411441 | 0 | 0.4 |
| 17 | ELAISC15_J163640.0+405538 | 0 | 0.106 |

4.4 Significance of the ERO overdensity
Our IRTF sample is non-continuous in sky coverage and we are unable to perform quantitative clustering analysis with the sample. However, since EROs are found to be strongly clustered in random field surveys (e.g. Daddi et al. 2000a ; Roche et al. Ro02 (2002)), it is important to estimate the significance of the excess surface densities found above. We follow here the treatment of Wold et al. (Wo03 (2003)). The significance of the excess can be given by
| (1) |
where is the total number of EROs in the fields of ISOCAM mid-IR galaxies, and is the number in the field IRTF frames. The expected field count fluctuations are given by and can be calculated from
| (2) |
where is the amplitude of the field ERO angular two-point correlation function and the “integral constraint” necessary to correct for the finite survey area (see e.g. Daddi et al. 2000a ; Roche et al. Ro02 (2002)). We use the correlation amplitude values from the large area ERO clustering survey of Daddi et al. (2000a ) which matches well our magnitude range of , and is consistent at the faint end with other determinations (Roche et al. Ro02 (2002, 2003); Firth et al. Fi02 (2002)). In addition, Daddi et al. (2000a ) find that the following approximation, which we also adopt, fits the actual detected clustering: , where the area is expressed in arcmin2.
Our survey area for the mid-IR frames is 17.2 arcmin2 and a total number of 20 EROs are found in the area, compared to 20 field EROs in 56.4 arcmin2: using the equations above we calculate a significance for the excess .
To obtain a measure of quantitative uncertainty in the overall value just calculated, we performed a simple Monte Carlo bootstrap analysis (see e.g. Press et al. Pr92 (1992)): Each of the N=20 MIR-related EROs and the N=20 field EROs is replaced by a randomly selected ERO from the original sample; the new samples are typically smaller, since the any given object may be picked upto N=20 times from the original sample. The process is repeated numerous times, and the calculation using Equations 1 and 2 is repeated after each round. We find a standard deviation of 0.59 for simulated values (the average becomes 2.82, i.e. essentially the same as the initial value of 3.0). We thus conclude that the overdensity of EROs – in the ultimately quite small area of 17.2 arcmin2 of the ISOCAM detection related IRTF frames – is statistically significant.
Significances for other magnitude cut-offs and separated for and selections, are given in Table 3. The raw numbers of objects are becoming small, and the confidences thus lower. However, we do note that a stronger clustering around the ISOCAM sources is suggested for EROs than for selected EROs. The EROs have higher surface densities in the ISOCAM field by factors of compared to field frames, whereas the selected overdensities are by factors of . If correct, and not only result of small number statistics, the effect would be consistent with the picture where the EROs are preferentially early types, and thus more clustered (Daddi et al. Da02 (2002)), and the EROs are more biased to dusty starbursts and/or those galaxies with continuing star formation.
4.5 Radial distribution
We attempt to determine the distribution of the EROs making up the overdensity as a function of distance from the corresponding ISOCAM source. Fig. 5 shows the surface densities of EROs calculated using the appopriate available areas around the ISOCAM sources. The range ″, which corresponds to radial distance of 250 kpc at includes 12 out of the 20 EROs. It is seen that the first bin, corresponding to 6 EROs closer than 15″ from an ISOCAM galaxy, produces a very high surface density. Mean surface densities of the ISO related and field frames are also indicated. The trend is similar to that found for EROs by Wold et al. (Wo03 (2003)) at slightly fainter magnitudes around high- quasars, and by Best et al. (Be03 (2003)) for red galaxies around radio-loud AGN. We simulated our radial distribution again with the bootstrap method, by replacing the original 20 EROs, with given radial distances, by randomly drawn EROs from the same sample: the error bars in Fig. 5 reflect the standard deviation of simulated surface densities in each bin. However, we note that excluding object #4 in Table 4 would make the radial distribution flatter and significant only at level in the two first bins.

4.6 High- clusters of galaxies?
We have demonstrated that fields containing faint mid-IR galaxies have a significant overdensity of EROs compared to field populations of EROs. Without spectra it is impossible to definitely show that the EROs are related to the mid-IR galaxy in question. Since most EROs have magnitude upper limits only, it is not possible to do colour-magnitude sequence analysis either. The concentrated radial distribution nevertheless suggests a physical correlation with the EROs and the central mid-IR source. An alternative for a physical connection would be that the EROs belong to a foreground structure which enhances the probability of detection of background objects through gravitational lensing – see discussion eg. in Cimatti et al. (Ci00 (2000)) and Wold et al. (Wo03 (2003)).
If the EROs indeed trace a cluster of galaxies, whether at the mid-IR source redshift or in the foreground, one would expect a larger fraction of EROs in a -selected sample of galaxies at that region, since clusters are known to have a larger fraction of ellipticals than the field (see e.g. Dressler Dr80 (1980)). From Table 5 it is evident that this indeed is the case for our ISO related IRTF fields. ERO fractions of % are very similar to findings of Wold et al. (Wo03 (2003)) in their QSO fields. The table also lists the ERO fractions in our whole survey. These values fall consistently in between the high values of the mid-IR fields and those in random fields as in Daddi et al. (2000a ) and our Paper I values, which have fractions increasing from 0.01 to 0.08 in the tabulated magnitude range.
| ISO frames | |||
|---|---|---|---|
| 0.09 | 0.09 | 0.09 | |
| 0.26 | 0.19 | 0.10 | |
| 0.21 | 0.14 | 0.11 | |
| 0.20 | 0.14 | 0.18 | |
| All frames | |||
| 0.03 | 0.02 | 0.02 | |
| 0.09 | 0.07 | 0.06 | |
| 0.12 | 0.07 | 0.08 | |
| 0.11 | 0.05 | 0.10 | |
5 Summary
We have searched for EROs in a targeted near-IR survey in ELAIS fields, using , , and colour criteria. These are equivalent to the commonly used , , and . We find 40 EROs, 14 of which are common to both and selection. We study the number counts and properties of these EROs, both close to and away from the mid-IR ELAIS sources, and summarize the results as follows:
-
•
Taking advantage of overlapping mid-IR data, we search for dusty EROs, since only these should be detected with the used m ISOCAM band. One clear mid-IR ERO is found, and two other which are somewhat ambiguous. Taking into account detection limits we can limit the number of strong ULIRG type starbursts in the ERO population to %.
-
•
Broad-band colours and SED fits of those EROs with detections in at least 3 bands suggest these are mainly early type evolved galaxies at .
-
•
Cumulative number counts are provided for the EROs. The total counts are found to be higher than field counts in the literature, but this is due to excess EROs discovered in ISOCAM fields. When fields with no mid-IR sources are considered, the ERO counts fit well other data. Our field ERO counts, as well as other literature data, are very well fit by pure luminosity evolution models in our magnitude range.
-
•
We derive a significant overdensity of EROs in areas within 90″ of faint mid-IR sources. The result is equivalent to what other studies have found in high redshift AGN and QSO fields. The high fraction of EROs among all -selected galaxies in these fields suggests that the EROs are part of high redshift clusters of galaxies. The fields are small, however, and clusters and e.g. filaments of large scale structure cannot be properly differentiated. Furthermore, selected EROs at are (marginally) more clustered in the mid-IR fields than the selected EROs, consistent with a picture that the selected EROs contain preferentially more early type galaxies than the EROs.
-
•
It is not yet clear whether the ERO overdensities are physically connected to the mid-IR sources (or AGN) or rather part of a foreground cluster or other surface density peak grationally enhancing the detections of background mid-IR sources. However, the radial distribution of EROs around the mid-IR detection suggests a physical connection.
Acknowledgements.
We thank Eric V. Tollestrup for valuable help with the IRTF observations. We acknowledge the work done by the ELAIS collaboration and ISO science centre in bringing together the ELAIS products. We wish to thank Eduardo Gonzalez-Solares for help with the WFS photometric catalogue and Margrethe Wold, Emanuele Daddi, Kalevi Mattila, and an anonymous referee for useful comments.References
- (1) Almaini, O., Scott, S.E., Dunlop, J.S. et al. 2003, MNRAS, 338, 303
- (2) Basilakos, S., Georgantopoulos, I., Pérez-Fournon, I. et al., 2002, MNRAS, 331, 417
- (3) Bahcall, N., McKay, T.A., Annis, J., et al. 2003, ApJS, 148, 243
- (4) Bertin, E., Arnouts, S., 1996, A&AS, 117, 393
- (5) Best, P.N., Lehnert, M.D., Miley, G.K., Röttgering, H.J.A. 2003, MNRAS, 343, 1
- (6) Bolzonella, M., Miralles, J.-M., Pelló, R., 2000 A&A, 363, 476
- (7) Cesarsky, C.J., Abergel, A., Agnese, P., et al. 1996, A&A, 315, L32
- (8) Chapman, S.C., McCarthy, P.J., Persson, S.E 2000, AJ, 120, 1612
- (9) Cimatti, A., Villani, D., Pozzetti, L, di Serego Alighieri, S. 2000, MNRAS, 318, 453
- (10) Cimatti, A., Daddi, E., Mignoli, M. et al. 2002, A&A, 381, L68
- (11) Cimatti, A., Daddi, E., Cassata, P. et al. 2003, A&A, 412, L1
- (12) Cohen, M. 1994, AJ, 107, 582
- (13) Cole, A., Lacey, C.G., Baugh, C.M., Frenk, C.S. 2000, MNRAS, 319, 204
- (14) Daddi, E., Cimatti, A., Pozzetti, L. et al. 2000, A&A, 361, 535
- (15) Daddi, E., Cimatti, A., Renzini, L. 2000, A&A, 362, L45
- (16) Daddi, E,. Cimatti, A., Broadhurst, T., et al. 2002, A&A, 384, L1
- (17) Dahn, C.C., Harris, H.C., Vrba, F.J., et al. 2002, AJ, 124, 1170
- (18) Dey, A., Spinrad, H., Dickinson, M. 1995, ApJ, 440, 515
- (19) Dressler, A. 1980, ApJ, 236, 351
- (20) Efstathiou, A., Oliver, S., Rowan-Robinson, M. et al., 2000, MNRAS, 319, 1169
- (21) Eggen, O.J., Lynden-Bell, D. & Sandage, A.R. 1962, ApJ, 136, 748
- (22) Elbaz, D., Cesarsky, C.J., Chanial, P. et al. 2002, A&A, 384, 848
- (23) Fadda, D., Flores, H., Hasinger, G., et al. 2002, A&A, 383, 838
- (24) Firth, A.E., Somerville, R.S., McMahon, R.G. et al. 2002 MNRAS, 332, 617
- (25) Fukugita, M., Ichikawa, T., Gunn, J.E. et al. 1996, AJ, 111, 1748
- (26) Gilbank, D.G., Smail, I., Ivison, R.J., Packham, C. 2003, MNRAS, 346, 1125
- (27) Gonzalez, A.H., Zaritsky, D., Dalcanton, J.J., Nelson, A. 2001, ApJS, 137, 117
- (28) Gonzalez-Solares, E.A., Perez-Fournon, I., Rowan-Robinson, M. et al. 2004, MNRAS, submitted (astro-ph/0402406)
- (29) Hall, P.B., Green, R.F. ApJ, 507, 558
- (30) Hall, P.B., Sawicki, M., Martini, P., et al. 2001, AJ, 121, 1840
- (31) Hu, E.M., Ridgway, S.E. 1994, AJ, 107, 1303
- (32) Irwin, M., Lewis, J. 2001, NewAR, 45, 105
- (33) Jarrett, T.H. 1992, PhD thesis, University of Massachusetts, Amherst
- (34) Kron, R.G. 1980, ApJS, 43, 305
- (35) La Franca, F., Gruppioni, C., Matute, I., et al. 2004, AJ, 127 (in press)
- (36) Landolt, A.U. 1992, AJ, 104, 340
- (37) Larson, R.B. 1975, MNRAS, 173, 671
- (38) Mann, R.G, Oliver, S., Carballo, R., et al. 2002, MNRAS, 332, 549
- (39) Manners, J.C., Johnson, O., Almaini, O., et al. 2003, MNRAS, 343, 293
- (40) McMahon, R.G., Walton, N.A., Irwin, M.J. et al. 2001, NewAR, 45, 97
- (41) McCarthy, P.J., Persson, S.E., West, S.C. 1992, ApJ, 386, 52
- (42) Mohan, N.R, Cimatti, A., Röttgering, H.J. 2002, A&A, 383, 440
- (43) Moustakas, L.A., Casertano, S., Conselice, C. et al. 2004, ApJ, 600, L131
- (44) Mullis, C.R., McNamara, B.R., Quintana, H., et al. 2003, ApJ, 594, 154
- (45) Oliver, S., Rowan-Robinson, M. et al. 2000, MNRAS, 316, 749
- (46) Olsen, L.F., Scodeggio, M., Da Costa, L. et al. 1999, A&A, 345, 363
- (47) Press, W.H., Teukolsky, S.A., Vetterling, W.T., Flannery, B.P. 1992, Numerical recipes in C, The Art of Scientific Computing, Second Edition, Cambridge University Press, p. 691
- (48) Roche, N.D., Almaini, O., Dunlop, J.S., Ivison, R.J., Willott, C.J. 2002, MNRAS, 337, 1282
- (49) Roche, N.D., Dunlop, J.S., Almaini, O. 2003, MNRAS, 346, 803
- (50) Rowan-Robinson, M., Lari, C., Perez-Fournon, I., et al., 2004, MNRAS, in press (astro-ph/0308283)
- (51) Sánchez, S.F., González-Serrano, J. I. 2002, A&A, 396, 773
- (52) Scott, S.E., Fox, M.J., Dunlop, J.S. et al. 2002, MNRAS, 331, 817
- (53) Serjeant, S., Oliver, S., Rowan-Robinson, M. et al. 2000, MNRAS, 316, 768
- (54) Silva, L., Granato, G.L., Bressan, A., Danese, L. 1998, ApJ, 509, 103
- (55) Smail, I., Owen, F.N., Morrison, G.E., et al. 2002, ApJ, 581, 844
- (56) Somerville, R.S., Primack, J.R. 1999, MNRAS, 310, 1087
- (57) Somerville, R.S., Moustakas, L.A., Mobasher, B. 2004, ApJ, 600, L135
- (58) Takata, T., Kashikawa, N., Nakanishi, K., et al. 2003, PASJ, 55, 789
- (59) Vaccari, M., Lari, C., Angeretti, L., et al. 2004, MNRAS, submitted (astro-ph/0404315)
- (60) Väisänen, P., Tollestrup, E.V., Willner, S.P., Cohen, M. 2000, ApJ, 540, 593
- (61) Väisänen, P., Johansson, P.H. 2004, A&A, in press (astro-ph/0404129) (Paper I)
- (62) Webb, T.M.A, Brodwin, M., Eales, S., Lilly, S.J. 2004, ApJ, in press (astro-ph/0311598)
- (63) Wehner, Barger, A., Kneib, J.-P. 2002, ApJ, 577, 83
- (64) White, S.D.M., Rees, M.J. 1978, MNRAS , 183, 341
- (65) White, S.D.M., Frenk, C.S. 1991, ApJ, 379, 52
- (66) Wold, M., Armus, L., Neugebauer, G., Jarrett, T.H., Lehnert, M.D. 2003, AJ, 126, 1776
- (67) Yan, L., Thompson, D. 2003, ApJ, 586, 765