The Kast Ground Based UV Spectral Survey of 79 QSOs at Redshift 2 for Lyman Alpha Forest and Metal Absorption
Abstract
We present a moderate resolution ( Å/pixel) survey of 79 quasars obtained using the Kast spectrograph on the Shane 3m telescope at Lick observatory. The spectra span the wavelength range of 3175–5880 Å, and have typical signal to noise of 6–20 in the regions of the spectra showing Ly forest absorption. The quasars have a mean emission redshift of , and nearly all cover the entire Ly forest between Ly and Ly. Although the quasars were selected to avoid BAL, two quasars in the survey are BAL, one of which is a new discovery. We list the H I and metal ions observed in a total of 140 absorption systems. We also identify 526 emission lines, and list their observed wavelengths, along with new redshifts of the quasars. We determine the rest wavelengths of 3 emission lines or line blends in the forest to be , , and Å.
1 Introduction
In recent years, the ability to obtain precision cosmological measurements from the high redshift intergalactic medium (IGM) has been realized via the combination of large data-sets and numerical simulations. Large QSO surveys such as the Sloan Digital Sky Survey (SDSS111http://www.sdss.org) and the Two Degree Field Survey (2dF222http://www.aao.gov.au/2df/) have made available spectra of thousands of quasars sampling the universe in Ly forest absorption at redshifts and larger.
At redshifts below 2.5, however, few moderately sized ground based surveys exist which cover the Ly forest with sufficient resolution or signal to noise. Kim et al (2004) discuss the Ly forest from a sample of 27 high resolution VLT/UVES spectra with a median redshift of . Scott, Bechtold, and Dobrzycki (2000) present Å resolution data for 39 QSOs targeted specifically to cover the Ly forest at . The survey of Lyman limit absorption by Sargent, Steidel, and Boksenberg (1989) contains 59 QSOs, some of which covering the Ly forest at , but the resolution is low, and the bulk of the data is at higher redshift. Barthel, Tytler, and Thompson (1990) present 67 spectra of radio loud quasars, of which 26 have emission redshifts between 1.9 and 2.6, but this survey contains no data below 3880 Å. Sargent, Boksenberg, and Steidel (1988) discuss Å resolution spectra of 55 QSOs, of which 33 have emission redshifts between 1.9 and 2.5, but this survey was targeted entirely for C IV absorption, and covered only wavelengths suitable for this metal transition. Lanzetta, Wolfe, and Turnshek (1987) analyze 32 quasars for Mg II absorption, 16 of which have emission redshifts between 1.9 and 2.5, but their survey was constrained to wavelengths greater than 6200 Å, and thus does not cover the Ly forest. Finally, larger surveys such as the Large Bright Quasar Survey (Hewett, Foltz, and Chaffee, 1995), the FIRST Bright QSO Survey (Gregg et al, 1996) and the Hamburg/ESO survey for bright QSOs (Wisotzki et al., 2000) have a large number of QSOs below , but the resolution of these surveys is very low.
The scarcity of ground based data covering the Ly forest at redshifts 1.6–2.5 occurs primarily because working at observed wavelengths less than 4000 Å becomes prohibitive due to issues such as poor fiber optic transmission, diminishing CCD response, and increased effects of atmospheric extinction.
In this paper, we present a survey of 79 quasars with an average emission redshift of . The redshift range of the Ly forest in the survey serves as a compliment to larger surveys at higher redshift, and is of sufficient size to provide a statistically useful sampling of the IGM at a redshift of 2. Various details of the survey are also discussed in Tytler et al. (2004), where we present a measurement and interpretation of the mean amount of absorption due to H I in the intergalactic medium.
In section 2, we detail the observations and data reduction. In section 3, we present the spectra, and discuss individual quasars, metal absorption systems, and emission lines.
2 Observations and Data Reduction
The data in the survey were obtained using the Kast double spectrograph on the Shane 3m telescope at Lick observatory over the years 2001 through 2003. In most cases, the spectra were obtained using the 2 arcsecond slit width, although some observations required the 3 arcsecond slit to accommodate poor seeing conditions, and in very rare cases, a 1.5 arcsecond slit was used when the seeing conditions were very good. In all observations, the spectrograph slit was oriented such that it was aligned with the vertical direction at the effective middle of the exposure to minimize losses due to atmospheric dispersion. For each QSO in the sample, exposures were taken using both the blue and red cameras on Kast. The blue camera used the 830/4360 grism, and the red camera used the 1200/5000 grating, with a dispersion of 1.13 and 1.17 Å per pixel respectively ( pixels per resolution element). We employed the d46 dichroic to split the light between the cameras. The blue camera exposures covered the approximate wavelength range of 3175–4540 Å, and the red camera exposures covered the approximate wavelength range 4475–5880 Å. Because of differences in the exact location of the blue camera CCD on a given observing run, the starting and ending wavelengths varied by approximately 5 Å.
The quasars in the survey were all chosen from the NED extragalactic database 333http://nedwww.ipac.caltech.edu with only the constraints that they have an emission redshift between and , be of sufficient brightness to keep exposure times less than a few hours, and not show BAL absorption. The constraint was made so as to maximize coverage of the Ly forest at , and the choice to neglect BAL QSOs was made to minimize contaminating absorption in the spectra that do not come from the IGM. We obtained and present spectra for two QSOs, Q1542+5408 and Q2310+0018, which we found to show BAL absorption. Q1542+5408 is discussed in Green et al. (2001), and Q2310+0018 is discovered to be BAL in this survey. Other than these constraints, the survey is unbiased with respect to the quasars observed.
Table 1 lists the QSOs observed, along with their B1950 and J2000 coordinates, the V magnitude as given by NED, the approximate redshift, and the exposure time. For simplicity, and to aid comparison with published spectra, we choose to name the QSOs by their abbreviated B1950 coordinates. Table 2 lists the observation date, slit width and signal to noise for each QSO. The signal to noise in table is calculated at two rest wavelengths, 1070Å and 1170Å and is given as the mean signal to noise over 20 Å centered about these wavelengths. It should be noted that the true signal to noise of the spectrum will be in general higher, because absorption from the Ly forest lowers the mean signal to noise. These wavelengths were chosen because they correspond to the starting and ending rest wavelengths that were used to sample the Ly forest for the measurement of the mean flux decrement in Tytler et al. (2004). Figure 1 shows the distribution in signal to noise corresponding to the values in Table 2.
The exposure times were chosen with the intent to obtain S/N at wavelengths greater than the Ly emission line of each QSO In practice, most of the spectra reach this goal, except those observed in poor conditions. We do not present QSOs for which we obtained S/N .
We obtained, but do not present spectra for 6 objects which upon reduction, are not QSOs. Two of these spectra are likely due to telescope pointing error. It is possible that the 4 other objects, Q1456+5404 (14h56m47.71 +54d04m25.6 = 2.300 V=16.50), Q1742+3749 (17h42m 5.55 +37d49m08.3 = 1.958 V=16.40), Q1755+5749 (17h55m15.97 +57d49m06.9 = 2.110 V=18.00), and Q2113+3004 (21h13m59.42 +30d04m02.4 = 2.080 V=17.30) are not QSOs.
All QSOs were reduced using the standard longslit reduction tools in IRAF. Wavelength calibration was also performed in the standard manner with IRAF. For each QSO, an arclamp observation was made at the same telescope position as that for the QSO to minimize the effects that flexure may have on the wavelength solution, and typical wavelength errors were less than 1 Å. For each night, a number of spectrophotometric flux standard stars were observed for the purposes of flux calibration. We list these stars in Table 3. As discussed in Suzuki et al. (2003), our errors in relative flux calibration could be as good as a few percent. Finally, the spectra were cleaned of any deviant pixels resulting from poor sky or cosmic ray subtraction by replacing these pixels with their neighboring flux values.
For the blue camera exposures, a continuum level was placed on the spectrum by eye using the b-spline continuum fitting procedure discussed in Kirkman et.al (2003) and Tytler et. al (2004). On average, in the regions containing Ly forest absorption, the errors in this continuum level placement were . A thorough discussion of the continuum level error is given in Tytler et. al (2004). The red camera exposures had no continuum level assigned.
3 The Kast Survey
We now present the spectra of the survey, comment on absorbers in individual QSOs, and tabulate the emission lines.
3.1 Spectra
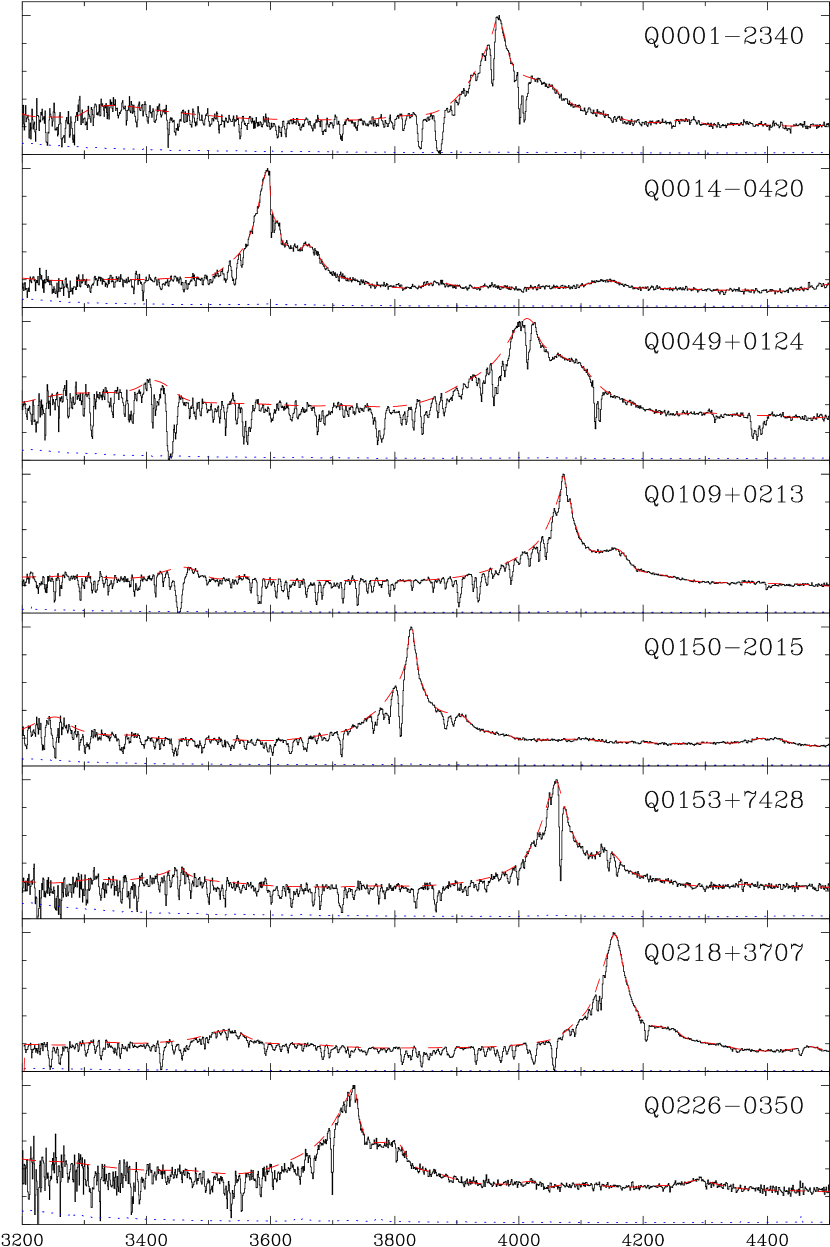
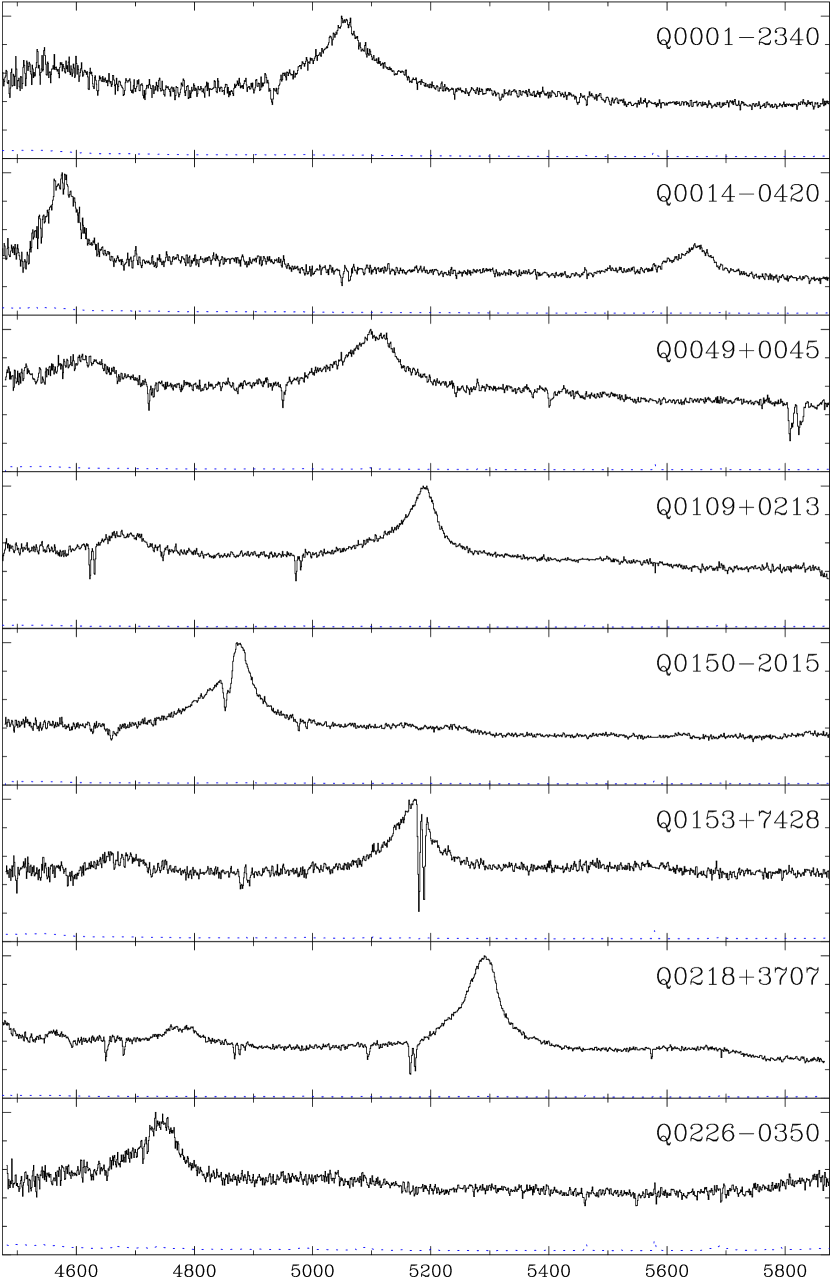
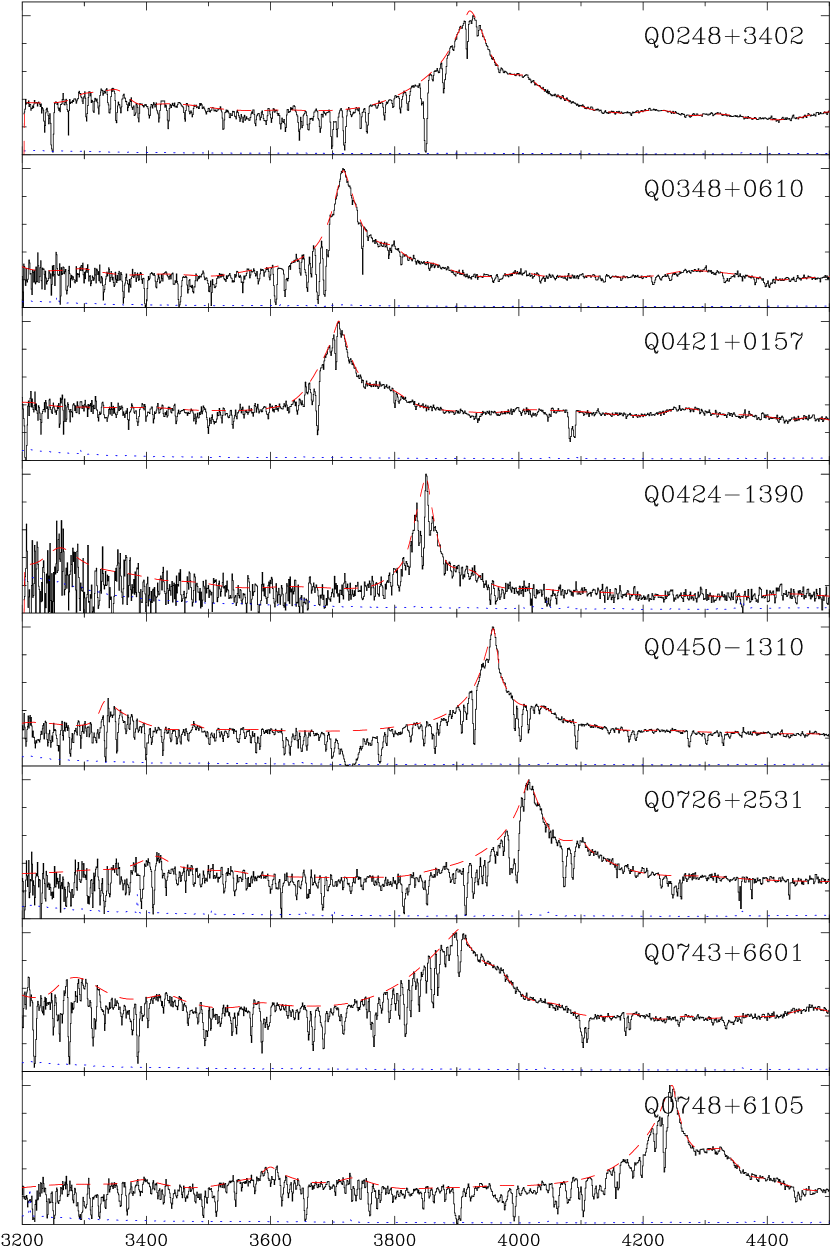
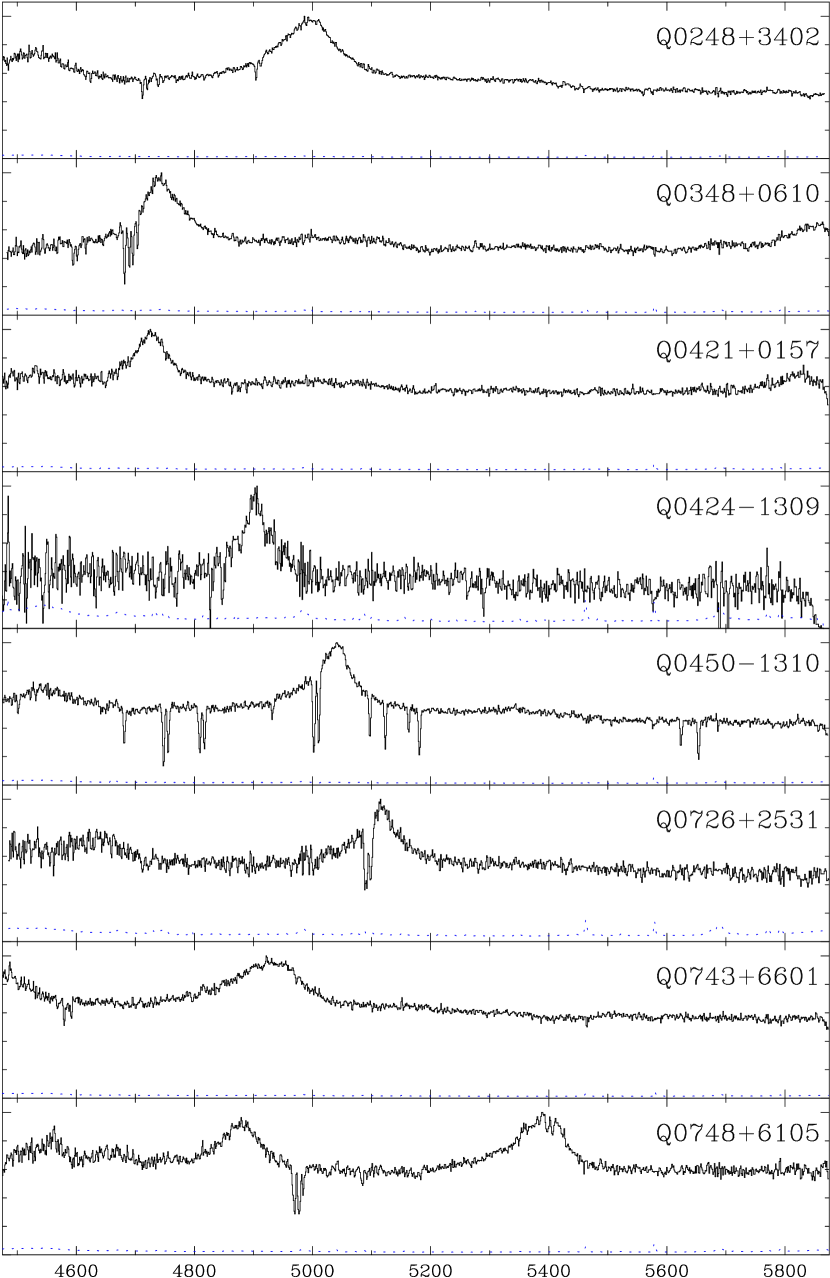
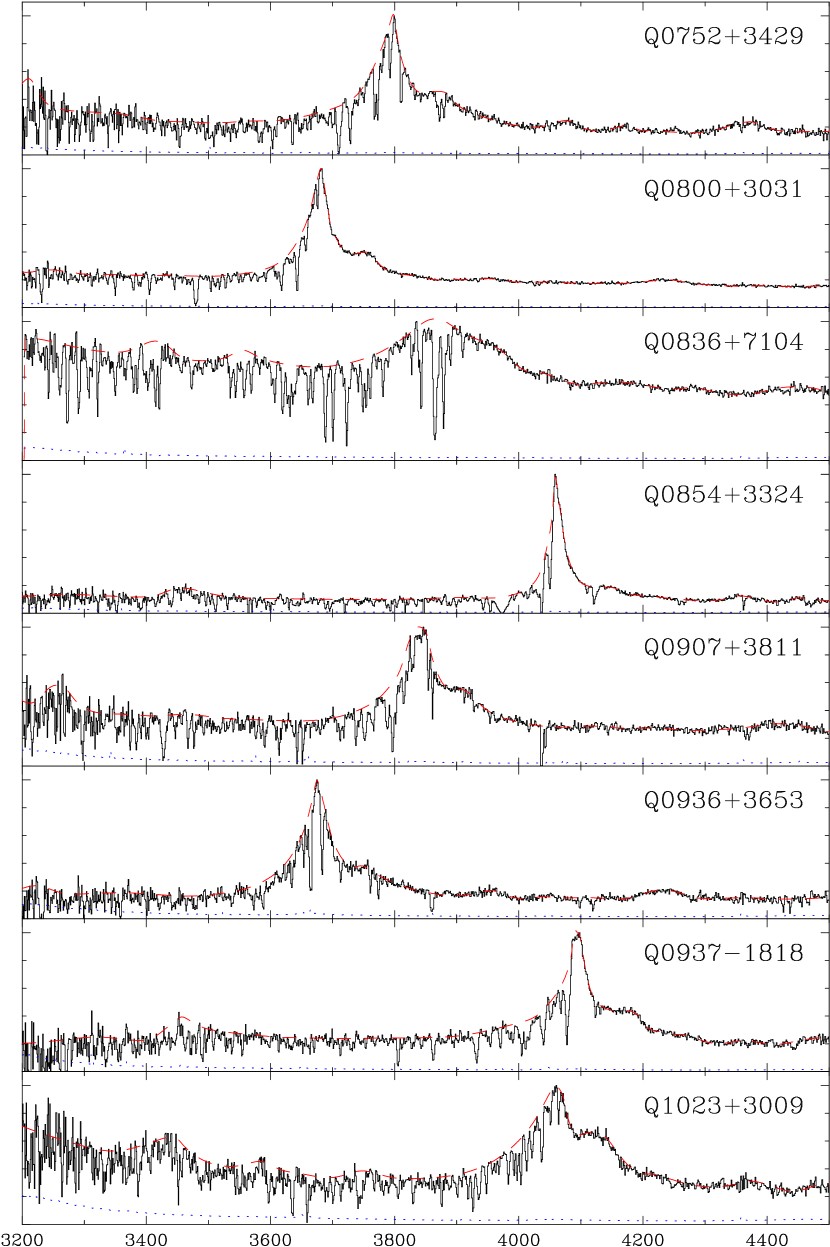
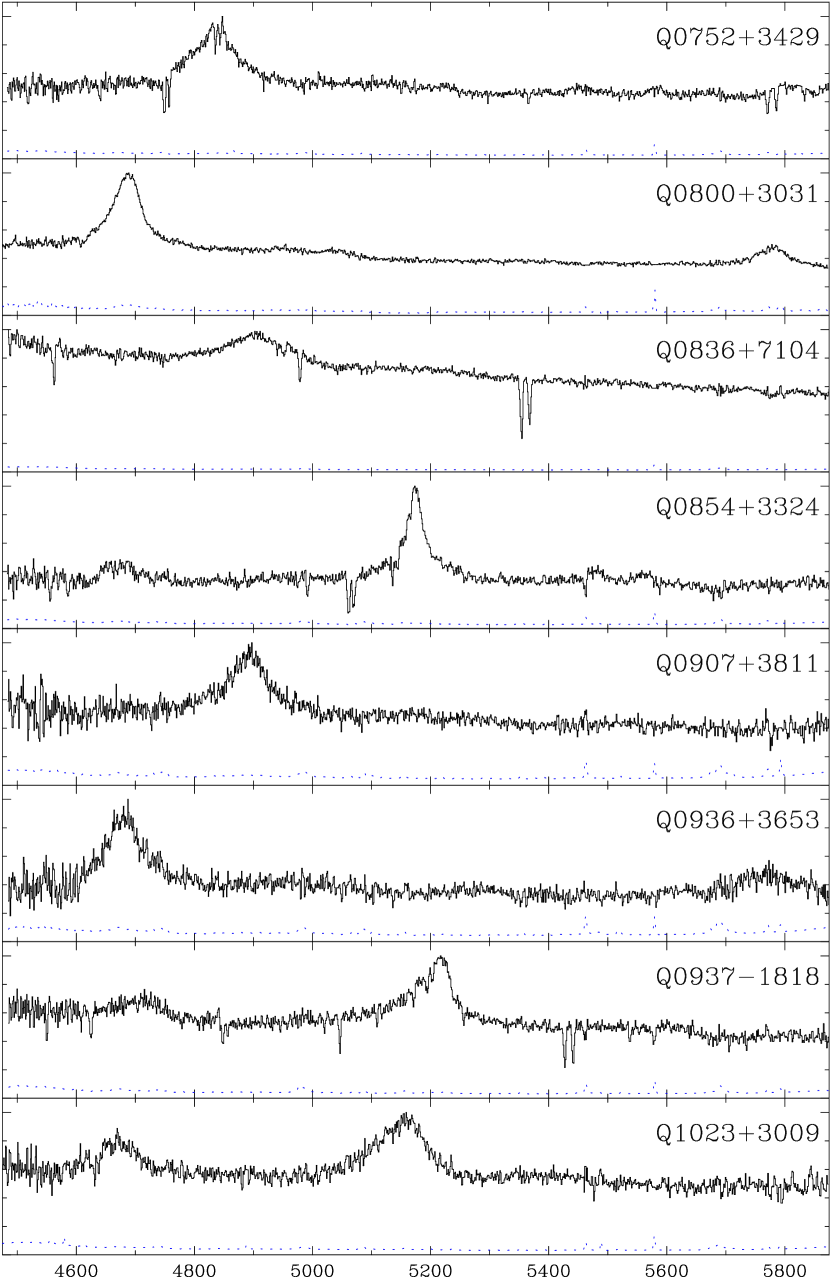
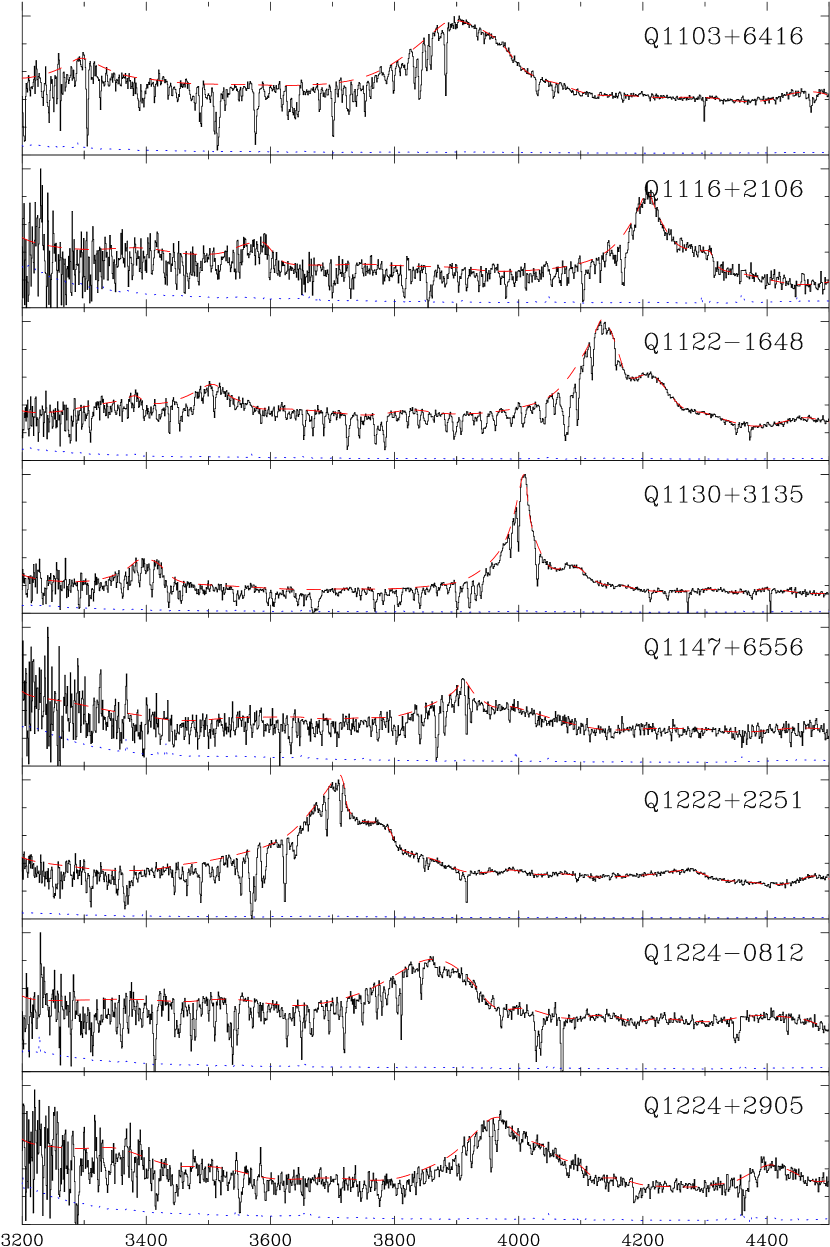
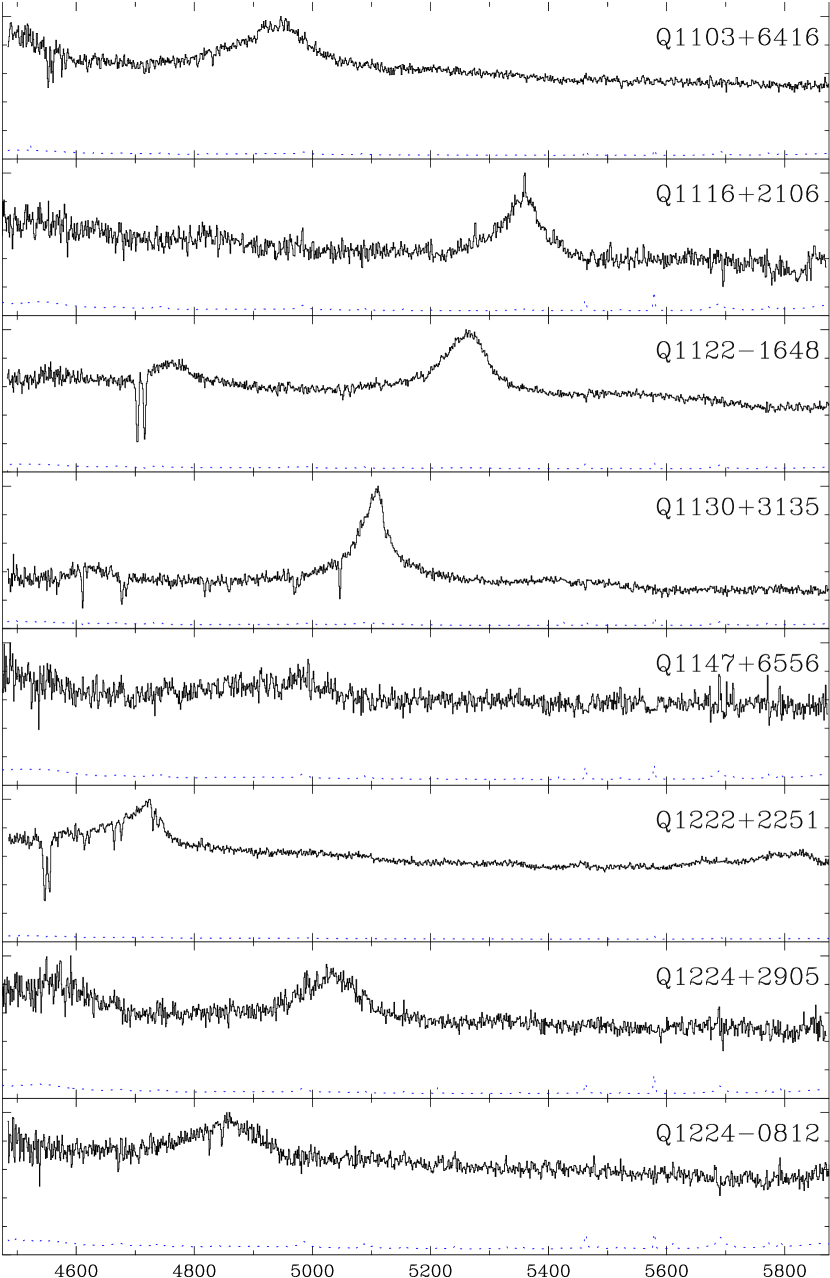
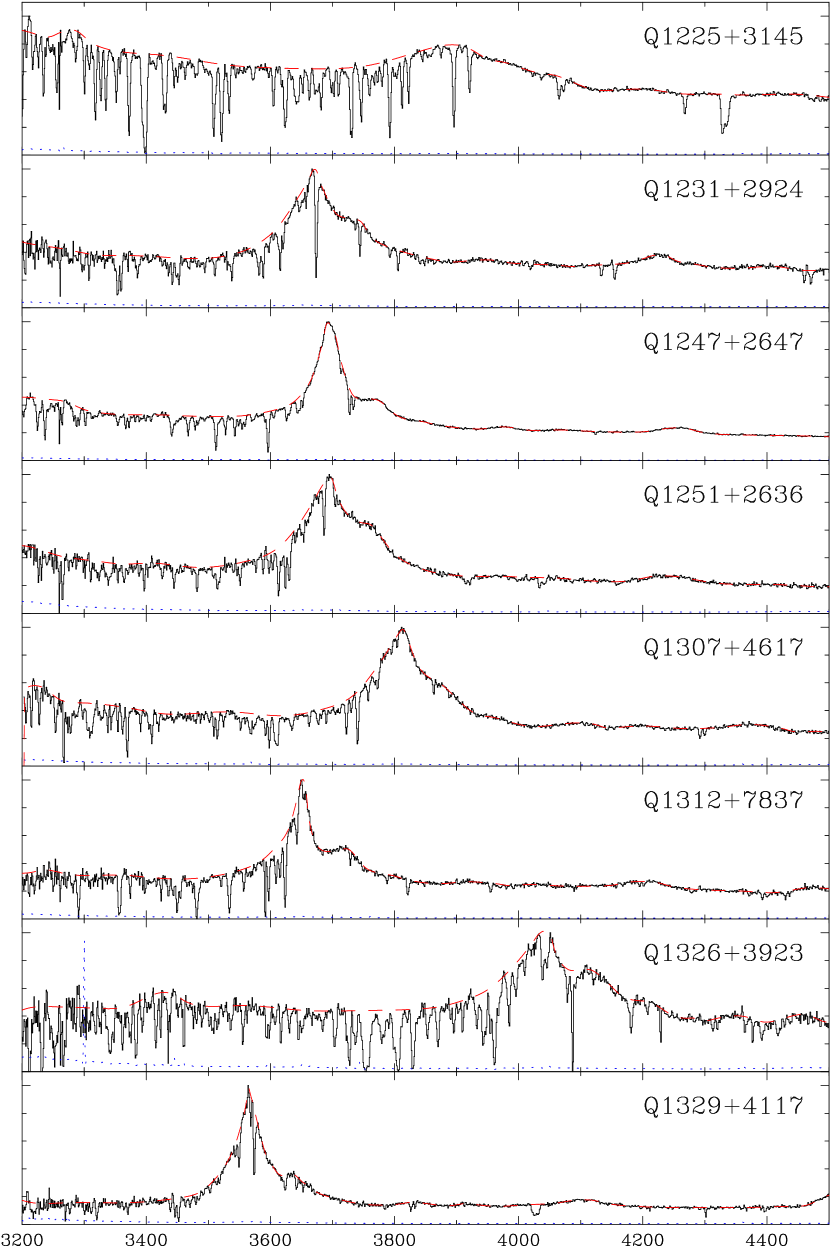
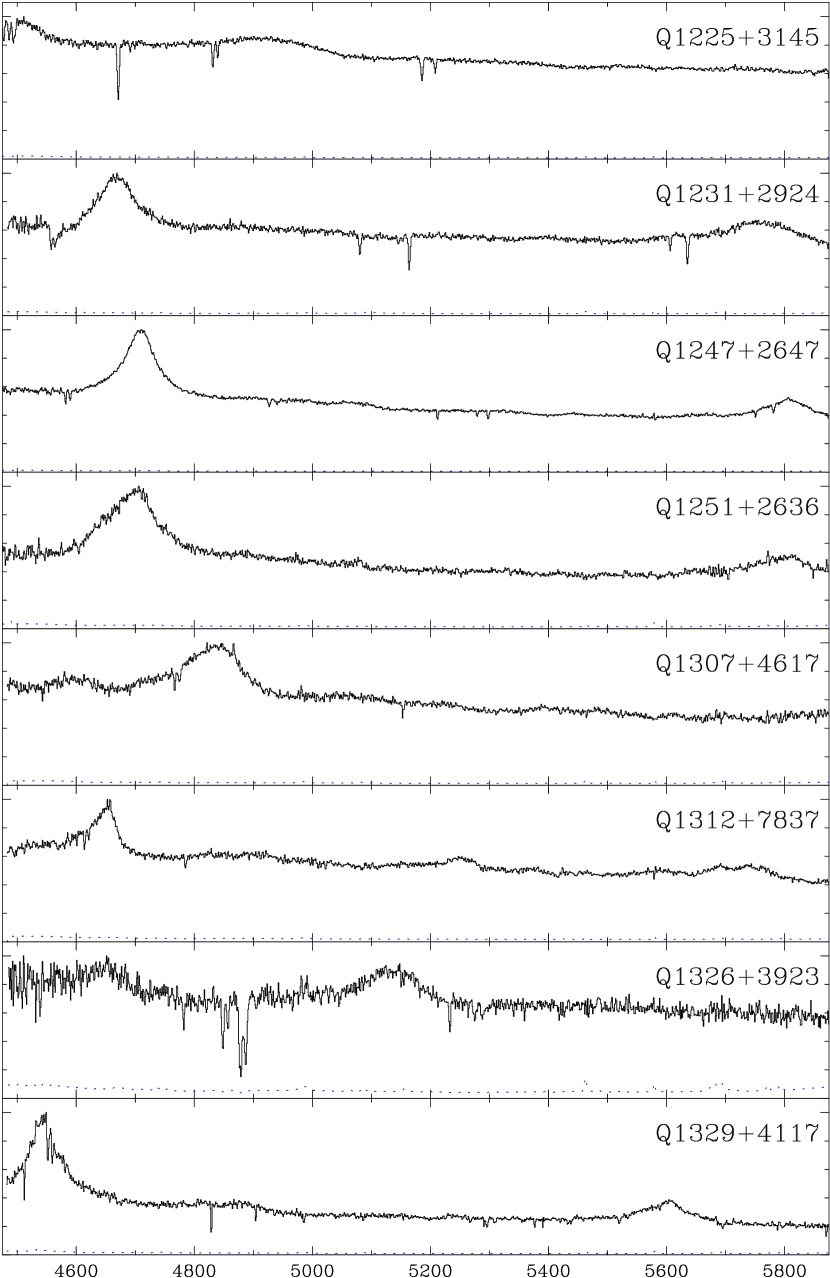
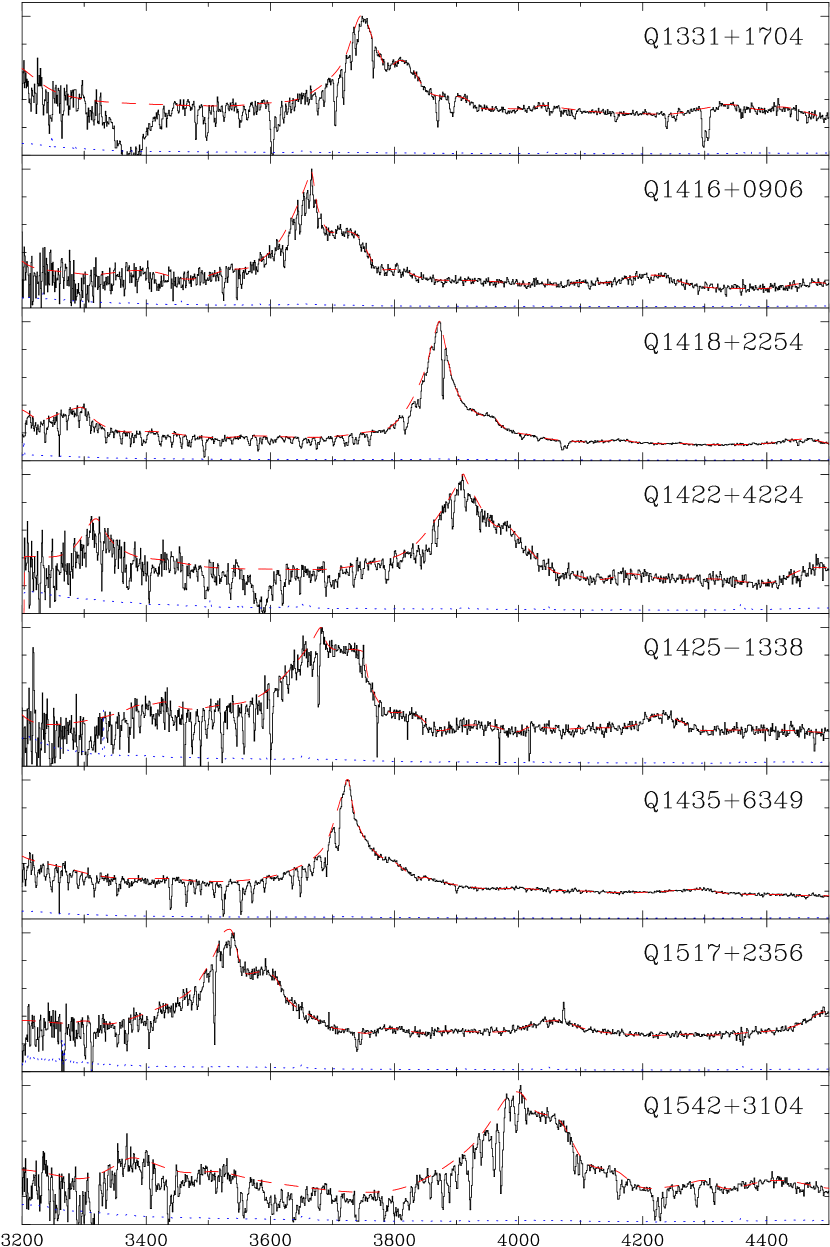
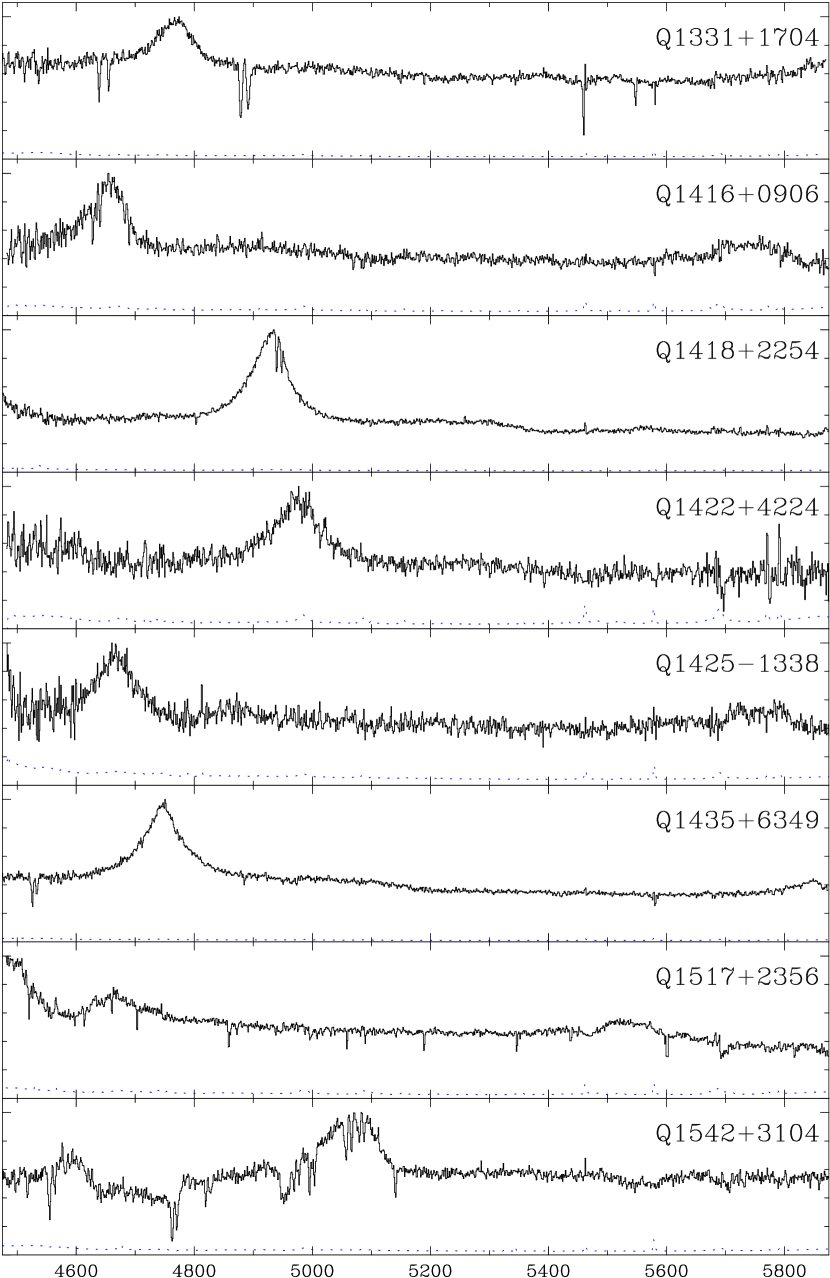
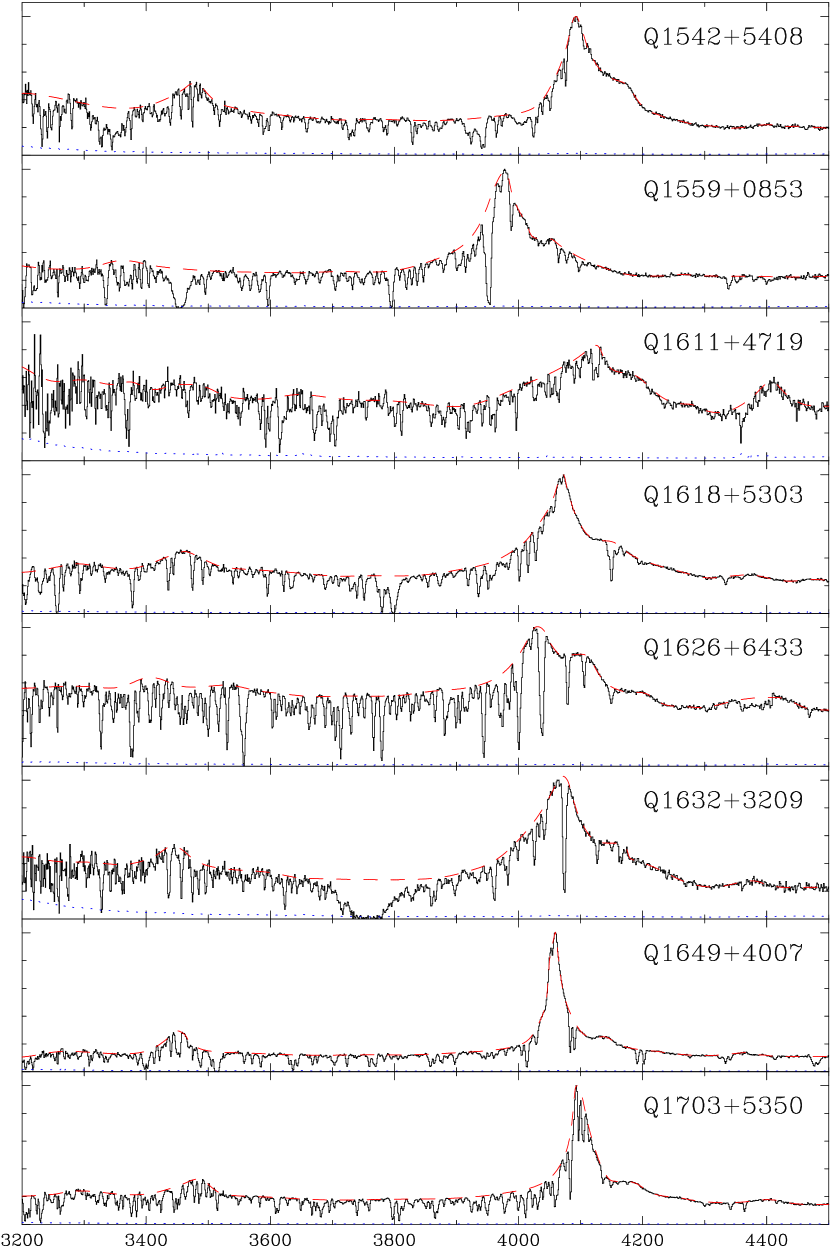
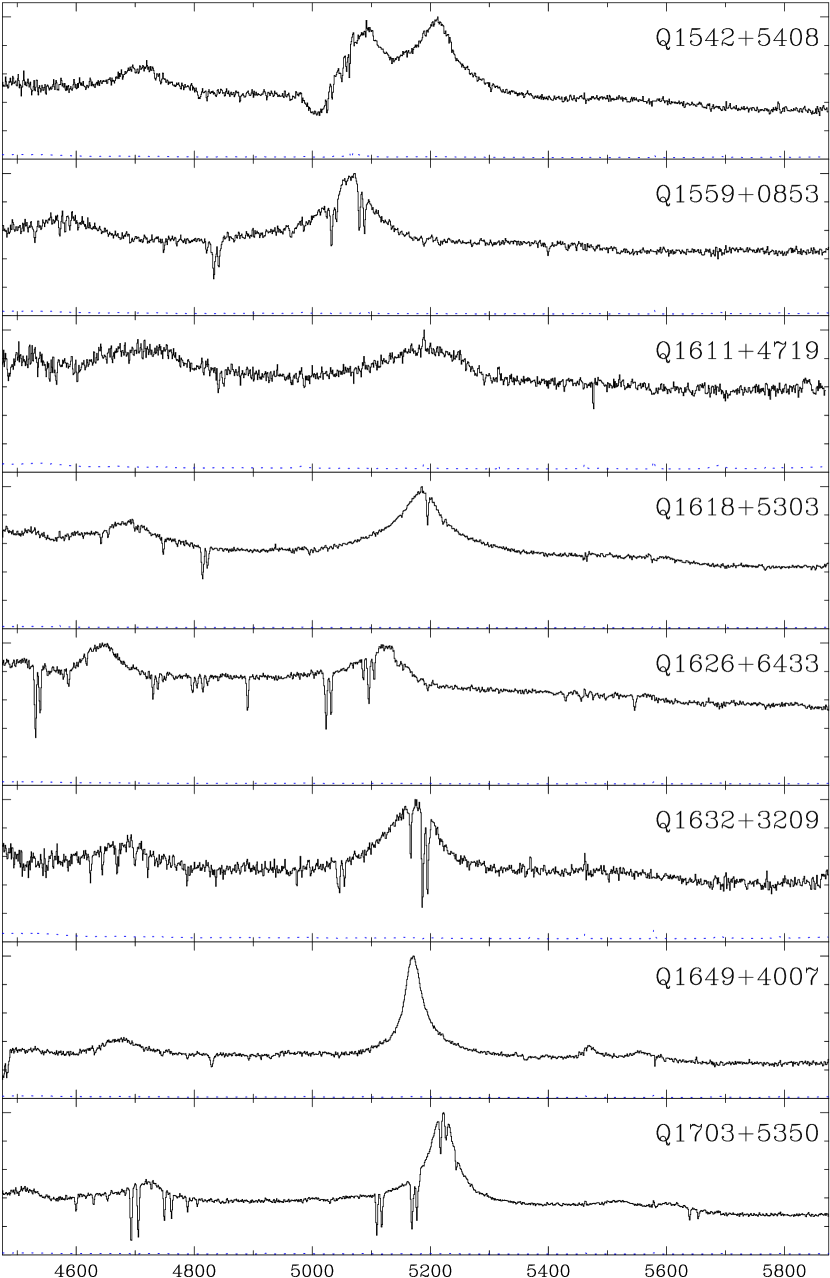
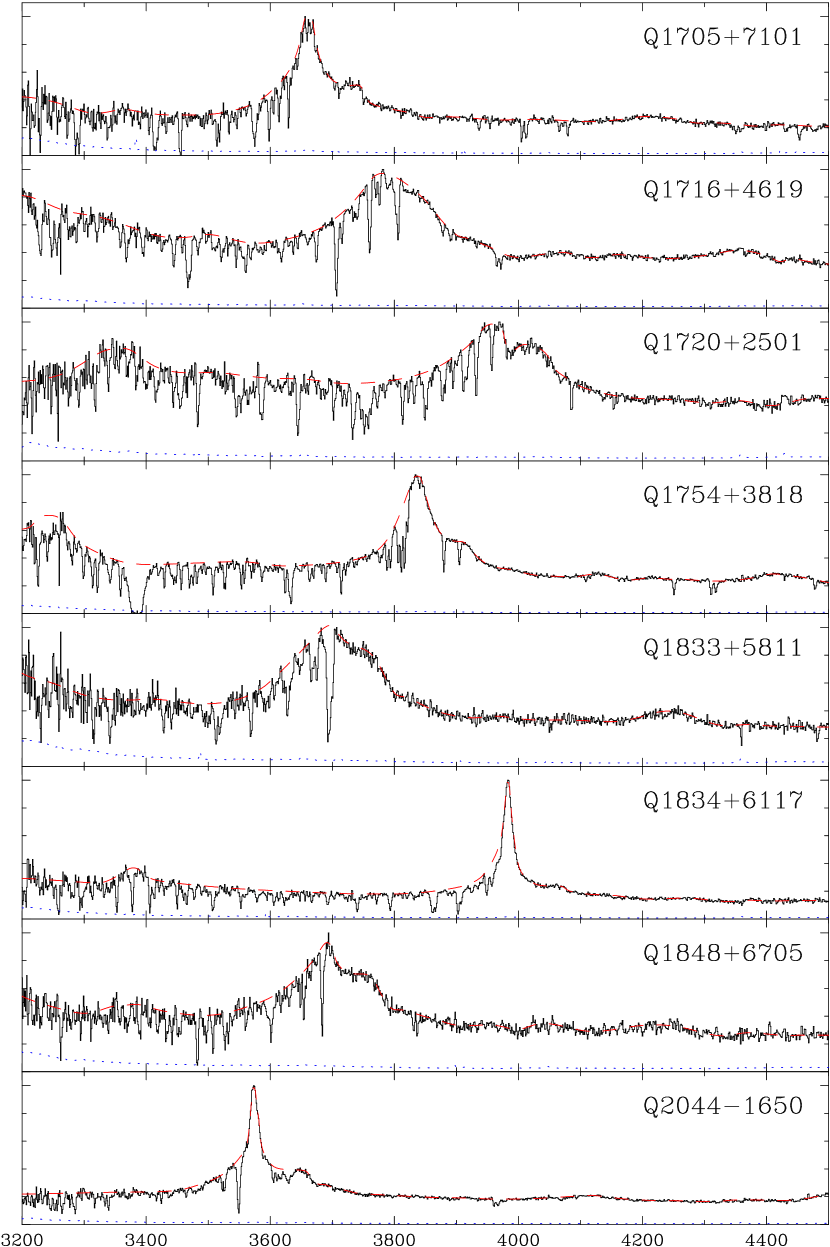
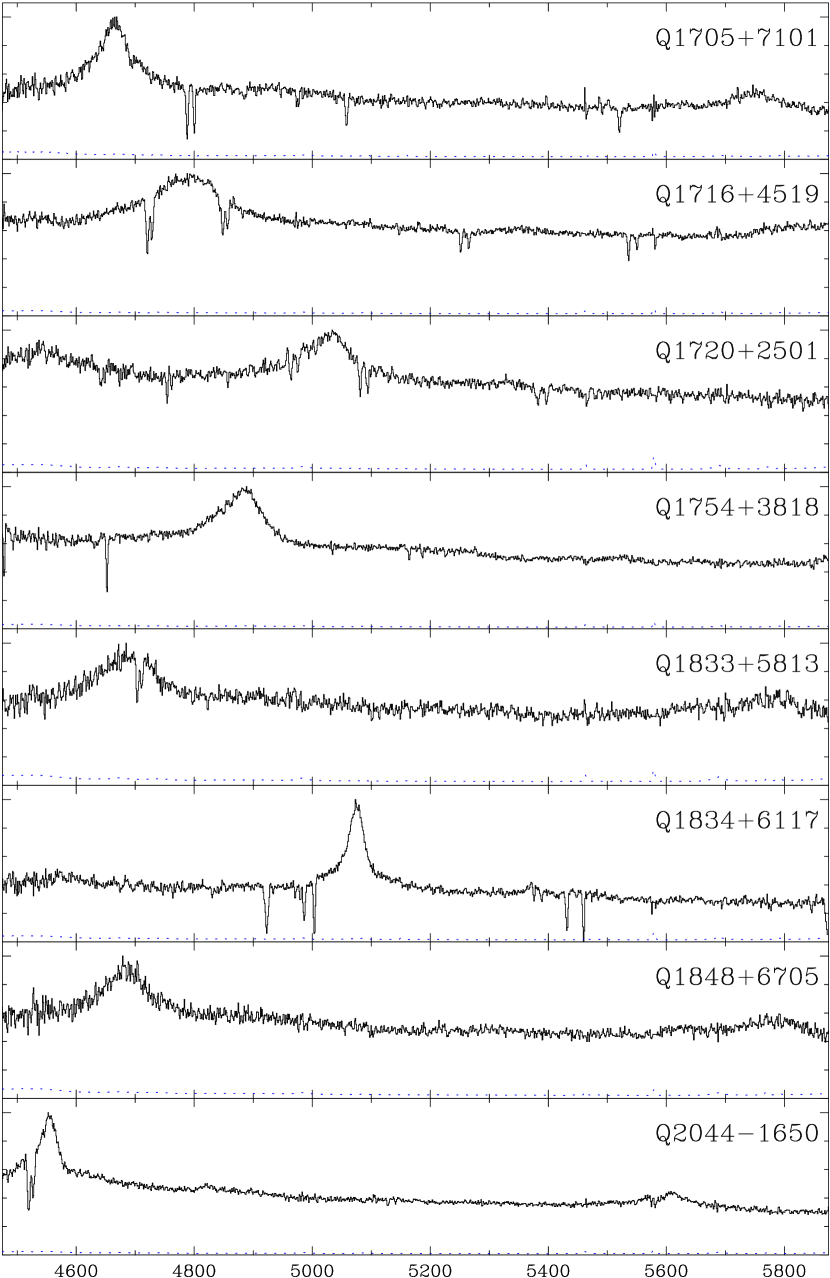
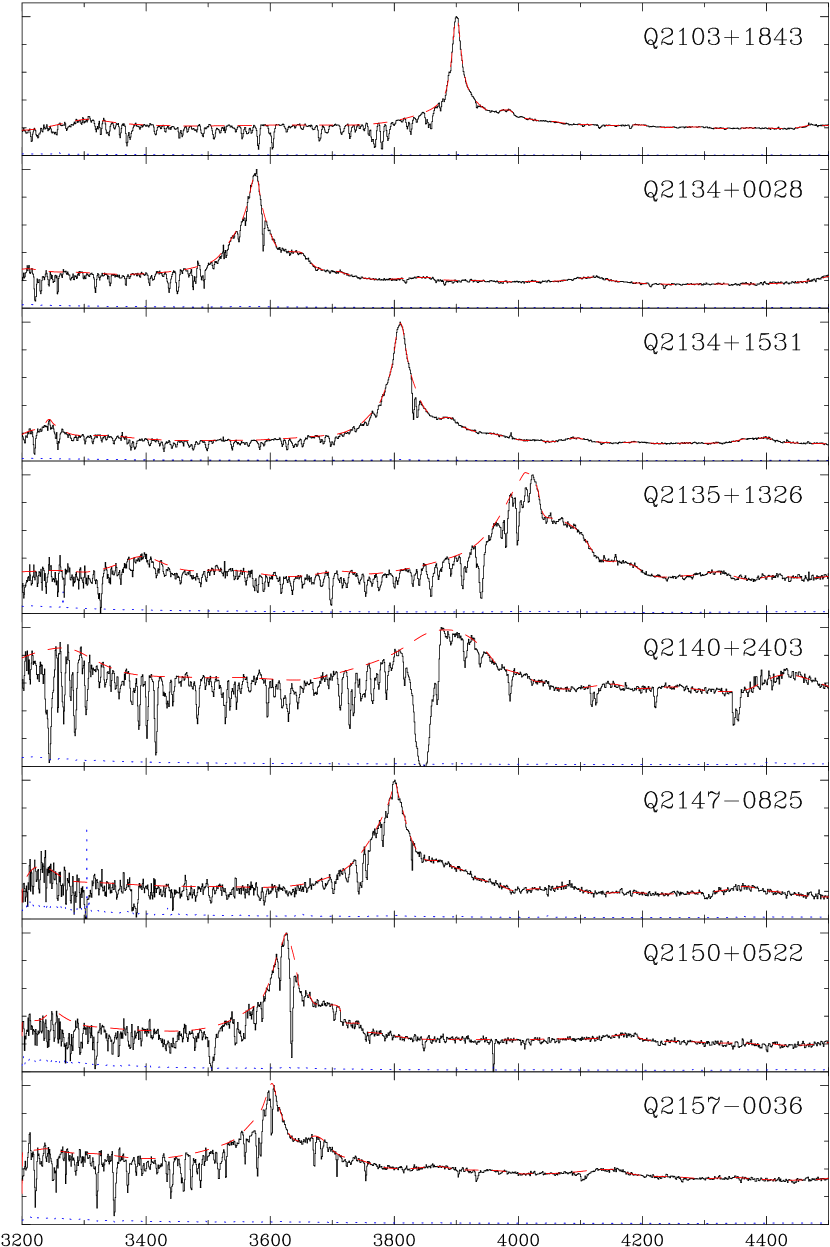
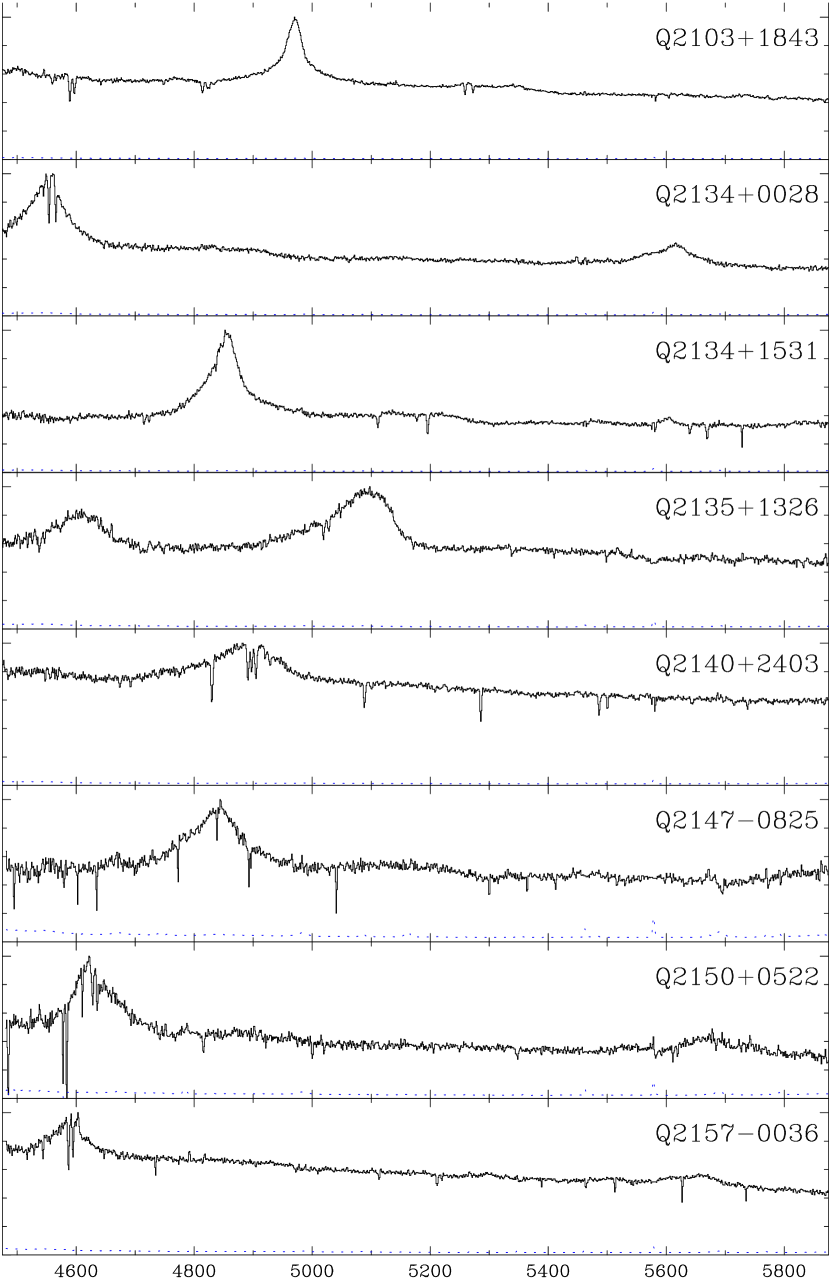
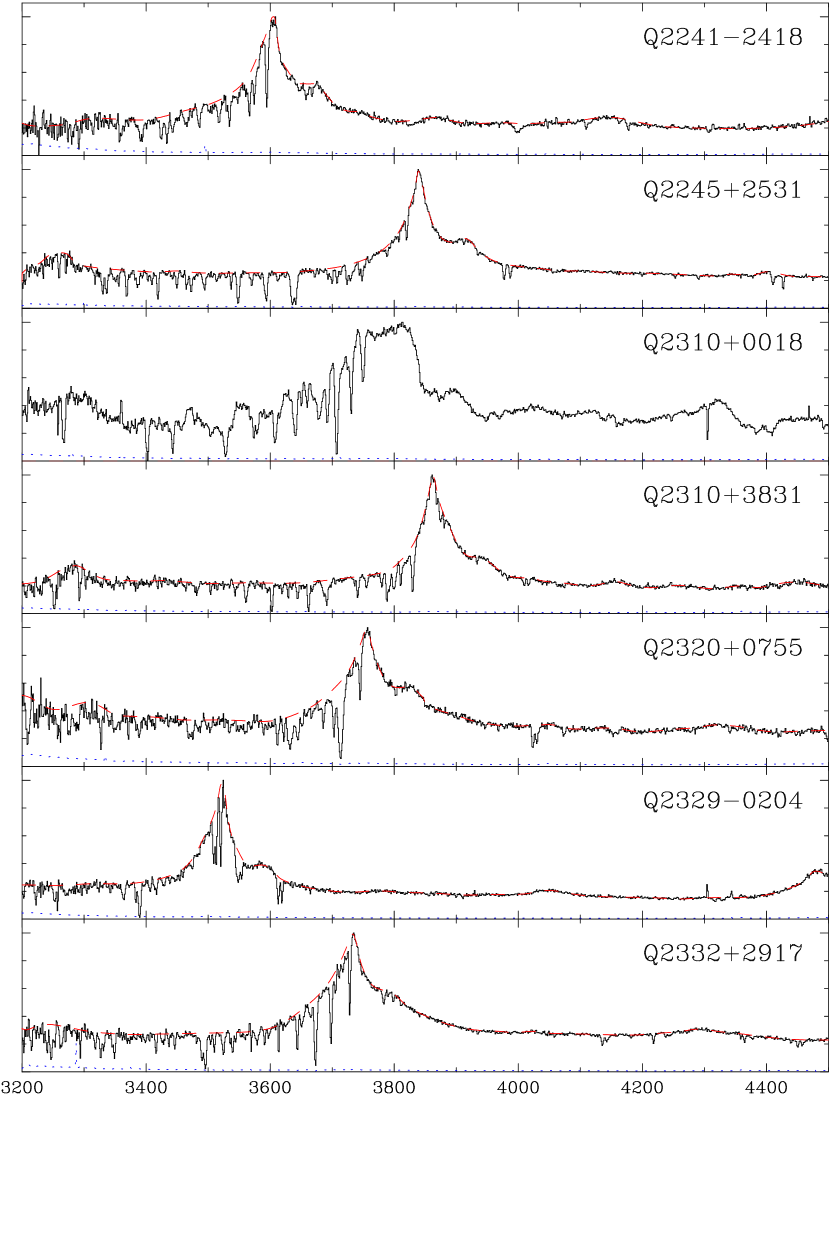
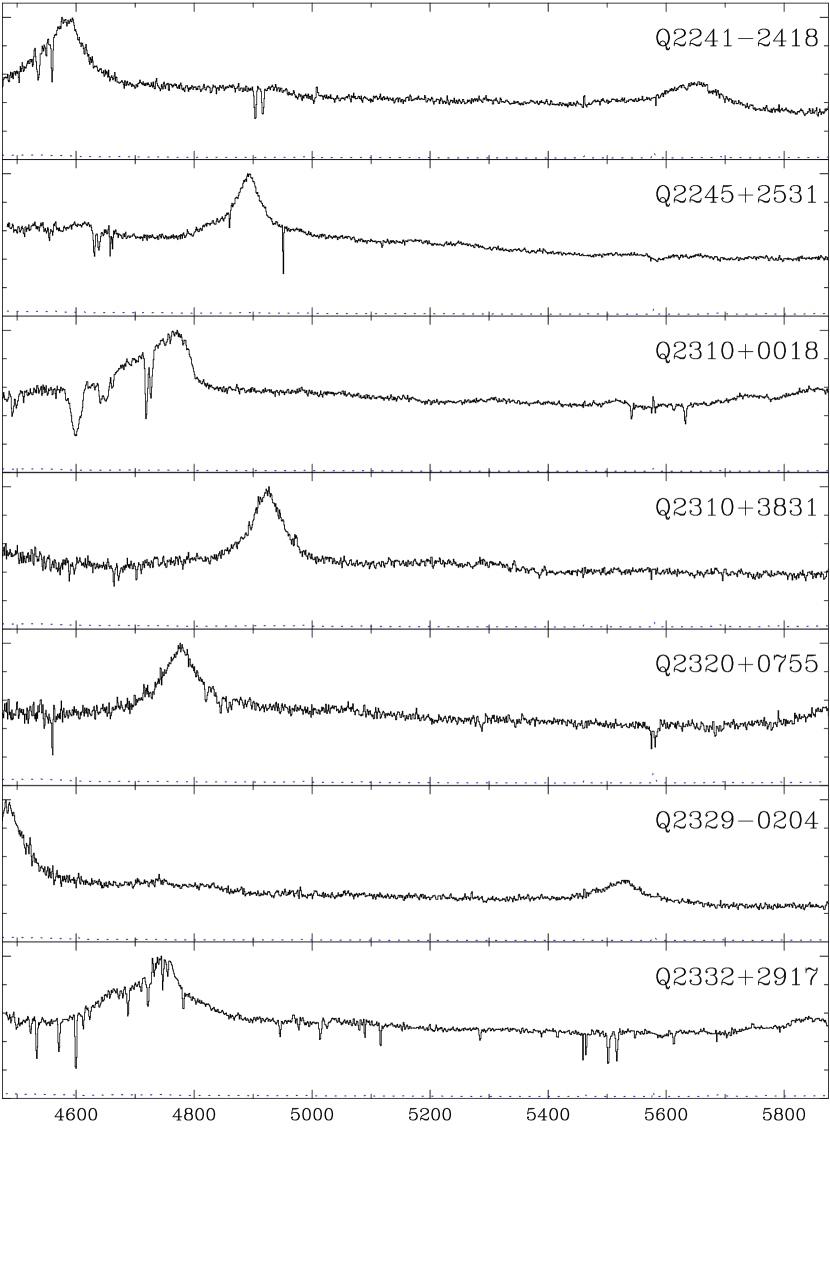
In Figures 2–21, we show the blue and red camera exposures of the 79 quasars which comprise the survey. For each blue exposure, the flux (solid line), error (dotted line), and continuum (dashed line) level is shown. For the red camera exposures, we display the flux and error levels. The spectra have well calibrated relative flux, but we do not assign a numerical value to the flux, since absolute flux calibration was not a goal for the survey, and few exposures were made under photometric conditions.
3.2 Notes on Individual QSO Spectra
We now discuss various aspects of the individual QSO spectra in the survey. Table 4 lists 140 systems with strong absorption in H I and metals. These systems were found by scanning the blue camera spectra by eye to find systems which showed Ly absorption which appeared to have either significant equivalent width, saturated absorption, or a combination of the two. For those systems, both the blue and red camera exposures were then scanned for metal absorption at the same redshift as the H I absorber. Finally, both blue and red camera exposures were inspected for strong metal absorption. When absorption was found, the ion was identified, and the spectra were scanned for absorption from other metal species at that redshift. Spectral regions containing Ly forest absorption were not scanned for metal lines, as they would be blended with H I, and possibly misidentified. In some cases, only a metal transition such as C IV, Mg II, or Fe II is given, since the H I at the redshift of these absorbers is either outside of the spectral coverage of the data, or is not visually strong compared to the local Ly forest at nearby wavelengths.
Table 4 is not a complete census of the metal absorption for the survey, but instead attempts to highlight systems with a large H I column density, such as Lyman limit and damped Lyman alpha systems, along with systems showing strong absorption in metals. Additional notes on individual QSOs are given below.
Q1422+4224: There appears to be strong H I absorption at . Possible absorption in metals at the expected positions of C II and Si IV is seen, but the SNR at these wavelengths is poor.
Q1542+3104: This QSOs contains considerable metal absorption near the C IV emission line. Moreover, the Ly forest in this QSOs appears to have many regions of highly clustered absorption. This QSO could be interpreted as a BAL (Weymann et al., 1991; Narayanan et al., 2004).
Q1559+0853: The absorption from C II corresponding at is uncertain, since the Si II absorption from the system at places Si II at nearly the same wavelengths.
Q1649+4007: The Fe II transitions for the absorber at which shows Mg II are all in the Ly forest, and are thus uncertain.
3.3 Emission Lines
Large samples of quasar emission line wavelengths have been presented and discussed by many authors (Wills, Netzer and Wills, 1985; Weymann et al., 1991; Tytler and Fan, 1992; Laor et al. 1995; Forster et al. 2001; Constantin et al., 2002 and many others). For this survey, we also present the observed emission line wavelengths.
For each quasar in the survey, we attempted to identify all emission lines with wavelengths greater than the O VI–Ly emission line blend. The results of the emission line identifications are given in Table 5, where the observed wavelengths for each emission line are given. In total, 526 emission lines were identified. The wavelengths in Table 5 were determined by either fitting gaussians to the top third of the flux of the lines when possible, or by determining the line emission peak by eye. For those emission lines in the Ly forest, all wavelengths listed were determined by eye. Because the methods used to determine the emission line peaks are fairly inexact, and because the effects of signal to noise and Ly forest and strong metal absorption hamper the process, we estimate that the peak wavelengths have errors of Å.
In the process of fitting the quasar continuum level, as noted in Tytler et al. (2004), it was found that emission line features were often required at rest wavelengths of 1071, 1123, and 1176 Å. The values for the rest wavelength, , listed in Table 5 come either from Table 2 of Telfer et al. (2002) or from Wills et al. (1995), except for the lines near 1071, 1123, and 1176 Å that we discuss below.
In Table 6, we list the redshifts, denoted by , of each quasar as determined by taking the mean of redshifts given by each line observed. We do not use the lines in the first three transitions listed in Table 5, because the errors on these lines are in general larger. To help determine the exact rest wavelengths of the emission lines with wavelengths less than Ly, Table 6 also provides the rest wavelengths for the first three transitions of Table 5 as determined by dividing their observed wavelengths by . We find the rest wavelengths for these transitions to be , , and Å. These wavelengths are consistent with the identifications cited in Tytler et al. (2004).
In some cases, we note that the blend of O I and Si II at Å is dominated by the Si II 1309 transition, and may cause additional errors in the determination of the quasar’s redshift. In Table 7, we list those emission lines which were observed in some spectra but are not in Table 5, and where possible, identify the transition responsible for the line. Finally, many quasars in the survey show a shelf like emission feature extending between He II 1640 and O III. We end with some notes on the emission lines for individual quasars.
Q0743+6601 and Q1122-1648: The C III∗ emission line is seen in this QSO but is too heavily blended with the wing of Ly to give a value for the peak position.
Q2134+1531: A broad emission shelf feature is seen, consistent with the feature at Å blending with the O VI–Ly blend.
Q2140+2403: This is the only QSO for which we do not provide a measurement of the Ly emission line, due to the effects of the very strong associated absorber near the expected emission line peak.
Q2245+2531: The Si IV–O IV blend appears to be dominated entirely by Si IV 1393.
4 Acknowledgements
This work was funded in part by grant NAG5-13113 from NASA and by grant AST-0098731 from the NSF. The spectra were obtained from the Lick observatory and we thank the Lick observatory staff. This research has made extensive use of the NASA/IPAC Extragalactic Database (NED) which is operated by JPL, under contract with NASA.
References
- (1) Barthel, P.D., Tytler, D., and Thomson, B. 1990, A&AS, 82 339
- (2) Constantin, A., Shields, J.C., Hamann, F., Foltz, C.B., and Chaffee, F.H. 2002, ApJ, 565, 50
- (3) Forster, K., Green, P.J., Aldcroft, T.L., Vestergaard, M., Foltz, C.B., Hewett, P.C. 2001 ApJS, 134, 35
- (4) Green, P.J., Aldcroft, T.L., Mathur, S., Wilkes, B.J. and Elvis, M. 2001, ApJ 558, 109
- (5) Gregg, M.D., Becker, R.H., White, R.L., Helfand, D.J., McMahon, R.G., and Hook, I.M. 1996, AJ, 112, 407
- (6) Hewett, P.C., Foltz, C.B., and Chaffee, F.H. 1995, AJ 109, 1498
- (7) Kim, T.S., Viel, M., Haehnelt, M. G., Carswell, R. F., and Cristiani, S. 2004, MNRAS, 347, 355
- (8) Kirkman, D., Tytler, D., Suzuki, N., O’Meara, J.M., and Lubin, D. 2003, ApJS, 149, 1
- (9) Lanzetta, K.M., Wolfe, A.M., and Turnshek, D.A., 1987, ApJ, 322, 739
- (10) Narayanan, D., Hamann, F., Barlow, T. Burbidge, E.M., Cohen, R.D., Junkkarinen, V., and Lyons, R. 2004, ApJ, 601, 715
- (11) Laor, A., Bachall, J.N., Jannuzie, B.T., Schneider, D.P., and Green, R.F. 1995, ApJS, 99, 1
- (12) Sargent, W.L.W, Steidel, C., and Boksenberg, A. 1988, ApJS, 68, 539
- (13) Sargent, W.L.W, Steidel, C., and Boksenberg, A. 1989, ApJS, 69, 703
- (14) Scott, J., Bechtold, J., and Dobrzycki, A. 2000, ApJS 130, 37
- (15) Suzuki, N., Tytler, D., Kirkman, D., O’Meara, J. M., and Lubin, D., 2003, PASP 115, 1050S
- (16) Telfer, R. C., Zheng, W.,Kriss, G. A., and Davidsen, A. F., 2002, ApJ 565,773
- (17) Tytler, D., and Fan, X. 1992, ApJS, 79, 1
- (18) Tytler, D., Kirkman, D., O’Meara, J.M., Suzuki, N., Orin, A., Lubin, D., Paschos, P., Jena, T., Lin, W., and Norman, M.L. 2004, submitted to ApJ, astro-ph/0403688
- (19) Weymann, R.J., Morris, S.L., Foltz, C.B., and Hewett, P.C. 1991, ApJ, 373, 23
- (20) Wills, B.J., Netzer, H., and Wills, D. 1985, ApJ, 288, 94
- (21) Wills,B. J., Thompson, K. L., Han, M., Netzer,H., Wills,D., Baldwin,J. A., Ferland,G. J., Browne,I. W. A., and Brotherton, M. S. 1995, ApJ, 447, 139
- (22) Wisotzki, L., Christlieb, N., Bade, N., Beckmann, V., Koehler, T., Vanelle, C., and Reimers, D. 2000, A&A, 358, 77
| Name | Coordinates | Coordinates | V | AAThis redshift is approximate, from the Ly peak | Exposure |
|---|---|---|---|---|---|
| Time | |||||
| (1950) | (B1950) | (J2000) | (seconds) | ||
| Q0001–2340 | 00 01 11.50 –23 40 37.0 | 00 03 44.95 –23 23 54.7 | 16.70 | 2.26 | 1380 |
| Q0014–0420 | 00 14 09.36 –04 20 57.0 | 00 16 42.80 –04 04 17.0 | 16.65 | 1.96 | 720 |
| Q0049+0124 | 00 49 59.56 +01 24 23.3 | 00 52 33.71 +01 40 40.5 | 17.00 | 2.29 | 2700 |
| Q0109+0213 | 01 09 42.31 +02 13 53.1 | 01 12 16.91 +02 29 47.6 | 17.64 | 2.34 | 4800 |
| Q0150–2015 | 01 50 04.98 –20 15 52.6 | 01 52 27.30 –20 01 06.0 | 17.10 | 2.14 | 2700 |
| Q0153+7428 | 01 53 04.33 +74 28 05.6 | 01 57 34.96 +74 42 43.2 | 16.00 | 2.34 | 1800 |
| Q0218+3707 | 02 18 02.70 +37 07 04.1 | 02 21 05.50 +37 20 46.0 | 17.50 | 2.41 | 3600 |
| Q0226–0350 | 02 26 22.08 –03 50 58.6 | 02 28 53.21 –03 37 37.1 | 16.96 | 2.07 | 2400 |
| Q0248+3402 | 02 48 23.35 +34 02 22.0 | 02 51 27.70 +34 14 41.0 | 17.70 | 2.22 | 4200 |
| Q0348+0610 | 03 48 36.62 +06 10 15.5 | 03 51 16.53 +06 19 14.2 | 17.60 | 2.05 | 3600 |
| Q0421+0157 | 04 21 32.67 +01 57 32.7 | 04 24 08.56 +02 04 24.9 | 17.04 | 2.04 | 3000 |
| Q0424–1309 | 04 24 47.81 –13 09 32.9 | 04 27 07.30 –13 02 53.0 | 17.50 | 2.16 | 4200 |
| Q0450–1310 | 04 50 54.00 –13 10 39.0 | 04 53 12.83 –13 05 46.1 | 16.50 | 2.25 | 3600 |
| Q0726+2531 | 07 26 25.23 +25 31 07.2 | 07 29 28.47 +25 24 51.9 | 17.81 | 2.30 | 4800 |
| Q0743+6601 | 07 43 58.60 +66 01 00.0 | 07 48 46.22 +65 53 31.4 | 17.00 | 2.20 | 3600 |
| Q0748+6105 | 07 48 01.84 +61 05 35.9 | 07 52 22.50 +60 57 52.0 | 17.50 | 2.49 | 4200 |
| Q0752+3429 | 07 52 10.00 +34 29 31.3 | 07 55 24.00 +34 21 34.0 | 17.80 | 2.12 | 4500 |
| Q0800+3031 | 08 00 34.43 +30 31 24.1 | 08 03 42.00 +30 22 55.0 | 16.70 | 2.02 | 3600 |
| Q0836+7104 | 08 36 21.53 +71 04 22.5 | 08 41 24.36 +70 53 42.2 | 16.50 | 2.18 | 2400 |
| Q0854+3324 | 08 54 21.61 +33 24 53.0 | 08 57 26.95 +33 13 17.2 | 17.43 | 2.33 | 4200 |
| Q0907+3811 | 09 07 44.95 +38 11 31.9 | 09 10 54.20 +37 59 15.0 | 17.30 | 2.15 | 3000 |
| Q0936+3653 | 09 36 32.36 +36 53 35.9 | 09 39 35.10 +36 40 00.0 | 17.00 | 2.02 | 2400 |
| Q0937–1818 | 09 37 30.22 –18 18 37.3 | 09 39 51.10 –18 32 15.0 | 16.20 | 2.36 | 3000 |
| Q1023+3009 | 10 23 58.86 +30 09 29.9 | 10 26 48.10 +29 54 12.0 | 17.10 | 2.33 | 3600 |
| Q1103+6416 | 11 03 03.98 +64 16 21.9 | 11 06 10.70 +64 00 09.0 | 15.80 | 2.20 | 1800 |
| Q1116+2106 | 11 16 44.49 +21 06 11.4 | 11 19 22.90 +20 49 46.0 | 17.30 | 2.46 | 3600 |
| Q1122–1648 | 11 22 12.28 –16 48 47.4 | 11 24 42.80 –17 05 17.0 | 16.50 | 2.40 | 2700 |
| Q1130+3135 | 11 30 06.36 +31 35 24.3 | 11 32 45.20 +31 18 50.0 | 17.00 | 2.29 | 2400 |
| Q1147+6556 | 11 47 53.77 +65 56 08.8 | 11 50 34.50 +65 39 28.0 | 16.20 | 2.21 | 2360 |
| Q1222+2251 | 12 22 56.58 +22 51 49.3 | 12 25 27.40 +22 35 13.0 | 15.49 | 2.05 | 3000 |
| Q1224–0812 | 12 24 02.65 –08 12 52.8 | 12 26 37.50 –08 29 29.0 | 16.83 | 2.16 | 2400 |
| Q1224+2905 | 12 24 57.90 +29 05 23.0 | 12 27 27.40 +28 48 47.0 | 17.00 | 2.25 | 3600 |
| Q1225+3145 | 12 25 56.07 +31 45 12.6 | 12 28 24.96 +31 28 37.6 | 15.87 | 2.18 | 2100 |
| Q1231+2924 | 12 31 27.08 +29 24 20.8 | 12 33 55.51 +29 07 48.9 | 16.84 | 2.01 | 2400 |
| Q1247+2657 | 12 47 39.09 +26 47 27.1 | 12 50 05.75 +26 31 07.7 | 15.80 | 2.03 | 1200 |
| Q1251+2636 | 12 51 56.97 +26 36 21.8 | 12 54 23.08 +26 20 06.5 | 16.45 | 2.03 | 2100 |
| Q1307+4617 | 13 07 58.49 +46 17 20.8 | 13 10 11.60 +46 01 24.0 | 16.74 | 2.13 | 3000 |
| Q1312+7837 | 13 12 30.24 +78 37 44.6 | 13 13 21.30 +78 21 53.0 | 16.40 | 2.00 | 2400 |
| Q1326+3923 | 13 26 10.24 +39 23 47.2 | 13 28 23.70 +39 08 17.0 | 16.60 | 2.32 | 2100 |
| Q1329+4117 | 13 29 29.82 +41 17 22.7 | 13 31 41.10 +41 01 58.0 | 16.30 | 1.93 | 4500 |
| Q1331+1704 | 13 31 10.00 +17 04 25.8 | 13 33 35.78 +16 49 04.0 | 16.71 | 2.08 | 2700 |
| Q1416+0906 | 14 16 23.30 +09 06 14.0 | 14 18 51.09 +08 52 27.1 | 17.00 | 2.01 | 2400 |
| Q1418+2254 | 14 18 51.06 +22 54 58.3 | 14 21 08.72 +22 41 17.4 | 16.60 | 2.19 | 1800 |
| Q1422+4224 | 14 22 37.86 +42 24 01.6 | 14 24 36.00 +42 10 30.0 | 17.10 | 2.21 | 4200 |
| Q1425–1338 | 14 25 02.87 –13 38 19.4 | 14 27 46.40 –13 51 44.0 | 17.19 | 2.03 | 2400 |
| Q1435+6349 | 14 35 37.25 +63 49 36.0 | 14 36 45.80 +63 36 37.8 | 15.00 | 2.06 | 1500 |
| Q1517+2556 | 15 17 08.11 +23 56 52.0 | 15 19 19.40 +23 46 02.0 | 16.40 | 1.90 | 4500 |
| Q1542+3104 | 15 42 48.48 +31 04 42.0 | 15 44 49.00 +30 55 21.0 | 17.00 | 2.28 | 2400 |
| Q1542+5408BBBAL QSO | 15 42 41.88 +54 08 25.6 | 15 43 59.40 +53 59 03.0 | 16.00 | 2.36 | 1800 |
| Q1559+0853 | 15 59 57.80 +08 53 53.0 | 16 02 22.56 +08 45 36.3 | 16.70 | 2.26 | 2400 |
| Q1611+4719 | 16 11 10.53 +47 19 32.2 | 16 12 39.90 +47 11 57.0 | 17.60 | 2.38 | 3600 |
| Q1618+5303 | 16 18 28.71 +53 03 20.0 | 16 19 42.30 +52 56 13.0 | 17.50 | 2.34 | 4500 |
| Q1626+6433 | 16 26 20.41 +64 33 32.3 | 16 26 45.60 +64 26 55.0 | 15.80 | 2.31 | 1800 |
| Q1632+3209 | 16 32 17.96 +32 09 45.7 | 16 34 12.78 +32 03 35.4 | 16.93 | 2.34 | 2100 |
| Q1649+4007 | 16 49 57.45 +40 07 16.7 | 16 51 37.56 +40 02 18.7 | 17.18 | 2.33 | 2400 |
| Q1703+5350 | 17 03 01.49 +53 50 57.2 | 17 04 06.70 +53 46 53.0 | 17.40 | 2.37 | 3600 |
| Q1705+7101 | 17 05 00.60 +71 01 34.0 | 17 04 26.08 +70 57 34.7 | 17.50 | 2.01 | 4200 |
| Q1716+4619 | 17 16 01.69 +46 19 39.0 | 17 17 26.80 +46 16 31.0 | 17.10 | 2.11 | 2400 |
| Q1720+2501 | 17 20 49.93 +25 01 20.6 | 17 22 52.99 +24 58 34.7 | 17.10 | 2.25 | 4000 |
| Q1754+3818 | 17 54 58.67 +38 18 10.2 | 17 56 39.70 +38 17 52.0 | 17.50 | 2.16 | 2700 |
| Q1833+5811 | 18 33 09.83 +58 11 07.8 | 18 33 57.00 +58 13 34.0 | 17.00 | 2.03 | 1800 |
| Q1834+6117 | 18 34 46.51 +61 17 07.3 | 18 35 19.68 +61 19 40.0 | 17.60 | 2.27 | 2700 |
| Q1848+6705 | 18 48 26.30 +67 05 07.0 | 18 48 25.35 +67 08 37.2 | 17.50 | 2.03 | 1500 |
| Q2044–1650 | 20 44 30.78 –16 50 09.4 | 20 47 19.67 –16 39 05.8 | 17.36 | 1.94 | 3600 |
| Q2103+1843 | 21 03 50.50 +18 43 46.0 | 21 06 08.52 +18 55 49.9 | 16.80 | 2.21 | 2400 |
| Q2134+0028 | 21 34 05.21 +00 28 25.0 | 21 36 38.59 +00 41 54.2 | 16.79 | 1.94 | 2400 |
| Q2134+1531 | 21 34 01.07 +15 31 38.2 | 21 36 23.80 +15 45 07.0 | 17.30 | 2.13 | 3600 |
| Q2135+1326 | 21 35 40.84 +13 26 19.9 | 21 38 05.20 +13 39 53.0 | 17.10 | 2.30 | 2700 |
| Q2140+2403 | 21 40 31.75 +24 03 33.0 | 21 42 48.50 +24 17 18.0 | 16.80 | 2.16 | 2400 |
| Q2147–0825 | 21 47 09.10 –08 25 17.9 | 21 49 48.17 –08 11 16.2 | 16.18 | 2.12 | 2400 |
| Q2150+0522 | 21 50 54.30 +05 22 08.6 | 21 53 24.67 +05 36 18.9 | 17.77 | 1.98 | 6000 |
| Q2157–0036 | 21 57 20.39 –00 36 15.3 | 21 59 54.45 –00 21 50.3 | 16.98 | 1.96 | 4200 |
| Q2241–2418 | 22 41 56.68 –24 18 48.8 | 22 44 40.30 –24 03 02.0 | 16.95 | 1.96 | 1800 |
| Q2245+2531 | 22 45 03.78 +25 31 39.3 | 22 47 27.40 +25 47 30.0 | 17.60 | 2.16 | 6000 |
| Q2310+0018BBBAL QSO | 23 10 50.80 +00 18 24.1 | 23 13 24.45 +00 34 44.5 | 17.00 | 2.08 | 1800 |
| Q2310+3831 | 23 10 36.18 +38 31 22.7 | 23 12 58.79 +38 47 42.6 | 17.50 | 2.18 | 3000 |
| Q2320+0755 | 23 20 03.91 +07 55 33.6 | 23 22 36.08 +08 12 01.6 | 17.50 | 2.08 | 4500 |
| Q2329-0204 | 23 29 02.27 –02 04 40.4 | 23 31 36.33 –01 48 06.5 | 17.00 | 1.89 | 2400 |
| Q2332+2917 | 23 32 32.03 +29 17 39.5 | 23 35 01.50 +29 34 15.0 | 17.60 | 2.07 | 6000 |
| Name | Observation Date | Slit Width | SNR | SNR |
|---|---|---|---|---|
| (1950) | (Year-Month-Day) | (arcseconds) | (1070 Å) | (1170 Å) |
| Q0001–2340 | 2001-07-20 | 3.0 | 9.04 | 14.33 |
| Q0014–0420 | 2001-07-19 | 3.0 | 3.19 | 8.88 |
| Q0049+0124 | 2001-09-13 | 3.0 | 15.24 | 24.00 |
| Q0109+0213 | 2001-12-16 | 2.0 | 22.73 | 34.25 |
| Q0150–2015 | 2001-09-13 | 3.0 | 9.26 | 19.29 |
| Q0153+7428 | 2001-09-13 | 3.0 | 7.53 | 13.14 |
| Q0218+3707 | 2002-01-11 | 2.0 | 22.08 | 29.59 |
| Q0226–0350 | 2003-01-30 | 2.0 | 5.45 | 14.12 |
| Q0248+3402 | 2002-01-11 | 2.0 | 23.27 | 36.34 |
| Q0348+0610 | 2003-01-30 | 2.0 | 6.02 | 16.54 |
| Q0421+0157 | 2001-12-16 | 2.0 | 6.19 | 16.09 |
| Q0424–1309 | 2002-01-11 | 2.0 | 1.71 | 2.95 |
| Q0450–1310 | 2003-01-29 | 2.0 | 11.99 | 19.20 |
| Q0726+2531 | 2003-01-31 | 2.0 | 8.94 | 14.36 |
| Q0743+6601 | 2001-12-16 | 2.0 | 17.36 | 25.15 |
| Q0748+6105 | 2001-12-16 | 2.0 | 16.62 | 20.73 |
| Q0752+3429 | 2003-01-30 | 2.0 | 9.18 | 15.98 |
| Q0800+3031 | 2002-04-09 | 1.5 | 8.09 | 21.69 |
| Q0836+7104 | 2002-03-09 | 2.0 | 15.92 | 23.20 |
| Q0854+3324 | 2003-01-30 | 2.0 | 7.29 | 11.77 |
| Q0907+3811 | 2003-01-31 | 2.0 | 5.42 | 9.70 |
| Q0936+3653 | 2003-01-31 | 2.0 | 1.24 | 5.50 |
| Q0937–1818 | 2003-01-29 | 2.0 | 9.59 | 15.87 |
| Q1023+3009 | 2002-04-09 | 1.5 | 6.28 | 9.02 |
| Q1103+6416 | 2003-01-31 | 2.0 | 15.16 | 24.08 |
| Q1116+2106 | 2002-04-11 | 1.5 | 4.44 | 5.64 |
| Q1122–1648 | 2003-01-29 | 2.0 | 15.23 | 25.84 |
| Q1130+3135 | 2003-01-30 | 2.0 | 9.69 | 15.89 |
| Q1147+6556 | 2002-04-09 | 1.5 | 3.54 | 6.55 |
| Q1222+2251 | 2003-01-29 | 2.0 | 9.24 | 22.63 |
| Q1224–0812 | 2003-01-31 | 2.0 | 6.48 | 12.82 |
| Q1224+2905 | 2002-04-11 | 1.5 | 4.85 | 6.54 |
| Q1225+3145 | 2001-05-19 | 3.0 | 27.77 | 45.87 |
| Q1231+2924 | 2003-01-30 | 2.0 | 10.16 | 22.86 |
| Q1247+2657 | 2001-05-19 | 2.0 | 21.49 | 45.37 |
| Q1251+2636 | 2001-05-19 | 2.0 | 5.28 | 15.57 |
| Q1307+4617 | 2002-03-09 | 2.0 | 13.89 | 24.74 |
| Q1312+7837 | 2003-01-29 | 2.0 | 8.36 | 20.90 |
| Q1326+3923 | 2003-01-31 | 2.0 | 11.63 | 16.66 |
| Q1329+4117 | 2003-07-28 | 2.0 | – AAThis rest wavelength was not covered by this spectrum | 9.49 |
| Q1331+1704 | 2002-04-11 | 1.5 | 7.53 | 14.35 |
| Q1416+0906 | 2003-01-29 | 2.0 | 3.37 | 10.42 |
| Q1418+2254 | 2001-05-19 | 2.0 | 11.98 | 20.80 |
| Q1422+4224 | 2002-03-09 | 2.0 | 5.22 | 9.53 |
| Q1425–1338 | 2003-01-30 | 2.0 | 1.50 | 6.34 |
| Q1435+6349 | 2001-05-19 | 2.0 | 8.14 | 18.13 |
| Q1517+2556 | 2003-07-29 | 2.0 | – AAThis rest wavelength was not covered by this spectrum | 8.31 |
| Q1542+3104 | 2001-05-18 | 2.0 | 7.83 | 9.60 |
| Q1542+5408BBBAL QSO | 2001-05-19 | 2.0 | 17.20 | 21.52 |
| Q1559+0853 | 2001-07-19 | 3.0 | 12.65 | 21.96 |
| Q1611+4719 | 2002-04-11 | 1.5 | 8.94 | 16.60 |
| Q1618+5303 | 2001-07-20 | 3.0 | 39.17 | 54.79 |
| Q1626+6433 | 2001-07-18 | 3.0 | 30.55 | 45.82 |
| Q1632+3209 | 2001-05-19 | 2.0 | 9.99 | 16.28 |
| Q1649+4007 | 2001-07-18 | 3.0 | 18.98 | 27.32 |
| Q1703+5350 | 2001-07-18 | 3.0 | 32.88 | 43.43 |
| Q1705+7101 | 2001-07-19 | 2.0 | 2.74 | 8.52 |
| Q1716+4619 | 2001-05-18 | 3.0 | 13.29 | 19.53 |
| Q1720+2501 | 2001-07-17 | 3.0 | 12.49 | 18.50 |
| Q1754+3818 | 2001-05-19 | 2.0 | 7.90 | 26.11 |
| Q1833+5811 | 2001-05-18 | 3.0 | 3.41 | 8.42 |
| Q1834+6117 | 2001-05-19 | 2.0 | 9.29 | 14.67 |
| Q1848+6705 | 2001-05-18 | 3.0 | 3.71 | 8.38 |
| Q2044–1650 | 2001-07-18 | 3.0 | – AAThis rest wavelength was not covered by this spectrum | 15.63 |
| Q2103+1843 | 2001-07-17 | 3.0 | 32.90 | 46.93 |
| Q2134+0028 | 2001-07-19 | 3.0 | – AAThis rest wavelength was not covered by this spectrum | 22.77 |
| Q2134+1531 | 2001-07-18 | 3.0 | 15.16 | 25.12 |
| Q2135+1326 | 2001-07-17 | 3.0 | 15.78 | 24.27 |
| Q2140+2403 | 2001-07-17 | 3.0 | 17.08 | 31.21 |
| Q2147–0825 | 2003-07-28 | 2.0 | 4.36 | 9.49 |
| Q2150+0522 | 2003-07-29 | 2.0 | 3.97 | 7.96 |
| Q2157–0036 | 2003-07-28 | 2.0 | – AAThis rest wavelength was not covered by this spectrum | 20.79 |
| Q2241–2418 | 2001-07-17 | 3.0 | 2.69 | 10.95 |
| Q2245+2531 | 2003-07-28 | 2.0 | 13.23 | 26.09 |
| Q2310+0018BBBAL QSO | 2001-07-11 | 3.0 | 11.71 | 20.45 |
| Q2310+3831 | 2001-07-18 | 3.0 | 10.80 | 17.77 |
| Q2320+0755 | 2001-07-20 | 3.0 | 6.38 | 12.66 |
| Q2329-0204 | 2001-07-19 | 3.0 | 6.38 | 12.66 |
| Q2332+2917 | 2003-07-29 | 2.0 | 8.43 | 21.88 |
| Name | Coordinates (J2000) | V | Spectral Type |
|---|---|---|---|
| G191B2B | 05 05 30.6 + 52 49 54 | 11.78 | DAO |
| Feige 34 | 10 39 36.7 + 43 06 10 | 11.18 | DO |
| Feige 67 | 12 41 51.8 + 17 31 20 | 11.81 | sdO |
| BD+33d2642 | 15 51 59.9 + 32 56 55 | 10.81 | B2IV |
| BD+28d4211 | 21 51 11.1 + 28 51 52 | 10.51 | 0p |
| Feige 110 | 23 19 58.4 – 05 09 56 | 11.82 | DOp |
| Name | Ions | Notes | |
|---|---|---|---|
| (1950) | |||
| Q0001–2340 | 2.184 | H I, C II, C IV, Al II, Si II, Si IV | |
| 0.431 | Mg II | ||
| Q0014–0420 | 0.806 | Mg II | |
| Q0049+0124 | 1.828 | H I, C IV, Al II, Al III, Si IV | |
| 1.663 | C IV | ||
| 1.077 | Mg II, Fe II | ||
| Q0109+0213 | 2.212 | C IV | |
| 1.987 | C IV | ||
| 1.841 | H I, C IV, Al II | ||
| Q0150–2015 | 2.134 | H I, C IV, N V, Si IV | AALikely associated with QSO |
| 2.010 | C IV | ||
| 0.780 | Mg II, Fe II | ||
| Q0153+7428 | 2.346 | H I, C IV, N V | AALikely associated with QSO |
| 0.745 | Mg II | ||
| Q0218+3707 | 2.337 | H I, C II, C IV, O I, Al II, Si II, Si IV | |
| 2.144 | C IV | ||
| Q0248+3402 | 2.167 | H I, C IV | |
| Q0348+0610 | 2.034 | H I, C IV, Si IV | |
| 2.026 | H I, C IV, Si IV | ||
| 1.969 | H I, C IV, Si IV | ||
| Q0421+0157 | 1.637 | H I, C IV | |
| Q0450–1310 | 2.231 | H I, C IV, N IV | AALikely associated with QSO |
| 2.107 | C IV, Si IV | ||
| 2.067 | H I, C II, C IV, O I, Si II, Si IV | BBDamped Lyman Alpha system | |
| 0.494 | Mg II | ||
| Q0726+2531 | 2.288 | H I, C IV, N V, O VI | AALikely associated with QSO |
| Q0743+6601 | 1.695 | H I, C IV | |
| 1.650 | H I, C IV | ||
| 0.638 | Mg II | ||
| Q0748+6105 | 2.209 | H I, C IV | |
| Q0752+3429 | 2.068 | C IV | |
| 2.051 | H I | CCThe strong H I absorption at this redshift shows no apparent metal absorption, and may instead be a blend | |
| 1.501 | C IV | ||
| 1.063 | Mg II, Fe II | ||
| Q0800+3031 | 1.862 | H I | CCThe strong H I absorption at this redshift shows no apparent metal absorption, and may instead be a blend |
| Q0854+3324 | 2.269 | H I, C II, C IV, O I, Al II, Si II, Si IV | |
| Q0836+7104 | 0.915 | Mg II, Fe II | |
| Q0907+3811 | 1.820 | H I, C IV | |
| Q0937–1818 | 0.941 | Mg II, Fe II | |
| Q1103+6416 | 1.941 | C IV | |
| 1.892 | H I, Si IV | ||
| Q1122–1648 | 0.682 | Mg II, Fe II | |
| Q1130+3135 | 2.210 | C IV | |
| 2.112 | C IV | ||
| 2.021 | H I, C II, C IV, Al II, Si II, Si IV | ||
| Q1222+2251 | 1.936 | H I, C II, C IV, Si IV | |
| 1.486 | C IV | ||
| 0.668 | Mg II | ||
| Q1224–0812 | 1.890 | H I, C IV | |
| 1.602 | C IV, Al II, Al III, Si II | ||
| Q1225+3145 | 2.121 | C IV | |
| 1.795 | H I, C IV, Al II, Al III, Si II, Si IV | ||
| 1.626 | C IV | ||
| Q1231+2924 | 1.943 | C IV | |
| 1.167 | C IV, Al III, Fe II | ||
| Q1247+2657 | 1.959 | H I, C IV, Si IV | |
| 1.408 | C IV | ||
| 1.223 | Fe II | ||
| 0.762 | Mg II | ||
| Q1326+3923 | 2.150 | H I, C IV, Si IV | |
| 2.131 | H I, Si II, C IV, Al II, Si II, Si IV, Fe II | ||
| 2.088 | H I | CCThe strong H I absorption at this redshift shows no apparent metal absorption, and may instead be a blend | |
| Q1329+4117 | 1.940 | H I, N V, C IV | AALikely associated with QSO |
| 1.600 | H I, C IV | ||
| 1.471 | C IV | ||
| 0.922 | Mg II | ||
| Q1331+1704 | 1.776 | H I, C II, C IV, O I, Si II, Si IV | BBDamped Lyman Alpha system |
| 0.745 | Mg II, Fe II | ||
| Q1418+2254 | 2.191 | H I, C IV, Si IV | AALikely associated with QSO |
| 1.874 | H I, C IV, Si IV | ||
| Q1422+4224 | 1.951 | H I | |
| Q1435+6349 | 1.923 | H I, C II, C IV, Al II, Si II, Si IV | |
| Q1517+2356 | 1.416 | C IV | |
| Q1542+3104 | 2.076 | H I, C II, C IV, Al II, Al III, Si IV | |
| 1.725 | H I, C IV | ||
| Q1542+5408DDBAL QSO | 2.224 | H I, C IV, N V, O VI | EEBAL absorption |
| Q1559+0853 | 2.281 | H I, C IV, N V, Si IV | AALikely associated with QSO |
| 2.252 | H I, C II, C IV, Si II | ||
| 2.122 | H I, C IV, Si IV | ||
| 1.842 | H I, C II, C IV, Al II, Si II | BBDamped Lyman Alpha system | |
| Q1618+5303 | 2.125 | H I, C II, Al, II, Si II | |
| 2.109 | H I, C II, C IV, Al II, Si II, Si IV | ||
| Q1626+6433 | 2.292 | H I, C IV, Si IV | |
| 2.245 | H I, C IV | ||
| 2.110 | H I, C II, C IV, Al II, Al III, Si IV | ||
| 2.099 | C IV | ||
| 2.055 | H I, C IV, Si IV | ||
| 1.927 | H I, C IV, Al II, Al III, Si II, Si IV | ||
| Q1632+3209 | 2.350 | H I, C IV, Si IV | AALikely associated with QSO |
| 2.258 | C IV | ||
| 2.092 | H I, C II, C IV, Al II, Al III, Si II | BBDamped Lyman Alpha system | |
| Q1649+4007 | 1.891 | H I, C IV, Al II, Al III, Si II, Si IV | |
| 1.799 | H I, C IV | ||
| 1.638 | C IV, Al III | ||
| 0.499 | Mg II, Fe II | ||
| Q1703+5350 | 2.370 | H I, C IV, N V, Si IV | AALikely associated with QSO |
| 2.338 | C IV, N V, Si IV | ||
| 2.300 | C IV, Si IV | ||
| 1.017 | Mg II, Fe II | ||
| 0.699 | Mg II, Fe II | ||
| 0.679 | Mg II, Fe II | ||
| Q1705+7101 | 0.713 | Mg II, Fe II | |
| Q1716+4619 | 2.132 | H I, C IV, N V, Si IV | AALikely associated with QSO |
| 2.049 | H I, C IV | ||
| 1.563 | C IV | ||
| 0.980 | Mg II | ||
| 0.878 | Mg II | ||
| Q1720+2501 | 0.925 | Mg II | |
| 0.817 | Mg II | ||
| Q1754+3818 | 1.784 | H I, C II, C IV, O I, Al II, Al III, Si II, Si IV | BBDamped Lyman Alpha system |
| Q1833+5811 | 2.038 | H I, C IV | AALikely associated with QSO |
| Q1834+6117 | 2.210 | H I, C IV | |
| 1.100 | Mg II, Fe II | ||
| Q2044–1650 | 1.920 | H I, C IV, Si IV | |
| Q2103+1843 | 2.110 | H I, C IV, Si IV | |
| 1.964 | H I, C IV, Si IV | ||
| Q2134+0028 | 0.629 | Mg II, Fe II | |
| Q2134+1531 | 2.045 | C IV | |
| 1.475 | C IV | ||
| 1.181 | Fe II | ||
| Q2140+2402 | 2.163 | H I, C II, C IV, O I, Al II, Si II | AALikely associated with QSO |
| 0.962 | Mg II | ||
| Q2150+0522 | 1.990 | H I, C IV, N V | AALikely associated with QSO |
| 1.883 | H I, C II, O I, Al II, Si II | ||
| 1.730 | H I, C IV | ||
| Q2157–0036 | 1.963 | H I, C IV, N V | AALikely associated with QSO |
| 1.650 | C IV | ||
| Q2241–2418 | 0.754 | Mg II, Fe II | |
| Q2245+2531 | 1.991 | H I, C IV | |
| 0.422 | Mg II | ||
| Q2310+0018DDBAL QSO | 2.048 | H I, C IV, Si IV | |
| 1.999 | C IV | ||
| 1.971 | C IV, N V, Si IV | EEBAL absorption | |
| 1.902 | H I, C IV | ||
| Q2332+2917 | 2.066 | H I, C IV, N V | AALikely associated with QSO |
| 1.874 | H I, C IV | ||
| 1.737 | C IV, Si IV | ||
| 1.671 | C IV | ||
| 0.968 | Mg II, Fe II |
| Name | N II | Fe III | C III∗ | Ly | N V | Si II | O I | C II | Si IV | C IV | He II | O III | Al III | C III |
|---|---|---|---|---|---|---|---|---|---|---|---|---|---|---|
| (1950) | He II | Si II | O IV | |||||||||||
| 1072 | 1123 | 1176 | 1216 | 1240 | 1263 | 1306 | 1335 | 1400 | 1549 | 1640 | 1664 | 1860 | 1909 | |
| Q0001–2340 | 3538.38 | 3967.11 | 4260.14 | 4356.04 | 4540.78 | 5053.71 | ||||||||
| Q0014–0420 | 3592.63 | 3659.56 | 3865.82 | 3954.43 | 4137.73 | 4576.02 | 5558.63 | 5503.24 | 5649.53 | |||||
| Q0049+0124 | 4008.89 | 4305.66 | 4612.29 | 5103.42 | ||||||||||
| Q0109+0213 | 3553.20 | 3735.64 | 4069.83 | 4151.09 | 4365.39 | 4672.75 | 5188.09 | 5496.71 | ||||||
| Q0150-2015 | 3511.28 | 3820.70 | 4102.96 | 4193.47 | 4399.05 | 4864.86 | 5146.26 | 5236.25 | 5838.29 | |||||
| Q0153+7428 | 4059.21 | 4135.19 | 4355.94 | 4459.03 | 4667.56 | 5166.69 | 5472.18 | 5577.23 | ||||||
| Q0218+3707 | 3647.41 | 4154.20 | 4318.01 | 4461.55 | 4554.49 | 4775.75 | 5289.66 | 5595.30 | 5670.37 | |||||
| Q0226–0350 | 3453.79 | 3721.64 | 4017.07 | 4107.23 | 4288.43 | 4740.79 | 5026.28 | 5090.13 | 5693.01 | 5846.98 | ||||
| Q0248+3402 | 3425.52 | 3612.57 | 3919.65 | 4061.37 | 4212.22 | 4306.73 | 4512.03 | 4992.58 | ||||||
| Q0348+0610 | 3715.06 | 3999.62 | 4284.32 | 4725.99 | 4996.42 | 5676.31 | 4847.23 | |||||||
| Q0421+0157 | 3702.54 | 4267.17 | 4725.57 | 5661.76 | 5826.89 | |||||||||
| Q0424–1309 | 3845.37 | 4898.42 | ||||||||||||
| Q0450–1310 | 3473.08 | 3952.42 | 4537.24 | 5031.81 | 5342.14 | |||||||||
| Q0726+2531 | 3880.68 | 4011.13 | 4617.62 | 5107.65 | ||||||||||
| Q0743+6601 | 3423.58 | 3581.04 | 3892.27 | 4176.63 | 4280.26 | 4472.10 | 4921.70 | |||||||
| Q0748+6105 | 3718.48 | 4239.84 | 4319.47 | 4404.59 | 4547.94 | 4653.01 | 4872.52 | 5390.25 | ||||||
| Q0752+3429 | 3791.02 | 3871.45 | 4073.31 | 4166.24 | 4364.53 | 4835.17 | 5806.45 | |||||||
| Q0800+3031 | 3553.25 | 3676.34 | 3746.62 | 3946.64 | 4231.40 | 4686.19 | 4946.86 | 5036.85 | 5781.41 | |||||
| Q0836+7104 | 3571.99 | 3865.05 | 4154.83 | 4453.38 | 4927.89 | |||||||||
| Q0854+3324 | 4055.97 | 4136.37 | 4218.57 | 4361.06 | 4459.36 | 4672.29 | 5174.13 | 5477.93 | 5558.73 | |||||
| Q0907+3811 | 3837.07 | 4215.64 | 4417.31 | 4892.09 | ||||||||||
| Q0936+3653 | 3670.74 | 3946.93 | 4229.70 | 4680.11 | 5620.24 | 5768.60 | ||||||||
| Q0937–1818 | 4091.86 | 4172.38 | 4488.98 | 4707.92 | 5211.50 | |||||||||
| Q1023+3009 | 3584.52 | 3739.53 | 4058.52 | 4123.40 | 4202.68 | 4348.69 | 4661.56 | 5150.80 | ||||||
| Q1103+6416 | 3422.10 | 3895.55 | 4195.05 | 4291.91 | 4462.29 | 4936.25 | ||||||||
| Q1116+2106 | 4207.48 | 4823.21 | 5349.04 | |||||||||||
| Q1122–1648 | 3619.81 | 3827.42 | 3999.26 | 4129.90 | 4212.21 | 4754.99 | 5259.91 | |||||||
| Q1130+3135 | 3876.87 | 4009.12 | 4089.53 | 4307.60 | 4615.85 | 5107.89 | 5406.98 | |||||||
| Q1147+6556 | 3908.56 | 4976.16 | ||||||||||||
| Q1222+2251 | 3278.00 | 3703.63 | 3773.37 | 3988.37AAThe O I–Si II blend in this line is dominated by the Si II 1309 transition | 4072.34 | 4270.70 | 4717.24 | 5665.21 | 5815.42 | |||||
| Q1224–0812 | 3842.52 | 4853.82 | ||||||||||||
| Q1224+2905 | 3958.05 | 4550.13 | 5029.28 | |||||||||||
| Q1225+3145 | 3868.93 | 4918.67 | ||||||||||||
| Q1231+2924 | 3665.14 | 3806.59 | 3938.70 | 4024.38 | 4220.80 | 4668.24 | 5752.26 | |||||||
| Q1247+3145 | 3269.99 | 3423.82 | 3695.20 | 3769.19 | 3837.80 | 3972.72 | 4058.11 | 4251.21 | 4708.09 | 5058.89 | 5657.24 | 5807.34 | ||
| Q1251+2636 | 3407.63 | 3685.96 | 3960.87 | 4240.61 | 4689.39 | 4966.96 | 5649.70 | 5807.29 | ||||||
| Q1307+4617 | 3352.25 | 3515.25 | 3804.88 | 3851.99 | 4089.20 | 4192.29 | 4369.52 | 4834.06 | ||||||
| Q1312+7837 | 3245.92 | 3372.81 | 3648.05 | 3719.52 | 3796.36 | 3916.10 | 4200.26 | 4651.81 | 4920.32 | 5583.90 | 5734.26 | |||
| Q1326+3923 | 3551.49 | 3712.89 | 4033.84 | 4112.78 | 4642.02 | 5128.33 | ||||||||
| Q1329+4117 | 3562.93 | 3633.73 | 3828.06 | 3911.57 | 4102.21 | 4543.41 | 4810.14 | 4875.95 | 5601.05 | |||||
| Q1331+1704 | 3745.32 | 3810.23 | 3891.61 | 4036.10AAThe O I–Si II blend in this line is dominated by the Si II 1309 transition | 4767.11 | |||||||||
| Q1416+0906 | 3378.23 | 3657.23 | 3721.61 | 3798.49 | 4208.03 | 4657.94 | 5739.54 | |||||||
| Q1418+2254 | 3396.61 | 3870.70 | 4158.90 | 4252.89 | 4455.25 | 4927.64 | 5297.17 | |||||||
| Q1422+4224 | 3904.79 | 4491.29 | 4970.92 | |||||||||||
| Q1425–1338 | 3672.73 | 3735.46 | 4221.27 | 4665.66 | 5751.41 | |||||||||
| Q1435+6349 | 3257.09 | 3439.33 | 3598.14 | 3722.15 | 3995.12 | 4285.63 | 4746.52 | 5847.43 | ||||||
| Q1517+2356 | 3527.90 | 3593.26 | 3791.43 | 4058.99 | 4492.05 | 5533.73 | ||||||||
| Q1542+3104 | 3851.17 | 3996.24 | 4585.67 | 5072.14 | ||||||||||
| Q1542+5408BBBAL QSO | 3601.08 | 4093.20 | 4400.36 | 4707.39 | ||||||||||
| Q1559+0853 | 3974.32 | 4052.14 | 4267.77 | 4572.26 | 5054.89 | |||||||||
| Q1611+4719 | 4122.07 | 4406.98 | 4693.79 | 5189.04 | ||||||||||
| Q1618+5303 | 3569.20 | 3760.92 | 4072.03 | 4374.11 | 4686.69 | 5182.64 | 5579.00 | |||||||
| Q1626+6433 | 3531.17 | 3715.87 | 4022.81 | 4091.56 | 4176.64 | 4324.98AAThe O I–Si II blend in this line is dominated by the Si II 1309 transition | 4419.10 | 4637.36 | 5123.94 | |||||
| Q1632+3209 | 3578.04 | 4067.78 | 4149.19 | 4370.22 | 4678.08 | 5173.28 | ||||||||
| Q1649+4007 | 3919.90 | 4057.01 | 4136.65 | 4357.44 | 4676.83 | 5171.99 | 5470.39 | 5553.93 | ||||||
| Q1703+5350 | 4093.11 | 4173.13 | 4250.98 | 4395.64 | 4502.46 | 4716.50 | 5214.11 | 5512.69 | 5604.67 | |||||
| Q1705+7101 | 3659.56 | 3730.10 | 4211.27 | 4661.54 | 5745.21 | |||||||||
| Q1716+4519 | 3488.73 | 3778.86 | 4066.54AAThe O I–Si II blend in this line is dominated by the Si II 1309 transition | 4150.57 | 4348.35 | 4791.79 | ||||||||
| Q1720+2501 | 3478.00 | 3951.56 | 4025.86 | 4543.90 | 5033.93 | 5332.45 | ||||||||
| Q1754+3818 | 3547.88 | 3834.49 | 4116.77 | 4210.43 | 4412.27 | 4884.23 | ||||||||
| Q1833+5813 | 3251.34 | 3684.65 | 3965.69 | 4232.23 | 4681.22 | 5771.15 | ||||||||
| Q1834+6117 | 3521.56 | 3672.31 | 3850.92 | 3981.05 | 4060.70 | 4136.95 | 4273.09 | 4563.05 | 5075.61 | 5373.39 | ||||
| Q1848+6705 | 3390.94 | 3555.86 | 3682.76 | 3746.20 | 3947.47 | 4036.26 | 4228.47 | 4678.83 | 5779.84 | |||||
| Q2044–1650 | 3295.56 | 3572.47 | 3644.85 | 4109.97 | 4552.26 | 4820.87 | 5607.79 | |||||||
| Q2103+1843 | 3898.96 | 3978.71 | 4187.53 | 4281.44 | 4488.13 | 4970.02 | 5259.21 | 5338.05 | ||||||
| Q2134+0028 | 3574.56 | 3843.43 | 3921.12 | 4114.54 | 4548.77 | 4821.31 | 5610.11 | |||||||
| Q2134+1531 | 3525.60 | 3681.23 | 3807.99 | 3882.19 | 3954.58 | 4090.31 | 4180.85 | 4383.55 | 4854.16 | 5137.08 | 5217.82 | |||
| Q2135+1326 | 3525.60 | 3705.06 | 4007.78 | 4073.03 | 4160.02 | 4308.69 | 4408.41 | 4607.32 | 5092.70 | |||||
| Q2140+2403 | 4132.89 | 4426.43 | 4893.11 | |||||||||||
| Q2147–0825 | 3796.25 | 4079.66 | 4366.70 | 4836.31 | ||||||||||
| Q2150+0522 | 3621.48 | 3694.10 | 4169.89 | 4628.60 | 4887.75 | 5539.35 | 5674.18 | |||||||
| Q2157-0036 | 3601.79 | 3670.88 | 3866.89 | 4144.75 | 4586.64 | 4929.17 | 5505.82 | 5654.17 | ||||||
| Q2241–2418 | 3322.16 | 3597.83 | 3666.74 | 3866.26 | 4143.69 | 4583.13 | 4926.35 | 5647.36 | ||||||
| Q2245+2531 | 3547.02 | 3837.61 | 3912.05 | 4892.12 | 5175.12 | 5250.30 | ||||||||
| Q2310+0018BBBAL QSO | 3301.11 | 3745.31 | 3812.39 | 3892.14 | 4026.28 | 4319.99 | 4769.51 | 5052.07 | 5728.50 | |||||
| Q2310+3831 | 3412.83 | 3568.49 | 3861.60 | 3935.84 | 4151.16AAThe O I–Si II blend in this line is dominated by the Si II 1309 transition | 4449.94 | 4923.74 | 5286.97 | 5728.51 | |||||
| Q2320+0755 | 3309.54 | 3753.69 | 3824.23 | 4035.43 | 4322.25 | 4776.34 | 5057.92 | |||||||
| Q2329–0204 | 3406.31 | 3520.29 | 3589.02 | 3780.76 | 4052.15 | 4482.69 | 4742.46 | 4812.01 | 5523.808 | |||||
| Q2332+2917 | 3267.11 | 3732.02 | 4017.15 | 4294.97 | 4739.35 | 5841.71 |
| Name | ||||
|---|---|---|---|---|
| (1950) | (1071Å) | (1123Å) | (1176Å) | |
| Q0001–2340 | 2.2587 | 1085.84 | ||
| Q0014–0420 | 1.9996 | |||
| Q0049+0124 | 2.2957 | |||
| Q0109+0213 | 2.3460 | 1061.94 | 1116.46 | |
| Q0150–2015 | 2.1414 | 1117.74 | ||
| Q0153+7428 | 2.3383 | |||
| Q0218+3707 | 2.4136 | 1068.50 | ||
| Q0226–0350 | 2.0649 | 1126.89 | ||
| Q0248+3402 | 2.2227 | 1062.93 | 1120.97 | |
| Q0348+0610 | 1.9809 | |||
| Q0421+0157 | 2.0480 | |||
| Q0424–1309 | 2.1623 | |||
| Q0450–1310 | 2.2493 | 1068.88 | ||
| Q0726+2531 | 2.2981 | 1176.64 | ||
| Q0743+6601 | 2.1954 | 1071.42 | 1120.70 | |
| Q0748+6105 | 2.4836 | 1067.41 | ||
| Q0752+3429 | 2.1200 | |||
| Q0800+3031 | 2.0233 | 1175.30 | ||
| Q0836+7104 | 2.1805 | 1123.08 | ||
| Q0854+3324 | 2.3388 | |||
| Q0907+3811 | 2.1567 | |||
| Q0936+3653 | 2.0211 | |||
| Q0937–1818 | 2.3789 | |||
| Q1023+3009 | 2.3292 | 1076.69 | 1123.25 | |
| Q1103+6416 | 2.2009 | 1069.09 | ||
| Q1116+2106 | 2.4528 | |||
| Q1122–1648 | 2.3963 | 1065.80 | 1126.93 | 1177.52 |
| Q1130+3135 | 2.2975 | 1175.71 | ||
| Q1147+6556 | 2.2134 | |||
| Q1222+2251 | 2.0476 | 1075.59 | ||
| Q1224–0812 | 2.1467 | |||
| Q1224+2905 | 2.2506 | |||
| Q1225+3145 | 2.1785 | |||
| Q1231+2924 | 2.0143 | |||
| Q1247+3145 | 2.0399 | 1075.70 | 1126.31 | |
| Q1251+2636 | 2.0327 | 1123.65 | ||
| Q1307+4617 | 2.1154 | 1076.04 | 1128.36 | |
| Q1312+7837 | 2.0015 | 1081.44 | 1123.71 | |
| Q1326+3923 | 2.3151 | 1071.30 | 1119.98 | |
| Q1329+4117 | 1.9314 | |||
| Q1331+1704 | 2.0804 | |||
| Q1416+0906 | 2.0060 | 1123.84 | ||
| Q1418+2254 | 2.1834 | 1066.99 | ||
| Q1422+4224 | 2.2095 | |||
| Q1425–1338 | 2.0146 | |||
| Q1435+6349 | 2.0617 | 1063.82 | 1123.34 | 1175.21 |
| Q1517+2356 | 1.9000 | |||
| Q1542+3104 | 2.2788 | 1174.58 | ||
| Q1542+5408AABAL QSO | 2.3660 | 1069.85 | ||
| Q1559+0853 | 2.2667 | |||
| Q1611+4719 | 2.3667 | |||
| Q1618+5303 | 2.3488 | 1065.81 | 1123.05 | |
| Q1626+6433 | 2.3081 | 1067.42 | 1123.25 | |
| Q1632+3209 | 2.3438 | 1070.06 | ||
| Q1649+4007 | 2.3374 | 1174.54 | ||
| Q1703+5350 | 2.3667 | |||
| Q1705+7101 | 2.0089 | |||
| Q1716+4519 | 2.1060 | 1123.24 | ||
| Q1720+2501 | 2.2486 | 1070.60 | ||
| Q1754+3818 | 2.1528 | 1125.30 | ||
| Q1833+5813 | 2.0270 | 1074.12 | ||
| Q1834+6117 | 2.2726 | 1076.06 | 1122.12 | 1176.70 |
| Q1848+6705 | 2.0235 | 1121.54 | 1176.09 | |
| Q2044–1650 | 1.9382 | 1121.64 | ||
| Q2103+1843 | 2.2072 | |||
| Q2134+0028 | 1.9391 | |||
| Q2134+1531 | 2.1322 | 1125.59 | 1175.28 | |
| Q2135+1326 | 2.2935 | 1070.48 | 1124.97 | |
| Q2140+2403 | 2.1617 | |||
| Q2147–0825 | 2.1217 | |||
| Q2150+0522 | 1.9792 | |||
| Q2157–0036 | 1.9611 | |||
| Q2241–2418 | 1.9591 | 1122.70 | ||
| Q2245+2531 | 2.1560 | 1123.91 | ||
| Q2310+0018AABAL QSO | 2.0805 | 1071.60 | ||
| Q2310+3831 | 2.1771 | 1074.19 | 1123.18 | |
| Q2320+0755 | 2.0860 | 1072.45 | ||
| Q2329–0204 | 1.8937 | 1177.14 | ||
| Q2332+2917 | 2.0665 | 1065.42 | ||
| 79 | 29 | 27 | 11 | |
| Mean | 2.1661 | 1070.95 | 1123.17 | 1175.88 |
| 5.41 | 2.65 | 1.01 | ||
| 1.00 | 0.51 | 0.30 |
| Name | AAObtained using from Table 6 | Transition | |
|---|---|---|---|
| (1950) | (Å) | (Å) | |
| Q1023+3009 | 3978 | 1195 | Si II |
| Q1222+2251 | 4478 | 1469 | |
| Q1225+3145 | 4196 | 1320 | |
| Q1307+4617 | 4593 | 1474 | |
| Q1312+7837 | 5253 | 1750 | N III |
| Q1425–1338 | 3431 | 1138 | |
| Q1517+2556 | 4663 | 1608 | Fe II |
| Q1559+0853 | 3691 | 1130 | |
| Q1611+4719 | 4407 | 1309 | Si II |
| Q1705+7101 | 3364 | 1118 | |
| Q1716+4519 | 5361 | 1726 | |
| Q2044–1650 | 3367 | 1146 | |
| Q2134+0028 | 3480 | 1184 | |
| Q2134+1531 | 5607 | 1790 | |
| Q2140+2403 | 3570 | 1129 | |
| Q2245+2531 | 3667 | 1162 | |
| Q2310+0018BBBAL QSO | 5514 | 1790 |