eurm10 \checkfontmsam10 \pagerange1–8
The mass estimate in narrow-line Seyfert 1 galaxies
Abstract
It is possible that narrow-line Seyfert 1 galaxies (NLS1s) are in the early stage of active galactic nuclei (AGNs) evolution. It is important to estimate the mass of supermassive black hole (SBH) in NLS1s. Here we considered the different kinds of methods to estimate the SBH masses in NLS1s. The virial mass from the H linewidth assuming random orbits of broad line regions (BLRs) is consistent with that from the statured soft X-ray luminosity, which showed that most of NLS1s are in the super-Eddington accretion state. The mass from the [O III] linewidth is systematically larger than that from above two methods. It is necessary to measure he bulge stellar dispersion and/or bulge luminosity in NLS1s.
in Galactic Nuclei††editors: Th. Storchi Bergmann, L.C. Ho & H.R. Schmitt, eds.
1 Black Hole Mass Estimate
There appears a rapid progress on the mass estimate of the supermassive black hole (SBH) in active galactic nuclei (AGNs), which boosts our understanding of their central structure and their evolution (Bian 2004). There is a subclass of AGNs called narrow-line Seyfert 1 galaxies (NLS1s) (Boller et al. 1996), which is proposed to be in the early stage of AGNs evolution (Mathure 2000). A popular model of NLS1 is that they contain less massive black holes with super-Eddington accretion, which leads to the steep X-ray slope founded in NLS1s (Bian & Zhao 2004a). To test this hypothesis we need to estimate the black hole mass of NLS1s.
There are many methods to calculate the black hole masses in AGNs (Bian & Zhao 2004b and reference therein): (1)Virial mass derived from the FWHM(H) (or other broad line) and the sizes of broad line regions (BLRs) from the reverberation mapping technique or the empirical size-luminosity formula. (2)The relation between the mass and the bulge stellar velocity dispersion (or [O III] linewidth) (M- relation) or the bulge luminosity (M- relation). (3)Soft X-ray variability. (4)The mass from spectral energy distribution (SED) fit from the accretion disk model, such as the method using the soft X-ray hump luminosity for AGNs with super-Eddington accretion rate. (Wang & Netzer 2003).
2 Data and Results
Up to now, there are many NLS1s samples (Bian & Zhao 2004c). We
used the sample of Grupe et al. (2004) for its completeness. We
calculated the masses in AGNs using three different methods:
virial mass from H line (), the mass from
[O III] line (), and the mass from the soft X-ray hump
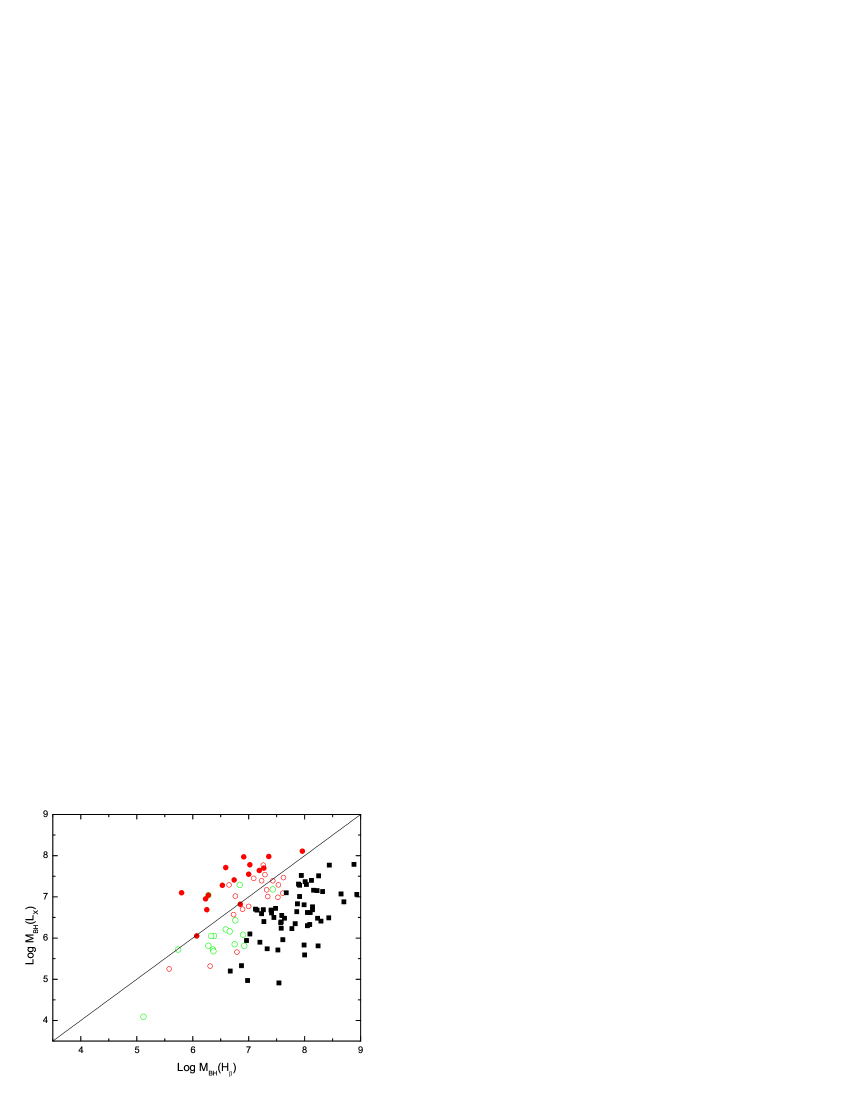
luminosity (). In Fig. 1 we plotted the mass from
the X-ray luminosity versus from H line for the sample of
Grupe et al. (2004). From Fig. 1, we found that SBH masses in
NLS1s can be reliably derived from soft X-ray luminosity for their
super-Eddington accretion. The consistency of and
showed that these two methods are available to
estimate the mass in NLS1s, which is consistent that most of NLS1s
are in the super-Eddington accretion state. and
(from [O III] line) are not consistent in the sample
of Grupe et al. (2004) and the sample of NLS1s in SDSS (Bian &
Zhao 2004b). Therefore, compared with and , is not reliable in NLS1s, which is consistent
with the results that NLS1s deviated from M- relation
defined in non-active AGNs. For more detail, please read Bian &
Zhao (2004c).
This work has been supported by the NSFC (No. 10273007;
No. 10273011) and NSF from Jiangsu Provincial Education Department
(No. 03KJB160060).
References
- [] Bian W., Zhao Y., 2004a, MNRAS, 343, 164
- [] Bian W., Zhao Y., 2004b, MNRAS, 347, 607
- [] Bian W., Zhao Y., 2004c, MNRAS, accepted
- [] Bian W., 2004, Ph.D Thesis
- [] Boller T., Brandt W. N., Fink H. H., 1996, A&A, 305, 53
- [] Grupe D., et al., 2004, AJ, in press (astro-ph/0310027)
- [] Mathur S., 2000, MNRAS, 314, L17
- [] Wang J. M., Netzer H., 2003, A&A, 398, 927