SPI measurements of the diffuse Galactic hard X-ray continuum
Abstract
INTEGRAL Spectrometer SPI data from the first year of the Galactic Centre Deep Exposure has been analysed for the diffuse continuum from the Galactic ridge. A new catalogue of sources from the INTEGRAL Imager IBIS has been used to account for their contribution to the celestial signal. Apparently diffuse emission is detected at a level of the total source flux. A comparison of the spectrum of diffuse emission with that from an analysis of IBIS data alone shows that they are consistent. The question of the contribution of unresolved sources to this ridge emission is still open.
keywords:
gamma rays; X-rays; Galaxy; interstellar medium; cosmic rays; compact sources; INTEGRAL; SPI1 Introduction
The inner Galactic ridge is known to be an intense source of continuum hard X- and soft -ray emission. The hard X-ray emission was discovered in 1972 (Bleach et al., 1972) and has subsequently been observed from keV to MeV energies by ASCA, Ginga, RXTE, OSSE, COMPTEL and most recently by Chandra and XMM-Newton.
While the physical process ( annihilation) producing the positron line and positronium continuum is clear, for of the remaining continuum it is not, although nonthermal bremsstrahlung is most likely (Dogiel et al., 2002a); the implied photon luminosity in the continuum is a few 1038 erg s-1. Its origin in a point-source population seems unlikely at keV energies (Tanaka et al., 1999) since there are no known candidate objects with the required spatial and luminosity properties. In addition, high-resolution imaging in X-rays with Chandra (Ebisawa et al., 2001) shows a truly diffuse component. Recently Hands et al. (2004) have used the XMM-Newton Galactic Plane Survey to show that, in the 2–10 keV band, 80% of the ridge emission (l=19∘-22∘) is probably diffuse, and only 9% can be accounted for by Galactic sources (the rest being extragalactic sources).
Non-thermal -ray emission in the interstellar medium implies a very high luminosity in energetic particles (Dogiel et al., 2002a). Emission mechanisms have been discussed by Valinia et al. (2000a, b) and Tanaka (2002), and a solution to the problem of energetics has been suggested by Dogiel et al. (2002b) but the issue is quite open. Valinia et al. (2000b) propose a composite model with thermal and nonthermal components from electrons accelerated in supernovae or ambient interstellar turbulence. At MeV energies the origin of the emission is also uncertain (Strong et al., 2000). The study of this emission is a key goal of the INTEGRAL mission. The high spectral resolution combined with its imaging capabilities lead to high expectations for investigating the nature of this enigmatic emission.
Apart from its intrinsic interest, reliable modelling of the diffuse emission will be essential for the study of point sources in the inner Galaxy, since it contributes a large anisotropic background against which they must be observed.
The most directly comparable results to ours (with respect to energy range) are from OSSE on the COMPTON Gamma Ray Observatory. Purcell et al. (1996) used coordinated observations of sources in the Galactic centre region from the SIGMA satellite to evaluate the source contribution. They concluded that after correction for these sources, the OSSE flux was consistent with that measured by OSSE at l=25∘ and 339∘. Kinzer et al. (1999, 2001) give an OSSE spectrum for , but without independent imaging observations, so that the point-source contribution remains uncertain.
A preliminary analysis of diffuse continuum emission using SPI data has been given in Strong et al. (2003), using the first cycle of INTEGRAL GCDE observations. It was concluded that the diffuse emission was detected at a level consistent with previous experiments, but the systematic errors were large, due in part to the uncertainty in the point-source contribution. Only four of the strongest point sources were included in that analysis, since at least at higher energies (100 keV) the source contribution is not thought to be critical. At lower energies an adequate -ray source catalogue (e.g. from INTEGRAL) was not yet available, and it was stated in Strong et al. (2003) that point-source contamination was likely. Note that the adopted method of analysis has the property that sources which are unaccounted for are mainly ‘absorbed’ into the fitted instrumental background rather than affecting the diffuse signal.
Meanwhile, a new analysis of IBIS data (Lebrun et al., 2004; Terrier et al., 2004) has shown that indeed a large fraction of the total -ray emission from the inner Galaxy is due to sources, at least up to 100 keV. This work has produced a source catalogue containing 91 sources, which can now be used as input to the SPI model fitting, giving a much more solid basis for the analysis. This exploits the complementarity of the instruments on INTEGRAL for the first time in the context of diffuse emission.
2 Data
The INTEGRAL Core Program (Winkler et al., 2003) includes the Galactic Centre Deep Exposure (GCDE) which maps the inner Galaxy () with a viewing time of about 4Ms per year. The full region is covered in one GCDE cycle, and there are two cycles per year. Data from the first two cycles are used for the study reported here.
We use data from the SPI (INTEGRAL Spectrometer) instrument; descriptions of the instrument and performance are given in Vedrenne et al. (2003); Attié et al. (2003). The energy range covered by SPI is 20 keV – 8 MeV, but here we restrict the analysis to energies up to 1 MeV; above these energies the statistics are small and the analysis is more difficult, so is reserved for future work. The data were pre-processed using the INTEGRAL Science Data Centre (ISDC) Standard Analysis software (OSA) up to the level containing binned events, pointing and livetime information. GCDE data from 33 orbital revolutions from 47 – 123 were used. 2348 pointings were used, as shown in Fig 1; the total exposure livetime is s. The exposure per pointing is typically 1800s, but can be as low as 300s in cases of high telemetry losses in the early part of the GCDE. The energy calibration is performed using instrumental background lines with known energies; while this is a critical operation for line studies (where sub-keV accuracy is required), for continuum studies a standard calibration (1 keV accuracy) is quite adequate. Various energy binnings were used, depending on the available statistics as a function of energy. Only single-detector events are used here.
The instrumental response is based on extensive Monte Carlo simulations and parameterization (Sturner et al., 2003); this has been tested on the Crab in-flight calibration observations and shown to be reliable to better than 20% in absolute flux at the current state of the analysis.
Since INTEGRAL data are dominated by instrumental background, the analysis needs to have good background treatment methods. In the present work the background ratios between detectors are obtained by averaging the entire dataset over time; this has been found to give results which hardly differ from taking ‘OFF’ observations, and has the advantage of much higher statistics (few OFF data are available at present). A check on the systematics in this background approach was given in Strong et al. (2003).
3 Method
We use the program spidiffit which fits the data to a linear combination of input astronomical skymaps (e.g. HI and CO surveys, emission models) and point sources, together with background components. The fit is performed by maximum-likelihood with one parameter per component and energy range. The background is fitted per pointing using a template for the ratios between detectors from the average over all observations. Hence the time-dependence of the background is explicitly determined from the data themselves on the assumption of constant detector ratios.
Since the distribution of the emission is unknown but certainly correlated with tracers of large-scale Galactic structure and the diffuse interstellar medium, we include line-of-sight integrated HI and CO surveys (which trace the atomic and molecular gas) as basis models. In addition, since the positronium emission is an important source of continuum below 511 keV and is believed to include in addition a component more concentrated towards the Galactic centre than the gas tracers (Kinzer et al., 2001; Milne et al., 2002; Jean et al., 2003; Knödlseder et al., 2003), and noting that Kinzer et al. (2001) and Milne et al. (2002) found no significant difference between the line and continuum annihiliation angular distributions, we include also a Gaussian with FWHM 10∘ centred on . Note that each fitted component has an independent spectrum so that it can be separated in the fitting; the sum of the diffuse components then gives the total diffuse emission spectrum of the inner Galaxy. Additionally we remark that a coded-mask telescope is only sensitive to flux contrasts, so isotropic emission is suppressed.
4 Results
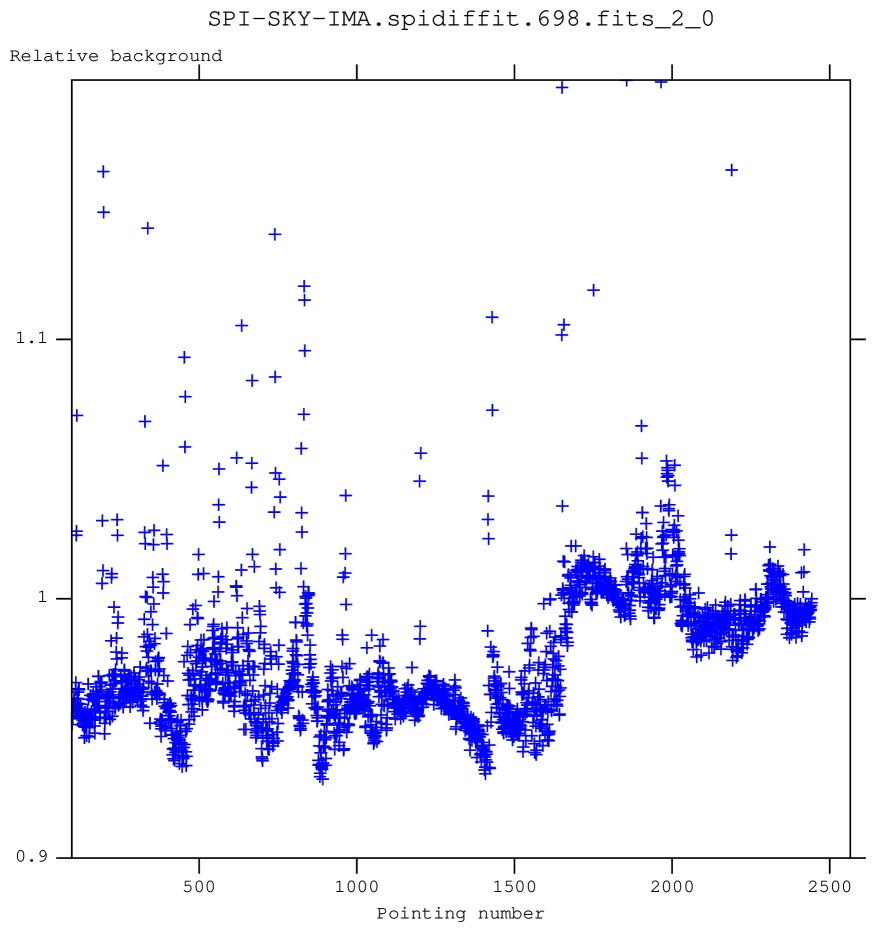
Fig 2 illustrates the temporal variation of the background scaling factor as determined in the fitting, for the energy range 18-178 keV. Other energy ranges appear very similar. The increase between the 1st and 2nd GCDEs is clearly visible around pointing sequence 1600. High points represent increases due to end-of-orbit passes or other physical effects. Generally the fluctuations are at the few percent level and show that the technique effectively determines the time-dependence of the background. Alternative background treatments using predictions based on activation tracers (Jean et al., 2003) provide consistent background histories.
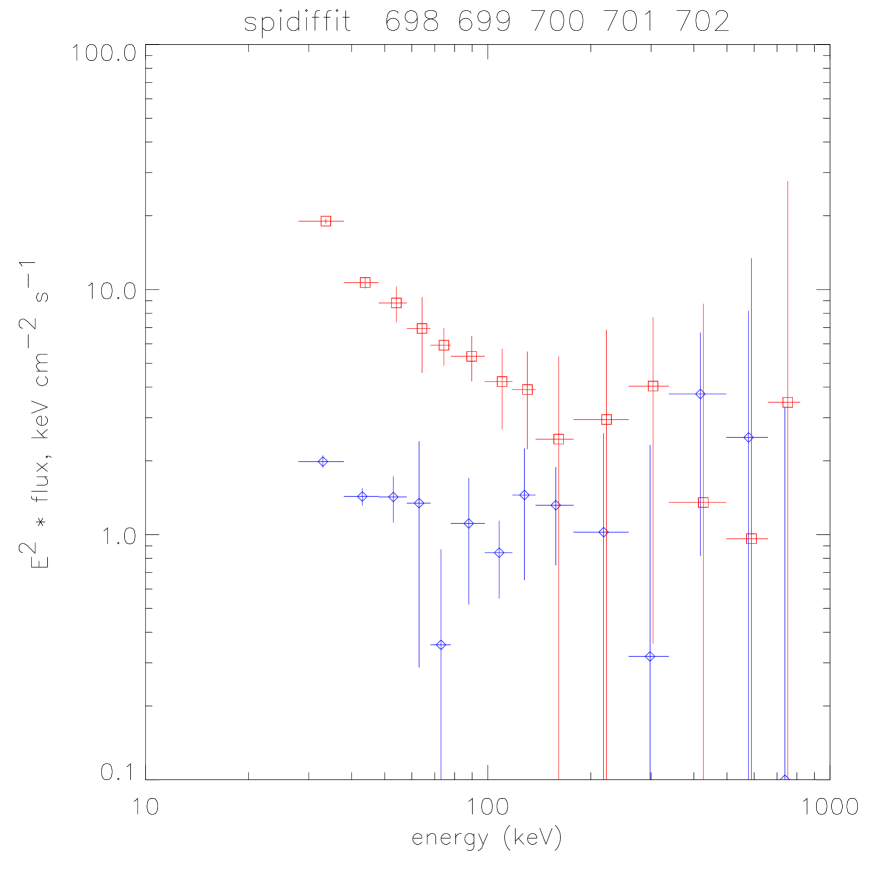
Fig 3 shows the spectrum of total emission from the 3 diffuse components, and the total from the sources included in the fitting. The diffuse emission is approximately 10% of the summed sources, consistent with Lebrun et al. (2004); Terrier et al. (2004). It is slightly lower than given in Strong et al. (2003) due to the additional sources included, but still within the error bars quoted in that paper. The positronium edge is detected, at low significance. (Note that the broad bins used here to study the continuum suppress the 511 keV line). No diffuse emission is detected above 500 keV, but this is still consistent within the error bars with the COMPTEL fluxes.
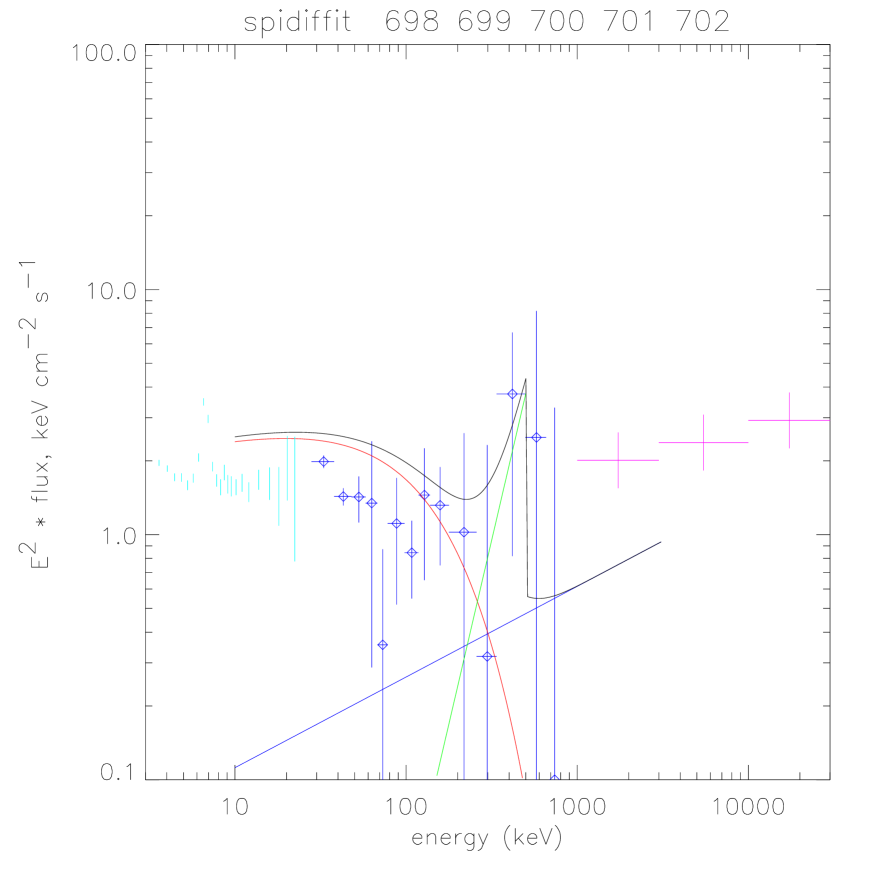
For comparison we show in Fig 4 the scaled (l=b=0) OSSE spectrum and results from RXTE (Revnivtsev, 2003) and COMPTEL (Strong et al., 1999). The OSSE fluxes are scaled as described in Strong et al. (2003) (continuum scaled by 0.5, positronium scaled by 0.3), since a precise comparison is difficult because of the different instrument responses. A scaling factor less than unity is expected between the l=b=0 OSSE flux per radian and the full inner radian flux measured by SPI because of the concentration of the emission towards the Galactic centre. The RXTE results for are scaled to the SPI region using information provided by M. Revnivtsev (private communication).
5 Discussion
Detailed quantitative comparison with previous measurement of the diffuse continuum emission (from OSSE, RXTE, COMPTEL) is not possible because of the different sky areas and energy ranges covered, and the very different instrumental characteristics. Hence the comparison shown in Fig 4 is illustrative only, but shows that the INTEGRAL results are compatible with or somewhat lower than found in previous work. The fact that we can now explicitly include a large number of sources in the analysis makes it more robust.
The question remains as to whether the apparently diffuse emission is really interstellar or is the superposition of sources below the present detection threshold. This issue can only be answered in the future with population synthesis models and studying the logN-logS of the detected sources. We note however that at energies just below those visible to INTEGRAL, similar issues are now being addressed by Chandra and XMM-Newton (see Introduction). The finding of Hands et al. (2004) with XMM that 80% of the Galactic 2–10 keV emission is diffuse supports the RXTE analysis of Revnivtsev (2003). Hence we do expect diffuse emission at some level in the INTEGRAL range unless a dramatic cutoff occurs over a factor of a few in energy.
The apparent difference in the diffuse-to-source ratio between X-ray and gamma-ray energies can probably be understood as a sampling effect: while the present gamma-ray ratio includes all the bright inner Galaxy sources, the XMM ratio mentioned above is for a small region which does not sample the brightest sources. Using RXTE scan observations, the result of Ebisawa et al. (1999) shows that for a wide latitude region the X-ray keV diffuse-to-source ratio is comparable with what we find for the inner Galaxy.
Evaluation of the combined results from X-ray and gamma-ray instruments will be essential and will indeed be possible in the near future.
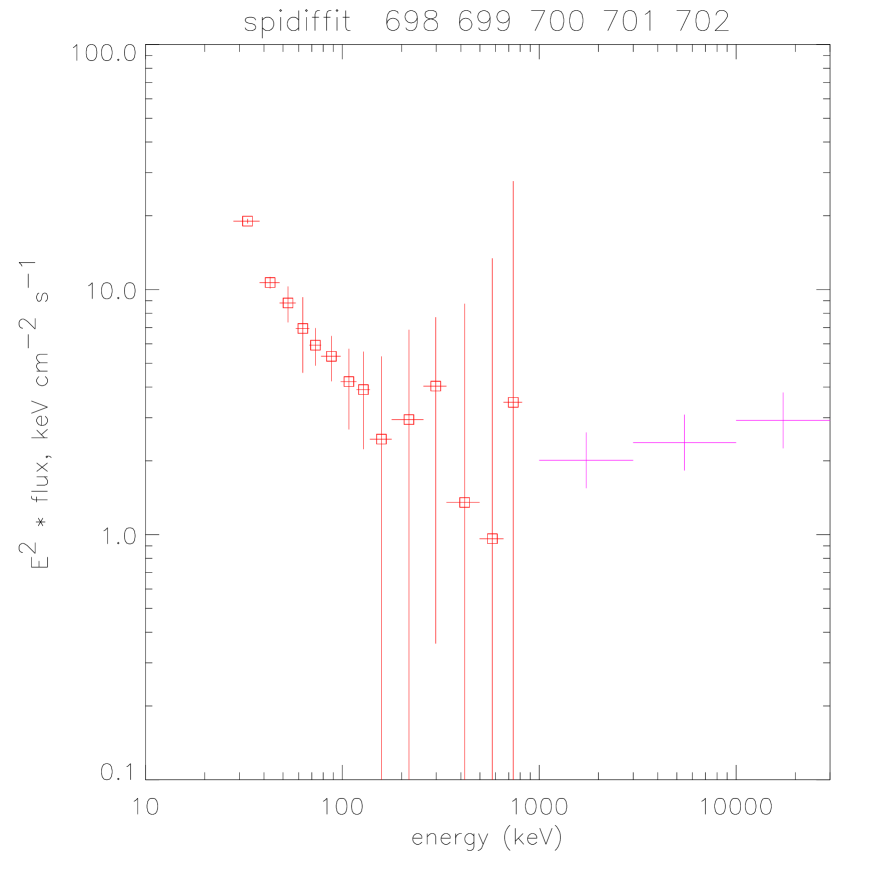
In Fig 5 we compare the summed source spectra with the MeV ridge emission measured by COMPTEL (Strong et al., 1999). This shows that a significant contribution to the 1 - 30 MeV emission could be due to the extension of the source spectra into this range, consistent with the requirement for an unresolved source component suggested by Strong et al. (2000).
6 Comparison with IBIS results
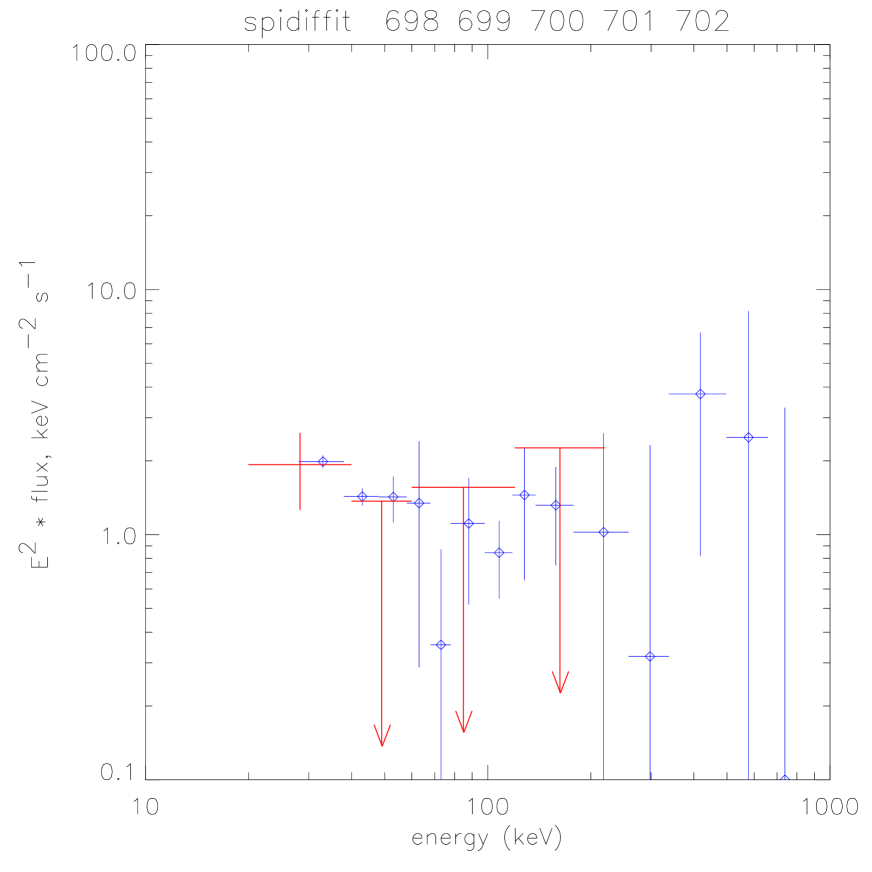
Fig 6 compares the diffuse spectrum from this work with that derived using INTEGRAL/IBIS ISGRI data by Terrier et al. (2004) (see Introduction). The results are consistent, both in the low-energy range (20 – 40 keV) , where the IBIS analysis gives an excess not accounted for by detected sources, and at higher energies (40 – 220 keV) where IBIS was only able to derive upper limits.
7 Conclusions
We have exploited the complementarity of the instruments on INTEGRAL to improve the SPI analysis of diffuse Galactic -ray emission from 20 -1000 keV. Inclusion of the sources found by IBIS improves the sensitivity and reliability of the analysis. Diffuse emission is detected at a level rather lower than previously when the IBIS sources are accounted for. However this marks only the beginning of what will be possible by jointly analysing the data from both INTEGRAL instruments with their unique combination of characteristics.

Acknowledgments
We thank Mikhail Revnivtsev and Ken Ebisawa for useful discussions.
References
- Attié et al. (2003) Attié, D., Cordier, B., Gros, M., et al. 2003, A&A, 411, L71
- Bleach et al. (1972) Bleach, R.D., Boldt, E.A., Holt, S.S., Schwartz, D.A. & Serlemitsos, P.J. 1972, ApJL, 174, L101
- Dogiel et al. (2002a) Dogiel, V.A., Schönfelder, V., & Strong, A.W. 2002a, A&A, 382, 730
- Dogiel et al. (2002b) Dogiel, V.A., Inoue, H., Masai, K., Schönfelder, V., & Strong, A.W. 2002b, ApJ, 581, 1061
- Ebisawa et al. (1999) Ebisawa, K., Maeda, Y., F. E., & Valinia, A. 1999, Astr. Nachr. 320, 321
- Ebisawa et al. (2001) Ebisawa, K., Maeda, Y., Kaneda, H., & Yamauchi, S. 2001, Science, 293, 1633
- Hands et al. (2004) Hands, A. D. P., Warwick, R. S., Watson, M. G., & Helfand, D. J., 2004, MNRAS, in press, astro-ph/0403304
- Jean et al. (2003) Jean, P., Knödlseder, J., Lonjou, V., et al. 2003, A&A, 407, L55
- Kinzer et al. (1999) Kinzer R. L., Purcell, W. R., & Kurfess, J.D. 1999, ApJ, 515, 215
- Kinzer et al. (2001) Kinzer R. L., Milne, P. A., Kurfess, J. D., Strickmann, M. S., Johnson, W. N., & Purcell, W. R. 2001, ApJ, 559, 282
- Knödlseder et al. (2003) Knödlseder, J., Lonjou, V., Jean, P., et al. 2003, A&A, 411, L457
- Lebrun et al. (2004) Lebrun, F., et al., 2004, Nature, 428 ,293
- Milne et al. (2002) Milne, P. A., Kurfess, J. D., Kinzer, R. L., & Leising, M. D. 2002, New Astronomy Reviews, 46, 553
- Revnivtsev (2003) Revnivtsev, M., 2003, A&A, 410, 865
- Purcell et al. (1996) Purcell, W. R., et al. 1996, A&AS, 120, 389
- Strong et al. (1999) Strong, A. W., et al., Astrophys. Lett. Comm., 39, 677 (astro-ph/9811211)
- Strong et al. (2000) Strong, A. W., Moskalenko, I. V., & Reimer, O. 2000, ApJ, 537, 763
- Strong et al. (2003) Strong, A. W., et al. 2003, A&A, 411, L447
- Sturner et al. (2003) Sturner, S. J., Shrader, C.R., Weidenspointner, G., et al. 2003, A&A, 411, L81
- Tanaka et al. (1999) Tanaka, Y., Miyaji, T., & Hasinger, G. 1999, Astron. Nachr., 320, 181
- Tanaka (2002) Tanaka, Y., 2002, A&A, 382, 1052
- Terrier et al. (2004) Terrier, R., et al., 2004, these proceedings, astro-ph/0405207
- Valinia et al. (2000a) Valinia, A., Kinzer, R.L., & Marshall, F.E. 2000a, ApJ, 534, 277
- Valinia et al. (2000b) Valinia, A., Tatischeff, V., Arnaud, K., Ebisawa, K., & Ramaty, R. 2000b, ApJ, 543, 733
- Vedrenne et al. (2003) Vedrenne, G., Roques, J.-P., Schönfelder, V., et al. 2003, A&A, 411, L63
- Winkler et al. (2003) Winkler, C., T. J.-L. Courvoisier, DiCocco, G., et al. 2003, A&A, 411, L1