X-ray nondetection of the Ly Emitters at 4.5
Abstract
The Ly emitters found at by the Large Area Lyman Alpha (LALA) survey have high equivalent widths in the Ly line, which can be produced by either narrow-lined active galactic nuclei (AGNs) or by stellar populations with a very high proportion of young, massive stars. To investigate the AGN scenario, we obtained two deep exposures to study the X-ray nature of the Ly emitters. The 172 ks deep image on the LALA Boötes field was presented in a previous paper (Malhotra et al. 2003), and in this paper we present a new deep exposure (174 ks) on the LALA Cetus field, which doubled our sample of X-ray imaged Ly sources, and imaged the brightest source among our Ly emitters. None of the 101 Ly sources covered by two exposures was detected individually in X-ray, with a limiting X-ray flux of for on-axis targets. The sources remain undetectable in the stacked image, implying a 3 limit to the average luminosity of ergs s-1. The resulting X-ray to Ly ratio is 21 times lower than the ratios for known high redshift type-II quasars. Together with optical spectra obtained at Keck, we conclude that no evidence of AGN activity was found among our Ly emitters at .
1 Introduction
More than three decades ago Partridge & Peebles (1967) predicted that galaxies undergoing their first throes of star formation should be strong emitters in the Ly line. Recently, narrow-band surveys have been successful in finding Ly emitters at ever increasingly high redshifts. These include our Large Area Lyman Alpha (LALA) survey (e.g., Rhoads et al. 2000) and other recent searches over smaller volumes (Cowie & Hu 1998; Hu et al 1998, 2002, 2004; Kudritzki et al 2000; Fynbo, Moller, & Thomsen 2001; Pentericci et al. 2000; Stiavelli et al. 2001; Ouchi et al. 2003; Fujita et al. 2003, Shimasaku et al. 2003, Kodaira et al. 2003). The equivalent widths (EW) of Ly emitters selected using narrow-band surveys tend to be large (Malhotra & Rhoads 2002, hereafter MR02; Kudritzki et al. 2000). With the LALA survey we have found about 400 Ly candidates at , 101 of which are covered by our deep images (Malhotra et al. 2003, hereafter M03; and this letter). We have obtained optical spectra for a subset of the Ly candidates, resulting in 47 spectroscopical confirmations to date and a spectroscopical success rate of 72% (Dawson et al. 2004, in prep). The median equivalent width of the Ly line is greater than 240Å in the LALA sample (MR02), and comparable at z 5.7 (Rhoads & Malhotra 2001, Rhoads et al. 2003). Hu et al. (2004) have found a somewhat smaller fraction (25% with EW 240Å) at z 5.7 based on a sample that is spectroscopically confirmed but much smaller than the MR02 sample. Normal stellar populations can produce Ly emission with equivalent width 240Å or less (Charlot & Fall 1993), unless they have a top-heavy initial mass function (IMF), zero (or very low) metallicity, and/or extreme youth (age years). By comparison, stellar populations older than 107 years and with a Salpeter IMF = 2.35 can only produce Ly emission with equivalent width of Å (see Fig.2 of MR02). The high equivalent widths could also be explained if narrow-lined (type II) active galactic nuclei (AGNs) were present in our Ly emitter sample. The broad-lined (type I) AGNs are ruled out because we see no evidence of broad emission lines from either narrow-band imaging or spectroscopy.
A large population of high redshift Ly emitting AGNs would have interesting implications both for the pace of black hole formation and for cosmic background radiation from the gamma ray to the far infrared. Of particular interest is the possibility of a large population of type II quasars, i.e., high luminosity AGNs ( 1044 ergs s-1) whose broad line regions and soft X-rays are greatly attenuated by large column densities of gas and dust. Deep X-ray surveys have uncovered the first X-ray selected type II quasars (Norman et al 2002, Stern et al. 2002, Dawson et al. 2003, Della Ceca et al. 2003), and more candidates (i.e., Fiore et al. 2003, Crawford et al. 2000, Mainieri et al. 2002). Inspired by these examples, and the fact that the Ly line luminosities of the LALA z 4.5 candidates are comparable to these of the high redshift type II quasars, we set out to image the LALA survey fields with Advanced CCD Imaging Spectrometer (ACIS) to explore the possibility that some of the Ly emitters might be type II quasars.
Two deep ACIS images were obtained to check for the presence of type II quasars among our Ly emitters. The results of the 172 ks deep image on the LALA Boötes field was provided by M03. In this paper, we present a new 174 ks deep image on LALA Cetus field, which doubled our sample to 101 X-ray imaged Ly emitters. The new image was also designed to cover the “boomer” of our Ly emitters: LALA J020438.95-051116.2, which is the brightest confirmed Ly emitter selected by by the LALA survey, with line flux of and a rest frame equivalent width of Å.
2 Optical and imaging
The LALA survey comprises two primary fields, located in Boötes (J142557+3532) and in Cetus (J020520–0455). Each field is in size, corresponding to a single field of the 81928192 pixel Mosaic CCD cameras at the National Optical Astronomy Observatory’s 4 meter telescopes. For each field, 5 partially overlapping narrow band filters covering for Ly were utilized to obtain deep narrowband images. These filters have full width at half maximum (FWHM) Å and are spaced at Å intervals (central wavelengths , , , , and Å). For the Boötes field, 3 more narrowband images covering (Rhoads et al. 2003) and (Rhoads et al. 2004) are also available. Imaging data reduction followed the methods described in Rhoads et al (2000), and Ly candidates were selected using criteria described by Rhoads & Malhotra (2001). This resulted in a total of 400 good candidates at , which will be presented in a future paper (Rhoads et al. 2004, in preparation).
Two deep ACIS images were obtained for the LALA Boötes and Cetus fields. The observations were designed to maximize the number of large equivalent width sources within the ACIS-I field of view. The 172 ks (net exposure) exposure of the LALA Boötes field was taken in 2002, and details of the X-ray data analyses can be found in M03 and Wang et al. (2004). The new 174 ks (net exposure) ACIS exposure on the LALA Cetus field was obtained in very faint (VFAINT) mode on UT 2003 June 13-15. Data reduction was done with the package CIAO 2.2.1 (see http://asc.harvard.edu/ciao), following the procedures described in M03. The average offset between the X-ray and optical images was obtained by comparing X-ray source positions with optical counterparts (whenever found). The derived 0.3 offset has been applied for all subsequent analyses. No obvious rotation and plate-scale effects were discovered. We ran WAVDETECT (Freeman et al. 2002) on the soft (0.5 – 2.0 keV), hard (2.0 – 7.0 keV), and total band (0.5 – 7.0 keV) X-ray images. The detailed X-ray data reduction and the detected X-ray sources will be presented in a future paper (Wang et al. 2004, in preparation).
3 X-ray imaging Results
3.1 Non-detection of individual sources
A total of 101 Ly sources were imaged by the two exposures, 49 in the Boötes field, and 52 in the Cetus field. None were detected. To perform X-ray photometry analyses, for each Ly source we defined a circular source region centered at the source position on the X-ray images, with radius Rs set to the 95% encircled-energy radius of Chandra ACIS PSF at the position. The source regions defined above were used to extract source photons for the Ly sources, and the backgrounds were extracted from an annulus with after masking out nearby X-ray sources. The net count of each source was derived after accounting for differences of effective exposure time between source regions and background regions (mainly due to CCD edge effects and bad columns). We found that none of the Ly sources has an X-ray net count above 2 level in either 0.5 – 2.0 keV, 2.0 – 7.0 keV or 0.5 – 7.0 keV band. In Fig. 1 we present the histogram distributions of the signal-to-noise ratios (S/N) of the X-ray net counts from Ly sources.
We conclude that none of the Ly sources are detected by the X-ray observations, allowing us to place upper limits on their X-ray fluxes. For the Ly source nearest to the axis of X-ray observation (with an off-axis angle of 1.7), there are no photons within Rs in the 0.5 – 7.0 keV band. The 3 level upper limit of X-ray count is 6.61 (Gehrels 1986). Assuming a powerlaw spectrum with photon index of 2.0, this corresponds to a 3 upper limit of X-ray flux . Note that to make our fluxes in this paper directly comparable to those in other literatures, we convert the 0.5 – 7.0 keV band X-ray counts to . Other sources have higher upper limits due to the lower effective areas and larger PSF sizes. The “boomer”, LALA J020438.95-051116.2, is located at off-axis angle of 6.11′ in the image. We found no evidence of X-ray emission from the “boomer”: X-ray photometry yields a net count of 1.0 in the 0.5 – 7.0 keV band, with 3 upper limit of 12.2. The corresponding 3 upper limit to the X-ray flux is .
3.2 Stacking analysis
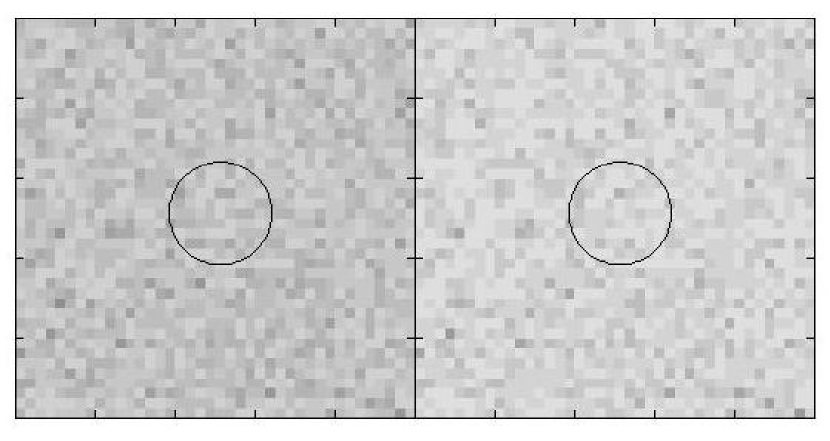
The symmetric histograms in Fig. 1 suggest that X-ray emission will not be detectable in summed images of either the total sample of Ly sources, or of the sub-sample of 64 Ly sources with rest frame EWs 240Å. We performed a stacking analysis to calculate the upper limit of the average X-ray flux for the Ly sources. We note that the X-ray fluxes of Ly sources located at larger off-axis angles ( 8′) are less constrained, because of their larger PSF sizes and lower effective exposures. Thus we only stacked the images for the 70 Ly sources (69% of the whole sample) with off-axis angles 8′, providing an effective exposure time of 10.6 Ms. The stacked 0.5 – 7.0 keV image is presented in Fig. 2. The second panel of Fig. 2 presents the stacked image for the subset of these sources with larger Ly equivalent widths (EW 240 Å in the rest frame). No cumulative X-ray emission is detected in either stacked image. For each of the 70 sources, X-ray photons within 80% encircled-energy radius of Chandra ACIS PSF were extracted and summed up. After subtracting the local background and applying aperture corrections, we obtained a net count of -12 in the 0.5 – 2.0 keV band, and -20 in the 0.5 – 7.0 keV band, with 3 upper limits of 29 and 52 respectively. The corresponding 3 upper limit on the average X-ray flux for the 5 Ly source population is , which is 67% of the limit in M03111 Using the 95% encircled energy radius for the ACIS PSF provides a somewhat degraded upper limit to the average X-ray flux. The method for calculating the average X-ray flux upper limit described in 3.2 of M03 is somewhat inaccurate. However, the limit presented there is very close to the correct value determined using the method provided here. , and . Note that including sources with off-axis angles 8′ will increase the summed effective exposure time to 14 Ms; however, it does not provide an improved upper limit on the average X-ray flux.
4 Discussion and Conclusions
We imaged 101 Ly emitters at z 4.5 with two 170 ks deep ACIS exposures. None were clearly detected at X-ray energies. In Fig. 3, we present the 1 upper limits of the X-ray fluxes against their Ly line fluxes, which in most cases are the only well measured properties of the Ly sources. For comparison, three high redshift type II quasars, CDF-S202 ( = 3.7, Norman et al. 2002), CXO52 ( = 3.288, Stern et al. 2002) and HDFX28 ( = 2.011, Dawson et al. 2003) are also plotted in the figure. We found that after scaling the X-ray fluxes with Ly line fluxes, all the Ly emitters at are fainter in X-ray than HDFX28, 96% of them are fainter than CDF-S202, and 50% are fainter than CXO52. This indicates that 4% of our Ly emitters at can be type II quasars like CDF-S202, and 50% of them can be like CXO52. However, that average X-ray to Ly ratio (1 upper limit) is 21 times fainter than that of CXO52, which means actually 4.8% of the Ly emitters could resemble CXO52.
Could some of our Ly emitters still be Seyfert 2 galaxies (i.e., lower luminosity type II AGNs)? Kriss (1984, 1985) presented samples of low redshift () Seyferts and quasars with good measurements of Ly line and X-ray luminosities. The AGNs in Kriss’s samples have X-ray luminosities spreading from LX 1042 erg s-1 to 1047 erg s-1, but no evidence of a correlation between their X-ray to Ly ratios and X-ray luminosities was found. This indicates that the X-ray to Ly ratios of low luminosity AGNs (i.e., Seyferts) are similar to these of luminous ones (i.e., quasars), thus the average X-ray to Ly ratio (upper limit) of our Ly emitters is not only significantly fainter than luminous quasars, but also lower luminosity AGNs. The average X-ray to Ly ratio of Kriss’s samples is also plotted in Fig. 3, which is pretty close to these of the three type II quasars, and 8.5 times higher than the average ratio (upper limit) of our Ly emitters at .
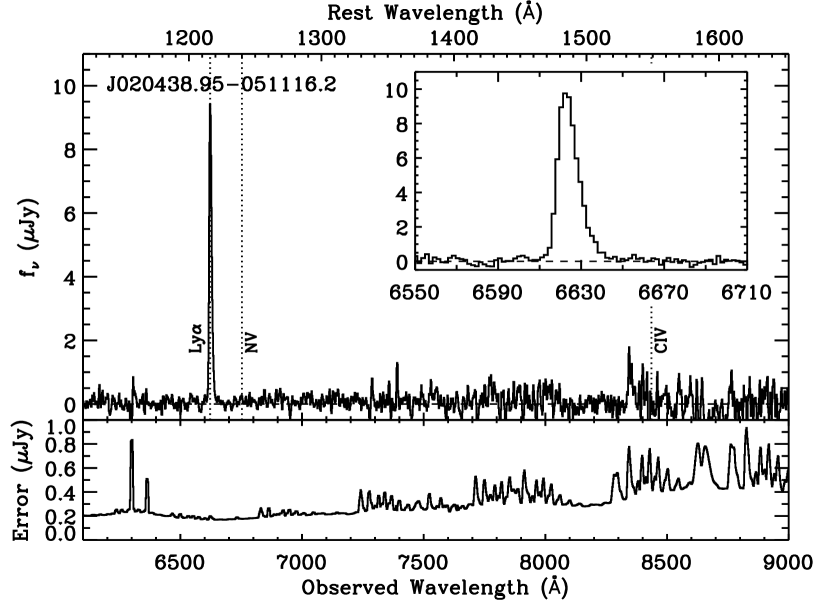
No evidence of AGN activity among our Ly emitters was found in optical spectra either. At , we have 18 confirmed Ly lines with Keck/LRIS, and 29 with Keck/DEIMOS (Dawson et al. 2004). The Ly lines are found to be narrow ( 500 km s-1) in all the spectroscopically confirmed Ly emitters (e.g., Rhoads et al. 2000, Rhoads et al. 2003, Dawson et al. 2004). This is in fact narrower than the typical physical line widths of even type II quasars (see Rhoads et al 2003). None of the spectra shows high excitation emission lines either (e.g., NV, CIV, HeII and CIII]), even in the stacked spectrum (Dawson et al. 2004). In Fig.4, we presented the Keck LRIS spectrum of our “boomer”, LALA J020438.95-051116.2, which has been confirmed to be normal star forming galaxy at z=4.457. We can clearly see a narrow (with a full width half maximum of 400 km s-1) and asymmetric Ly line, but no other lines indicating AGN activity.
We conclude that no evidence of AGN activity among our Ly emitters at z 4.5 was found, from either deep images, or optical spectra. The upper limit of 0.5 – 2.0 keV flux on the average LALA sources corresponds to an X-ray luminosity of ergs s-1 at (for either 0.5 – 2.0 keV rest frame or 2.0 – 8.0 keV rest frame bandpass, H0=65 km s-1 Mpc-1, =1/3, =2/3). The corresponding upper limits of L2-8keV for on-axis individual Ly emitters and the “boomer” are 3.3 and 6.6 ergs s-1 respectively. Our analysis indicates that 4.8% of our Ly emitters could be possible AGNs based on their average X-ray to Ly ratio. Steidel et al. (2002) found that 3% of their Lyman break galaxies at show clear evidence for AGN activity. It’s interesting to note that the upper limit of AGN fraction of our Ly emitters is well consistent with that of Lyman break galaxies.
References
- (1) Brown, M, Dey, A, Jannuzi, B. T., Lauer, T. R., Tiede, G. P., & Mikles, V. J. 2003, ApJ, 597, 225
- (2) Cowie, L. L., & Hu, E. M. 1998, AJ, 115, 1319
- (3) Charlot, S. & Fall, S. M. 1993, ApJ, 415, 580
- (4) Crawford, et al. 2002, MNRAS, 333, 809
- (5) Dawson, S., McCrady, N., Stern, D., Spinrad, H., Graham, J., & Dey, A. 2003, AJ, 125, 1236
- (6) Della Ceca, R. et al. 2003, A&A, 406, 555
- (7) Fiore, F. et al. 2003, A&A, 409, 79
- (8) Freeman, P.E., Kashyap, V., Rosner, R., & Lamb, D. Q., 2002, ApJS, 138, 185
- (9) Fujita, S. S., et al 2003, AJ, 125, 13
- (10) Fynbo, J. U., Moller, P., & Thomsen, B. 2001, A&A, 374, 443
- (11) Gehrels, N. 1986, ApJ, 303, 336
- (12) Hu, E. M., Cowie, Lennox L., & McMahon, Richard G. 1998, ApJ, 502, L99
- (13) Hu, E. M., et al. 2002, ApJ, 568, L75
- (14) Hu, E. M., Cowie, L. L., Capak, P., McMahon, R. G., Hayashino, T., Komiyama, Y. 2004, AJ, 127, 563
- (15) Jannuzi, B. T., & Dey, A. 1999, in ASP Conf. Ser. 191, Photometric redshifts and High-Redshift Galaxies, ed. R. J. Weymann, L. J. Storrie-Lombardi, M. Sawicki, & R. J. Brunner (San Francisco: ASP), 111
- (16) Kodaira, K. et al. 2003, PASJ, 55, L17
- (17) Kriss, G. A. 1984, ApJ, 277, 495
- (18) Kriss, G. A. 1985, AJ, 90, 1
- (19) Kudritzki, R.-P. et al. 2000, ApJ, 536, 19
- (20) Malhotra, S. & Rhoads, J.E. 2002, ApJ, 565, L71
- (21) Malhotra, S., Wang, J, Rhoads, J. E., Heckman, T. M., & Norman, C. A., 2003, ApJ, 585, L25
- (22) Mainieri, V. et al. 2002, A&A, 393, 245
- (23) Norman, C. et al. 2002, ApJ, 571, 218
- (24) Ouchi, M. et al 2003, ApJ, 582, 60
- (25) Partridge, R. B. & Peebles, P. J. E. 1967, ApJ, 148, 377
- (26) Pentericci, L. et al. 2000, A&A, 361, 25
- (27) Rhoads, J. E., Malhotra, S., Dey, A., Stern, D., Spinrad, H., & Jannuzi, B. T. 2000, ApJ, 545, L85
- (28) Rhoads, J. E. & Malhotra, S. 2001, ApJ, 563, L5
- (29) Rhoads, J. E. et al. 2003, AJ, 125, 1006
- (30) Rhoads, J. E. et al. 2004, ApJ in press, astro-ph0403161
- (31) Shimasaku, K. et al. 2003, ApJ, 586, L111
- (32) Stern, D. et al. 2002, ApJ, 568, 71
- (33) Steidel, C. et al 2002, ApJ, 576, 653
- (34) Stiavelli, M., Scarlata, C., Panagia, N., Treu, T., Bertin, G., & Bertola, F. 2001, ApJ, 561, L37
- (35) Wang, J. et al. 2004, AJ, 127, 213