e-mail: hschild@astro.phys.ethz.ch 22institutetext: Paul Scherrer Institut, Würenlingen & Villigen, CH 5232 Villigen PSI, Switzerland
e-mail: guedel@astro.phys.ethz.ch 33institutetext: SRON National Institute for Space Research, Sorbonnelaan 2, NL-3584 CA Utrecht, the Netherlands
e-mail: a.j.j.raassen@sron.nl; k.a.van.der.hucht@sron.nl; r.mewe@sron.nl 44institutetext: Physikalisch-Meteorologisches Observatorium Davos, Dorfstrasse 33, CH 7260 Davos Dorf, Switzerland
e-mail: w.schmutz@pmodwrc.ch 55institutetext: Astronomical Institute ”Anton Pannekoek”, Kruislaan 403, NL-1098 SJ Amsterdam, the Netherlands
e-mail: raassen@science.uva.nl 66institutetext: Columbia Astrophysics Laboratory, Columbia University, 550 West 120th Street, New York, NY 10027, USA
e-mail: audard@astro.columbia.edu; maurice@astro.columbia.edu 77institutetext: Center for Astrophysics and Space Astronomy, University of Colorado, Campus Box 389, Boulder, CO 80309-0389, USA
e-mail: skinner@origins.colorado.edu
Wind clumping and the wind-wind collision zone in the Wolf-Rayet binary Velorum ††thanks: Based on observations obtained with XMM-Newton, an ESA science mission with instruments and contributions directly funded by ESA Member States and the USA (NASA).
We present XMM-Newton observations of Velorum (WR 11, WC8+O7.5III, = 78.53 d), a nearby Wolf-Ray binary system, at its X-ray high and low states. At high state, emission from a hot collisional plasma dominates from about 1 to 8 keV. At low state, photons between 1 and 4 keV are absorbed. The hot plasma is identified with the shock zone between the winds of the primary Wolf-Rayet star and the secondary O giant. The absorption at low state is interpreted as photoelectric absorption in the Wolf-Rayet wind. This absorption allows us to measure the absorbing column density and to derive a mass loss rate = 810-6 M⊙yr-1 for the WC8 star. This mass loss rate, in conjunction with a previous Wolf-Rayet wind model, provides evidence for a clumped WR wind. A clumping factor of 16 is required. The X-ray spectra below 1 keV (12 Å) show no absorption and are essentially similar in both states. There is a rather clear separation in that emission from a plasma hotter than 5 MK is heavily absorbed in low state while the cooler plasma is not. This cool plasma must come from a much more extended region than the hot material. The Neon abundance in the X-ray emitting material is 2.5 times the solar value. The unexpected detection of C v (25.3 Å) and C vi (31.6 Å) radiative recombination continua at both phases indicates the presence of a cool ( 40,000 K) recombination region located far out in the binary system.
Key Words.:
binaries: spectroscopic — stars: early-type — stars: individual: Vel — stars: winds, outflows — stars: Wolf-Rayet — x-rays: individual: WR 11, Velorum1 Introduction
The massive Wolf-Rayet binary system Velorum (WR 11, WC8+O7.5III, = 78.53 d) is an astrophysical laboratory in which many aspects of mass loss and wind-wind collision phenomena can be studied. The system is relatively nearby, its Hipparcos distance is pc (van der Hucht et al. 1997; Schaerer et al. 1997). Both stars in the binary have been recently investigated with sophisticated model atmospheres and their stellar parameters are reasonably well known (De Marco & Schmutz 1999, De Marco et al. 2000).
The binary orbit has been re-determined by Schmutz et al. (1997) who combined recent with earlier observations (Niemela & Sahade 1980; Pike et al. 1983; Moffat et al. 1986; Stickland & Lloyd 1990). The orbit is mildly eccentric and has an inclination of 63∘ 8∘ (De Marco & Schmutz 1999). Because of the high orbital inclination, any emitting structures are seen through changing absorption columns as the stars revolve.
Since Vel is the nearest WR star, (see van der Hucht 2001), it is relatively bright and well observable at any wavelength, in particular in the X-ray domain. It has been observed by all previous X-ray observatories, from the Einstein observatory (White & Long 1986; Pollock 1987) to ASCA (Stevens et al. 1996; Rauw et al. 2000), and, more recently, by Chandra (Skinner et al. 2001). Its X-ray observational history has been reviewed by van der Hucht (2002) and Corcoran (2003).
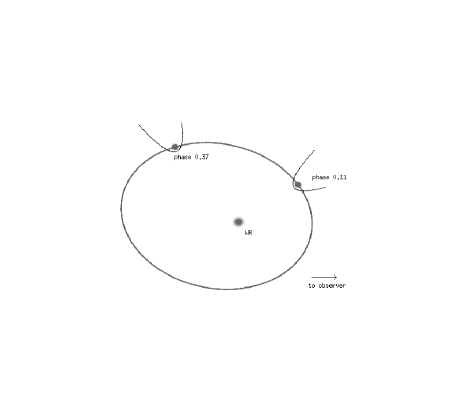
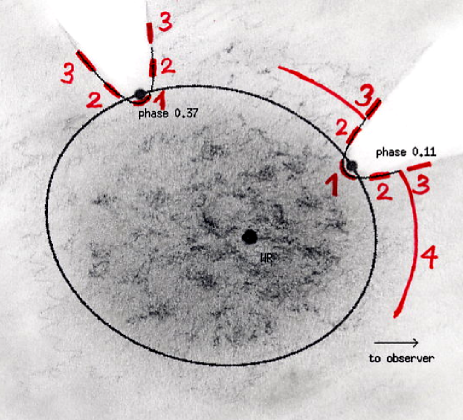
With a series of ROSAT observations covering the binary orbit of Vel, Willis et al. (1995) discovered that the X-ray emission is a factor of 4 enhanced during a brief time span when the O-type component is in front. They also showed that the steep increase takes place only in ROSAT ’s hard X-rays . They convincingly interpreted the variable X-ray emission to arise from colliding stellar winds. The enhancement is explained by the viewing geometry, when the collision zone can be seen through a rarefied cavity that builds around and behind the O-type component (see Fig. 1). At other phases the dense WR wind absorbs the X-rays from the collision zone. The wind blown cavity is generally orientated away from the WC component but it is also somewhat warped because of the binary motion of the O star.
Here we present XMM-Newton observations of Vel, taken at two phases. The first phase is at the maximum X-ray flux, a few days after the O-type component passed in front of the WR star. The second phase is intermediate between quadrature and superior conjunction. In this configuration the O star is seen through a large portion of the extended WR atmosphere (Fig. 1).
After describing the observations and the most interesting spectral features we analyze the data in two different ways. First, we simply take the X-ray emitting zone as a source of light with which the WR wind is irradiated. The observed absorption changes between different orbital phases provide unique information about the structure of the WR wind. Secondly, we interpret the X-ray emission at both phases by a spectral fitting procedure. This reveals new insights into the geometric and thermal structure and the elemental composition of the wind-wind collision zone.
2 Observations
The log of our XMM-Newton observations of Vel is presented in Tab. 1. A description and a preliminary analysis of the observations are given by Dumm et al. (2003). Technical information on XMM-Newton and its X-ray instrumentation can be found in den Herder et al. (2001), Jansen et al. (2001), Strüder et al. (2001), and Turner et al. (2001).
| high state | low state | high state | low state | |
| 8-11-2000 | 26-11-2000 | 14-4-2001 | 5-5-2001 | |
| instr. | exp. t. | exp. t. | exp. t. | exp. t. |
| (hr) | (hr) | (hr) | (hr) | |
| RGS1 | 4.29 | 5.80 | 8.72 | 16.81 |
| RGS2 | 4.51 | 5.80 | 8.72 | 16.81 |
| MOS1 | 3.76 | 5.74 | 8.56 | 16.64 |
| MOS2 | 3.83 | 5.77 | 8.56 | 16.64 |
| PN | 2.78 | 4.16 | 7.83 | 15.14 |
Our observations were obtained at phases 0.11 and 0.37. The phase is calculated according to the ephemeris of Schmutz et al. (1997). With this ephemeris, periastron occurs at zero phase, the O-type component is in front shortly afterwards at and the WR is in front at phase 0.61. The observations were scheduled according to the X-ray light curve of Willis et al. (1995). The first phase covers the short maximum, whereas at the second phase the X-ray flux is low. The two observations of November 2000 were both terminated prematurely because of strong solar radiation and, therefore, the exposure times of the first two observations are considerably shorter than those of April and May 2001. Within the error bars the observations at corresponding phases agree with each other. Here we use only the second data set.
| ion | E0 | Eobsa | flux | ||
| (keV) | (keV) | (Å) | high | low | |
| EPIC-MOS: | |||||
| Fe xxv | 6.701 | 6.669(10) | 1.85 | 3.2(.3) | 3.9(.2) |
| 6.637 | |||||
| Ca xix | 3.903 | 3.919(22) | 3.2 | 1.1(.2) | 0.66(.12) |
| 3.861 | |||||
| Ar xvii | 3.140 | 3.151(7) | 4.0 | 2.0(.2) | 0.41(.11) |
| 3.104 | |||||
| S xvi | 2.6229 | 2.653(14) | 4.7 | 1.2(.3) | 0.28(.16) |
| 2.6196 | |||||
| S xv | 2.4607 | 2.466(4) | 5.0 | 6.0(.3) | 0.61(.11) |
| 2.4473 | |||||
| 2.4306 | |||||
| Si xiii | 2.1826 | 2.188(11) | 5.7 | 1.2(.3) | 0.05 |
| Si xiv | 2.0062 | 2.019(4) | 6.2 | 3.2(.3) | 0.05(.04) |
| 2.0043 | |||||
| Si xiii | 1.8650 | 1.877(4) | 6.7 | 5.5(.3) | 0.30(.07) |
| 1.8539 | |||||
| 1.8395 | 1.833(9) | 2.7(.2) | |||
| Mg xii | 1.4721 | 1.480(5) | 8.42 | 1.6(.1) | 0.11(.04) |
| Mg xi | 1.3523 | 1.349(3) | 9.17 | 2.2(.2) | 0.30(.04) |
| 1.3431 | 9.23 | ||||
| 1.3312 | 9.31 | ||||
| RGS: | |||||
| Si xiv | 2.0062 | 2.00(1) | 6.2 | 2.4(.9) | – |
| 2.0043 | |||||
| Si xiii | 1.8650 | 1.859(3) | 6.7 | 10.1(1.2) | 0.43(.27) |
| 1.8539 | |||||
| 1.8395 | |||||
| Mg xii | 1.4721 | 1.474(2) | 8.42 | 2.4(.4) | – |
| Mg xi | 1.3523 | 1.3518(10) | 9.17 | 2.2(.4) | 0.13(-) |
| 1.3431 | 1.3336(20) | 9.23 | 1.6(.5) | 0.09(.07) | |
| 1.3312 | 9.31 | ||||
| Ne x | 1.2109 | 1.2120(14) | 10.24 | 0.67(.18) | 0.14(.06) |
| Ne x | 1.0218 | 1.0258(16) | 12.13 | 1.19(.20) | 0.24(.08) |
| Ne ix | 0.9220 | 0.9223(6) | 13.44 | 0.59(.18) | 0.60(.11) |
| 0.9148 | 0.9148(18) | 13.55 | 0.24(.16) | 0.16(.10) | |
| 0.9050 | 0.9038(9) | 13.70 | 0.19(.14) | 0.34(.09) | |
| Fe xvii | 0.8258 | 0.8279(23) | 15.01 | 0.21(.08) | 0.15(.06) |
| O viii | 0.7746 | 0.7762(25) | 16.01 | – | 0.07(.05) |
| Fe xvii | 0.7392 | 0.7396(8) | 16.78 | 0.14(.07) | 0.10(.03) |
| Fe xvii | 0.7271 | 0.7286(-) | 17.05 | 0.11(.07) | 0.07(.05) |
| Fe xvii | 0.7251 | 0.7246(-) | 17.10 | – | 0.12(.06) |
| O viii | 0.6536 | 0.6543(20) | 18.97 | – | 0.17(.05) |
| O vii | 0.5739 | 0.5742(31) | 21.60 | – | 0.12(.08) |
| O vii | 0.5686 | 0.5678(-) | 21.80 | – | 0.03(-) |
| O vii | 0.5610 | 0.5600(17) | 22.10 | – | 0.13(.06) |
| N vii | 0.5003 | 0.5009(10) | 24.78 | – | 0.24(.13) |
| C vi RRC | 0.4900 | 0.4911(3) | 25.30 | 0.30(.09) | 0.40(.07) |
| C vi | 0.4356 | 0.4357(10) | 28.47 | 0.16(.11) | 0.06(.03) |
| N vi | 0.4198 | 0.4188(3) | 29.53 | 0.14(.08) | 0.07(.04) |
| C v RRC | 0.3921 | 0.3927(8) | 31.60 | 0.18(.13) | 0.12(.06) |
| C vi | 0.3675 | 0.3679(4) | 33.74 | 0.31(.08) | 0.35(.09) |
-
: From high (or low) state for (or ) 1 keV, resp.
The spectra were obtained with the XMM-Newton european photon imaging cameras (epic), mos and pn, and with the high-resolution reflection grating spectrometers (rgs). The rgs have an energy coverage from 0.35 to 2.5 keV (5 to 37 Å), and the epic can exploit the full XMM range from 0.15 to 15 keV (0.8 to 83 Å).
The data have been reduced with standard procedures using the XMM-Newton science analysis system (sas), with the available calibration data. The epic response matrices from the epic instrument team have been used to fit the ccd spectra. The rgs1 and rgs2 spectra have been co-added. No correction for interstellar absorption has been applied.
3 Spectral features and variability
In this section we highlight and discuss selected features of the observed X-ray spectra. We apply simple analysis techniques in order to get some indications about the underlying excitation, ionization and absorption mechanisms.
3.1 The emission lines
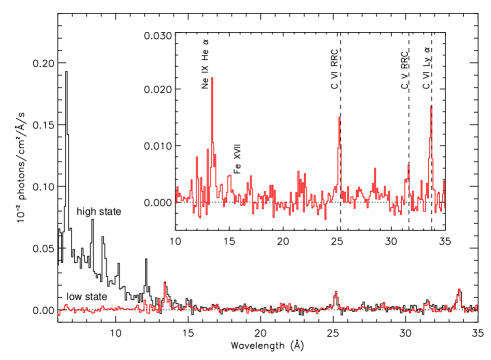
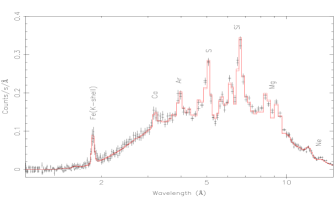
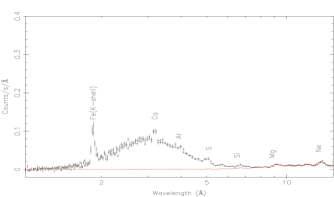
Our high-resolution (rgs) spectra are shown in Fig. 2. Line identifications and measured line fluxes are listed in Tab. 2. The line fluxes given by Skinner et al. (2001) and taken at phase 0.08 lie mostly between our high and low line state line fluxes. This is consistent with the steep increase in X-ray intensity at early phases.
3.1.1 Carbon recombination features
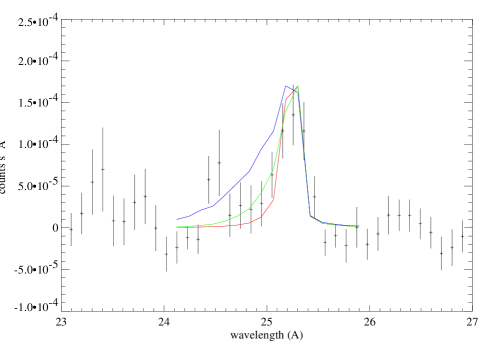
Surprisingly we find among these emissions the radiative recombination continua (RRC) of C vi and C v at 25.3 Å and 31.6 Å, respectively (Fig. 2). Also the C vi Ly line is clearly detected. The intensity of this line with respect to the RRC is in agreement with it being formed by recombination. The shape of the high energy tail of the RRC is a direct measure of the temperature of the recombining electrons. In Fig. 3 we compare the observed C vi RRC with the theoretically calculated spectral distribution for different electron temperatures convolved with the rgs response curve. The temperatures between about 60 000 K and 20 000 K agree with the observed energy distribution. This temperature is too low for collisional ionization and implies that radiation may be the dominating ionization process. A possible radiation source could be the X-ray emission from the wind-wind collision zone.
3.1.2 Line width
The O vii and O viii emission lines in the low state spectrum of Vel, and the C vi Ly (33.74 Å) line in the high and low state spectra, show some measurable broadening. Fitting the C vi line with an instrumental profile results in fwhm = 1.8 0.8 10-3 keV for both, low and high state, corresponding to an expansion velocity of the order of 1300 km s-1. Such velocities are comparable to those found in the Chandra-hetgs spectrum of Vel for He- and H-like lines of Mg, Si, and S (Skinner et al. 2001), and are close to the terminal wind velocity = 1450 km s-1 of the WC star, as found from infrared He i lines by Eenens & Williams (1994).
3.1.3 The Ne ix lines
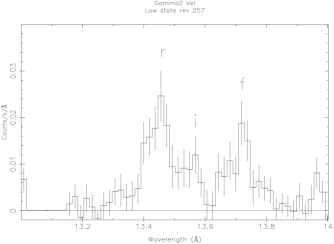
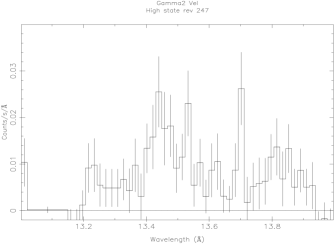
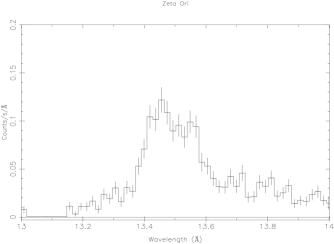
Figure 4 shows the resonance (), intercombination () and forbidden () components of the He-like Ne ix triplet of Vel (WC8+O7.5III) and compares it with with the same lines observed by XMM-Newton-rgs in the O-type system Ori (O9.7Ib + O8-9V + B2III, see Hummel et al. 2000).
The forbidden line in Vel is much stronger than in O stars. In Vel the ratio =/ at low state is consistent with =3.1, the value expected when excitations from the upper level of the forbidden line to the upper levels of the intercombination line are negligible. This is in contrast to observations of single O-type stars (Schulz et al 2000, Kahn et al 2001, Waldron & Cassinelli 2001, Cassinelli et al 2001, Miller et al 2002, Raasen et al 2004), where R is smaller. In these O stars, the X-ray emitting plasma is formed relatively close to the star, and UV photoexcitation from the upper level of the forbidden to the upper levels of the intercombination line is responsible for the observed ratio. The high ratio observed in gamma Vel implies that the Ne IX lines are formed far away from the O star, where the UV flux is low.
Our observation of the Ne ix triplet at high state (Fig. 4, central panel) is much noisier. Although the total flux is approximately the same, the exposure time is about half as long, and the statistics are correspondingly worse. The ratio appears to be closer to about 1 in this case, as compared to =3.1, but it is not clear whether this is statistically significant. Chandra HETG obervations of gamma Vel at a similar phase find for Ne ix (Skinner et al. 2001).
A lower limit to the distance from the O star at which the Ne ix lines are formed can be calculated using the formalism of Blumenthal, Drake & Tucker (1972). The dependence of on radius can be written where , , and is the photoexcitation rate at 1278 Å at the photosphere which is calculated with a TLUSTY model (see Lanz & Hubeny, 2003) with log g=3.75 and T=35000 . Taking , we find , with the photospheric radius of the O star. The biggest uncertainties are the photospheric UV flux, which is a strong function of wavelength due to the many aborption lines near this wavelength, and the f/i ratio itself.
It is clear that the Ne IX emission is not coming from anywhere near the O star, and this essentially rules out the possibility that it arises due to intrinsic X-ray emission from the stellar wind of the O star.
We finally note that the deduced emission measure of the Ne ix lines is surprisingly small (Dumm et al. 2003) compared to the emission measure of the single O4I(n)f star Pup (Kahn et al. 2001).
3.2 Absorption at low state
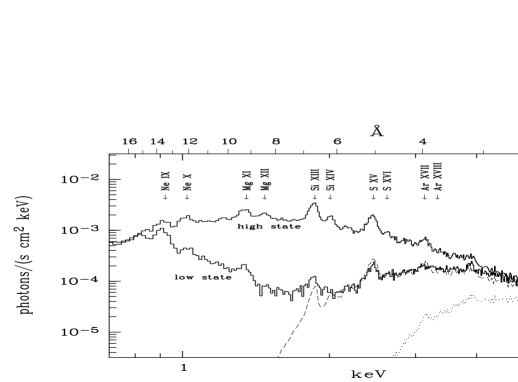
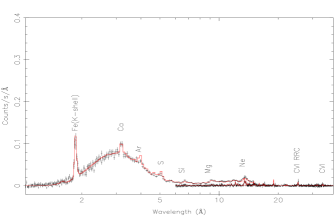
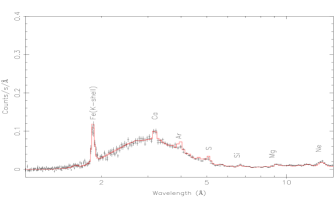
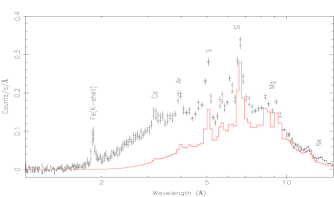
Fig. 5 shows our XMM-epic spectra at the low and high states. At very low and very high energies the spectra are identical, but at intermediate energies the low state spectrum shows a deep depression. At 2 keV the photon flux is reduced by more than an order of magnitude. At low state, a flux deficiency is detected between about 1 and 4 keV. The emission lines also show a different absorption behaviour. Some lines are heavily absorbed while others are not:
-
•
The absorbed component: At phase = 0.37, the hard emission lines are all reduced by a large factor with the exception of the Fe xxv complex at 1.85 Å. (Tab. 2). The lines of the highly ionized species of Ar, S, Si, and Mg which are very strong at high state are barely detectable at low state. We therefore expect that these lines originate in the deeply embedded wind-wind collision zone.
-
•
The unabsorbed component: There is no measurable line flux variations longward of 13 Å. We detect here lines from the Fe xvii, Ne ix, O viii, O vii, and C vi species. The radiative recombination continua (RRC) of C vi 25.3 Å and C v at 31.6 Å are also not absorbed. These practically unchanging emissions are formed further out in the binary system, such that any wind material between us and the emission region is transparent. We note that the unabsorbed emissions originate from two different mechanisms, i.e., from collisional excitation and recombination.
4 Absorption by the Wolf-Rayet wind
4.1 The absorption column and mass loss rate
To interpret the absorption at phase 0.37, we adopt the view of Willis et al. (1995) and Stevens et al. (1996), in that we assume that the high-energy X-rays emerge from the wind-wind collision zone. These X-rays are attenuated by the surrounding material of the WR wind, except for the phase where we view the collision zone through the cavity behind the O-type component (see Fig. 1). The attenuation of the X-rays during low phase is a direct measure of the column density in the WR wind. The contribution of the O star wind and the shock zone to the total absorption column is small compared to the WR wind and we neglect it.
We calculate the expected absorption at phase by using a smooth WR wind model that was especially developed for Vel (De Marco et al. 2000, isa model). We approximate the position of the X-ray source with the O star itself. The location of the stagnation point is given by the wind momentum balance
| (1) |
This high ratio, obtained with the mass loss data of De Marco & Schmutz (1999) and De Marco et al. (2000) implies that the collision zone is indeed very close to the O-type component.
The low state spectrum is calculated by using the high state spectrum as input and passing it through the absorption column from the position of the O star to the observer. We implicitely assume that the X-ray emission does not vary with phase. This is not necessarily correct because theoretically, we might expect a X-ray luminosity that is inversely proportional to the instantaneous binary separation (Usov 1992). Since, however, we do not see any significant difference between high and low state above 4.5 keV ( 2.7 Å), we believe that the assumption of a constant X-ray emission is reasonably well justified.
The WR atmosphere model includes helium, carbon and oxygen abundances and their ionization states. Neon is assumed to be doubly ionized and its abundance is set to Ne/He = 410-3 (by number) as determined from ISO-sws spectroscopy (Dessart et al. 2000). The magnesium and silicon abundances are set to th of the neon abundance, and for the sulfur abundance we adopt th of the neon abundance. Errors in these abundances only have a marginal effect on the overall appearance of the emerging spectrum. Analytical fits for the partial photo-ionization cross sections given by Verner & Yakovlev (1995) are used.
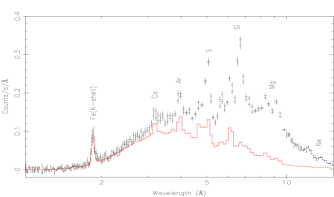
In Fig. 5 we indicate by the dotted line the attenuation at phase = 0.37 predicted by this WR wind model. The absorption by this WR wind is substantially too high. If we treat the column density as a free parameter and adjust it to fit the observed attenuation, we derive a column density of =51021 cm-2. This is a factor 4 smaller than what it would be in the WR wind model.
From the observed colum density we can calculate a distance-independent mass loss rate of 810-6 /yr for the WC8 star. The dominating error source in this value is uncertainties in the chemical composition, particularly in the carbon and oxygen abundances because these elements dominate the opacity in the wind. A further but probably minor factor is the assumption of spherical symmetry in the extended WR atmosphere.
4.2 Wolf-Rayet wind clumping
The fact that the mass loss rate of the WC8 star determined through X-ray absorption is a factor of four less than what is predicted by a homogeneous atmospheric model deduced from spectral line fits is easily interpreted in terms of Wolf-Rayet wind clumping.
Clumping of a stellar wind can be described in a simple way by the clumping factor . This factor defines by how much the density is enhanced in a clump with respect to the smooth density
| (2) |
The interclump volume is assumed to be devoid of material. In order to keep the total amount of material the same in the clumped and the smooth model, the clumps only fill a volume that is of the volume of the smooth model. The volume filling factor is thus the inverse of the clumping factor.
| (3) |
WR model atmospheres resulting from emission line fits can not easily disentangle the effects of mass loss and clumping. Locally, the intensity of a WR emission line is determined by , with the local particle density. The total line emission in a smooth model is
| (4) |
is the mass loss rate that follows from fitting the model to the WR emission lines.
In the case of a clumped wind the line intensity becomes
| (5) | |||||
| (6) | |||||
| (7) | |||||
| (8) |
The same line intensity can thus be produced by various combinations of the mass loss rate and the clumping factor.
Since is larger than 1, a clumped wind always produces stronger emission lines than a smooth wind with the same amount of matter in it.
In the previous section we found from the X-ray absorption that the mass loss rate of the WR star in Vel is only one fourth of the rate deduced from a smooth Wolf-Rayet wind model. In order to still fit the emission lines the clumping factor has to be
| (9) |
In this scheme, the volume filled by the clumps is thus only 6 %.
We note that this clumping factor follows from our mass loss rate as determined from the observed X-ray absorption in conjunction with a Wolf-Rayet model atmosphere that is based on UV, optical and IR emission line fitting. The mass loss rate of the smooth model depends on the adopted distance : . The model we use is for =258 pc. If we adopt instead of the Hipparcos distance the older value of =450 pc, the mass loss of the smooth model would become 2.3 times larger. The mass loss rate from the X-ray absorption, on the other hand, is not affected by the distance. The X-ray deduced mass loss rate would in that case be about 9 times smaller than the one from the smooth model. The clumping would have to be much more pronounced with a clumping factor as high as 80.
5 Synthesizing the X-ray emission
We now turn to the interpretation of the X-ray emission. In Sect. 3 we have already seen that the X-ray spectrum consists of different components. In order to further deepen the analysis we now develop synthesized spectra to match the full observed data at both low and high state.
5.1 The basic models
The spectra as discussed above obviously require synthetic models that should include hot thermal sources (predominantly for the emission between 1–10 keV) but also a recombination model (for the long-wavelength portion). The basic model components we use for the description of all spectra are included in the SPEX software (Kaastra et al. 1996). For the hot thermal sources, we use optically thin plasma models in collisional ionization equilibrium (cie models) as developed by Mewe et al. (1985, 1995). The underlying mekal data base is given as an extended list of fluxes of more than 5400 spectral lines. 111http://www.sron.nl/divisions/hea/spex/version1.10/line/
| element | ionization | |
|---|---|---|
| collisional | photo- | |
| H | 0.5 | 0 |
| He | 1 | 1 |
| C | 14 | 27 |
| N | 0.5 | 0 |
| O | 1.6 | 2.2 |
| Ne | 2.5 (.5) | 2.4 |
| Mg | 1.2 (.1) | 1 |
| Si | 1.07 (.08) | 1 |
| S | 1.00 (.08) | 1 |
| Ar | 1.0 (.15) | 1 |
| Ca | 1.2 (.2) | 1 |
| Fe | 1.0 (.1) | 1 |
| Ni | 2.4 | 1 |
The long-wavelength part of the spectrum is interpreted with a model in which lines are formed by pure radiative recombination, e.g., C vi Ly, , lines at 33.74 Å, 28.47 Å and 26.99 Å, and the O vii lines at 21.6–22.1 Å. The shape of the rrc at 25.3 Å constrains the temperature of the emitting gas to 38 000 7 500 K (cf. Fig. 3). The rrc of C v at 31.6 Å is also fitted by this model. Methodologically, this component is described by a temperature-jump model in spex for which we assume a relatively high starting temperature (e.g., 1 keV) and a steep temperature drop (of the order of a few K), leaving the plasma in a purely recombining state.
| Vel | Ori | Vel | Ori | |||||||||
|---|---|---|---|---|---|---|---|---|---|---|---|---|
| = 0.11, high state | = 0.37, low state | |||||||||||
| component i | 1 | 2 | 3 | 4 | 1 | 2 | 1 | 2 | 3 | 4 | 1 | 2 |
| [1022cm-2]a | 3.3(.4) | 1.87(.09) | 1.04(.05) | 0.011 | 1.1 | 1.1 | 14.6(.6) | 7.1(.5) | 0.84(.02) | 0.041 | 6.0 | 6.0 |
| b | 5.1(0.3) | 2.4(.2) | ||||||||||
| [keV] | 1.65(.07) | 0.66(.03) | 0.25 | 0.0033c | 0.57 | 0.20 | 1.53(.04) | 0.67(.06) | 0.25(.07) | 0.0033c | 0.57 | 0.20 |
| [1055cm | 2.09(.18) | 3.9(.3) | 0.48 | 0.0031c | 0.14 | 0.40 | 4.0(.3) | 1.6(.5) | 0.48(.05) | 0.0031c | 0.14 | 0.40 |
| [1032 erg s-1] | 3.1 | 10.4 | 1.3 | 0.012 | 0.41 | 0.54 | 6.1 | 4.2 | 1.3 | 0.012 | 0.41 | 0.54 |
| 14.8 | 11.6 | |||||||||||
| 2263/1602 | 2232/1602 | |||||||||||
-
Notes:
-
: Column density derived for standard absorption model (with solar abundances) from Morrison & McCammon (1983) for all components. In all fits an additional value of 0.0081022 cm-2 was assumed for the interstellar absorption. The results indicate that most of the absorption must be due to circumstellar material.
-
: Column density with a warm absorber model in spex with temperature 50 000 K and abundances according to those in the wind of a WC star (see Table 3, 2nd column). Because here the H abundance is zero we use the subscript X referring to the reference element X (here He). Though the values for are smaller than the corresponding values for in the previous fit, the overall absorption is still the same because of the larger contribution from other elements (e.g. C). The fit is significantly the same because = 2215/1606.
-
: Temperature and emission measure determined by a fit to the C vi rrc feature at 25.3 Å in the low state (errors are 0.0006 keV and 0.00081055 cm-3, respectively). For the high state we assume the same values.
In principle, each of the model components could have its own set of abundances. Fortunately, however, we have relatively good a priori knowledge of the composition of the two stellar winds, and we make the following plausible assumptions.
For the recombining component, we assume a pure WC star plasma, because this is suggested by the dominance of the C lines. The abundances for the WC wind were taken from van der Hucht et al. (1986), De Marco et al. (2000), and Dessart et al. (2000). The abundances in Tab. 3 are given relative to the solar photospheric values. The solar abundances are from Anders & Grevesse (1989) except for Fe, for which we use log = 7.50 (see Grevesse & Sauval 1998 and 1999) instead of 7.67. The WC abundances largely deviate from solar composition in particular for He, C, N, O, and Ne. In the fit we keep all abundances fixed except for O.
The elemental abundances of the hot, collisionally ionized plasma lie somewhere between the abundances of the WR star and those of the O star. We adopt a mixture of material with 50% WC and 50% solar composition. This is justified because the difference between solar and WC abundance patterns is mainly in the light elements up to neon. Heavier elements are only slightly or not at all processed in WC stars. The abundances of all elements with observable emission lines are left to vary while those with no emission lines are kept fixed (Tab. 3).
5.2 Model strategy
We developed an acceptable model along the following line. First, during low state, there is a hard component isolated from the longer wavelengths by the absorption trough. This component does not vary between low and high state but it is subject to variable absorption. We found that two cie components are required to describe the range of temperatures forming lines from Mg xi to Fe xxv plus the hot continuum in the high state.
To first order, the low-state spectrum longward of about 8 Å or below about 1.5 keV is uncontaminated by the hard component. Judged from the flux in the Ne IX line, it is also approximately constant between low and high state, with constant absorption. This component alone therefore describes the low-state cie plasma at long wavelengths.
In a first iteration we, therefore, used three cie models, each with constant emission measure, of which only the two hotter ones are subject to variable absorption between low and high state, and all are composed of a mixture of WR and O star material as indicated in Table 3. A separate fourth component, again constant for low and high state, is required for the recombining portion longward of 15 Å, with a pure WC composition.
Using this setup, the interpretation becomes essentially one of the absorption of the various components. During high state, the absorption is obviously weak for all components, which is little surprising as the radiation principally escapes through the low-density cone behind the O star. We therefore assume solar composition for the absorption components during high state. The deep absorption of the hotter material in low state, on the other hand, is thought to be due to the WR wind when it moves into the line of sight toward the hot shock region. Its composition should therefore be identical to the WR wind, which we assumed in our calculations although we also tested absorption by a wind with solar composition e.g., from the O star. The results are similar although the definition of the column density necessarily varies (Table 3).
We tested in a first iteration whether this setup produces meaningful results. To this end, we fitted the low-state spectrum longward of 8Å (below 1.5 keV) with the coolest cie model, and simultaneously the complete high-state spectrum with this same model plus the two hotter cie components. The recombining portion was not included, and the isolated, absorbed high-energy portion of the low state was also not considered. Each of the three cie components was subject to a separate but constant absorption. Since the abundance mix should not be too far from solar (apart from C, N, and O which are not varied for the cie components since the relevant lines are formed longward of 15 Å), we determined them, in a first step - and deviating from our final choice described in Sect. 5.1 - as free parameters without using a priori assumptions. Spectra from both RGS and both MOS detectors were fitted simultaneously with this composite model.
The three resulting temperatures were found to be approximately and keV, with emission measures in the proportion of 1.0:4.5:2.0. The most interesting result was increasing absorption columns, cm-2, cm-2, and cm-2, respectively. This suggests that the hot material is more deeply embedded in the WR wind than the cool material.
Most abundances were found within a factor of two around solar photospheric values (C, N, O not included), making the assumption of a mixture between O and WR star material as suggested in Table 3 plausible. With a value of 1.55, the overall spectral fit was acceptable although deficiencies, in particular in the region around 1 keV, were still visible.
5.3 Spectral synthesis
With this plausibility analysis, we proceeded with a more general model that, first, also includes self-consistently the variable WR wind absorption of the hot components, second, independently fits the recombination component with WR abundances (Tab. 3). The coolest cie component was fitted in the low state and was then fixed for the high state (this is borne out by the constancy of the Ne ix line flux in the spectra, see, e.g., Fig. 2). The abundances are again fitted except for H, C, N, and O for which we use the predetermined mixture from the O and WR star winds. The other elemental abundances, in fact, should be easy to determine since the spectra contain isolated and well developed line features for Ne, Mg, Si, S, Ar, and Fe in the high state (Fig. 5, Tab. 2). The abundance results are summarized in Tab. 3. Most abundances are compatible with a solar composition with the notable exception of Neon, which turns out to be 2.5 times solar. Of the abundances that we fit, Neon is the one that is most sensitive to discriminate between a solar and WC composition. Although clearly enhanced, our X-ray determined Neon abundance is lower than the factor of 6-8 times solar that is measured in the WC8 wind with ISO spectroscopy of WR wind lines (Dessart et al. 2000). We therefore clearly detect a contribution from the WR star in the shocked material but the Neon abundance is still lower than what would be expected if it were purely composed of WC material. This indicates that the shocked material is indeed a mixture of WC and O star material. Our measured Neon abundance also justifies ’a posteriori’ our choice of abundances as a mixture of half WR material and half O star material for those elements that are not observable through their X-ray emission lines.
Table 4 summarizes the results of the fitting procedure for the various emission components. It shows a gratifying agreement with our previous plausibility analysis. The temperatures are essentially the same, and the absorption column densities in high state increase with increasing temperature of the component. The total emission measure of the two hotter components stays constant although the distribution between the two components differs, which we suggest is a numerical artifact since a slight uncertainty in the absorption columns, in particular during low state, requires a large correction in the emission measures. We note that with the exception of the X-ray luminosities , the values in Table 4 do not depend on the distance.
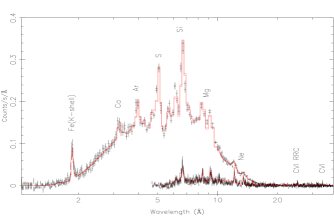
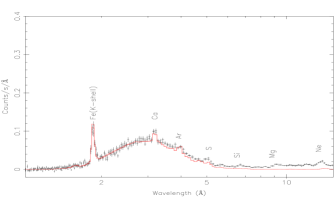
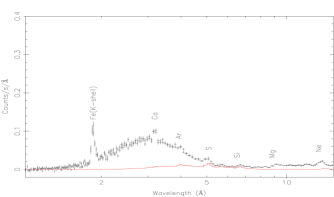
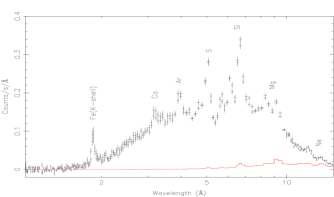
In Fig. 6 we compare the combined MOS and the combined RGS spectra with the model while in Fig. 7, we show the various contributions from the first three components of the best-fit model at both high and low state.
| (Å) | ion | flux | contribution (%) | ||||
| 1 | 2 | 3 | 4 | ||||
| 1.87 | Fe -k | 2.7 | 1.0 | 100 | 0 | 0 | 0 |
| 3.02 | Ca xx | 0.05 | – | 100 | 0 | 0 | 0 |
| 3.18 | Ca xix | 0.86 | 0.93 | 89 | 11 | 0 | 0 |
| 3.73 | Ar xviii | 0.23 | – | 100 | 0 | 0 | 0 |
| 3.95 | Ar xvii | 1.3 | 1.31 | 77 | 23 | 0 | 0 |
| 4.73 | S xvi | 1.6 | 0.94 | 97 | 3 | 0 | 0 |
| 5.05 | S xv | 5.9 | 1.08 | 41 | 59 | 0 | 0 |
| 5.68 | Si xiii | 0.95 | 0.63 | 11 | 89 | 0 | 0 |
| 6.18 | Si xiv | 2. | 0.93 | 61 | 39 | 0 | 0 |
| 6.68 | Si xiii | 8.0 | 1.15 | 8 | 92 | 0 | 0 |
| 8.42 | Mg xii | 3.1 | 0.65 | 7 | 93 | 0 | 0 |
| 9.23 | Mg xi | 2.2 | 1.27 | 1 | 95 | 4 | 0 |
| 10.24 | Ne x | 0.62 | 0.77 | 2 | 95 | 3 | 0 |
| 12.13 | Ne x | 1.1 | 1.14 | 0 | 91 | 9 | 0 |
| 13.60 | Ne ix | 0.60 | 1.33 | 0 | 12 | 75 | 13 |
| 15.01 | Fe xvii | 0.23 | 0.96 | 0 | 42 | 58 | 0 |
| 33.74 | C vi | 0.35 | 0.83 | 0 | 0 | 0 | 100 |
| 13.60 | Ne ix | 0.90 | 1.26 | 0 | 0 | 92 | 8 |
| 15.01 | Fe xvii | 0.29 | 0.69 | 0 | 0 | 100 | 0 |
| 18.97 | O viii | 0.38 | 0.47 | 0 | 0 | 72 | 28 |
| 21.80 | O vii | 0.22 | 1.10 | 0 | 0 | 11 | 89 |
| 33.74 | C vi | 0.21 | 1.33 | 0 | 0 | 0 | 100 |
-
: Observed fluxes from Tab. 2.
The resulting fit is quite satisfactory and confirms our previous interpretation that the low state spectrum is an absorbed version of the high state spectrum. Components 1 and 2 turn out to have the same temperature at high and low state but have a strongly increased absorption column at low state. As the interstellar column density is only 0.0081022 cm-2 (Stevens et al. 1996) most of the absorption must be due to circumstellar material. We conclude that the hot components 1 and 2 are deeply embedded in the WR wind at low state.
The soft and rather weak component 3 also suffers absorption but much less than components 1 and 2. This cool CIE component must lie further away from the WR star than components 1 and 2.
The observed spectrum in the wavelength region 20 Å ( 1 keV) is largely due to a cool, recombining plasma (component 4) which is unaffected by absorption. The low absorption indicates that it is emitted largely outside of any dense material of the WR wind.
5.3.1 Observed and predicted line fluxes
Using the best-fit parameters (cf. Tab. 4) and the absorption data by Morrison & McCammon (1983), we have calculated the predicted fluxes at Earth for a number of prominent lines (mainly of H- and He-like ions), together with the relative contributions from the three cie components and the recombination component (Tab. 5). The agreement between observed and calculated fluxes is quite satisfactory, except for the O viii line, which is a factor two larger than the observed one. The difference for this line could be reduced by a lower oxygen abundance in component 3.
We note that component 1 is dominant in the formation of the lines shortward of 5 Å, component 2 for the lines between 5 and 12 Å, whereas components 3 and 4 emit the lines at longer wavelengths. The Neon lines originate in components 2 and 3.


5.4 DEM modeling
Apart from multi- fitting, the X-ray spectrum was also fitted with a DEM-modeling procedure. We define the differential emission measure by (integrated over one logarithmic temperature bin = ). The method is based on a spectral description by means of a spline-method, and offers the possibility to obtain the differential emission measure distribution and the abundances, simultaneously and for different values. The resulting continuous DEM distribution is shown in Fig 8. The DEM results are consistent with those of the previous 3-T fitting and therefore, we do not give them explicitly in a table. The two narrow peaks in the EM distribution at high state are probably artefacts due to finite signal/noise and inaccuracies in the atomic data.
6 Discussion
6.1 Wolf-Rayet mass loss and wind clumping
The fact that the winds of Wolf-Rayet stars are clumped is now generally accepted and supported by a variety of observations (e.g., Hillier 2003). Single WR stars show random variability in their broad band flux, polarization and also in emission line profiles (e.g., Moffat et al. 1988, Robert et al. 1991, Lépine & Moffat 1999, Rodrigues & Magalhaes 2000; Lépine et al. 2000, Marchenko 2003, and references therein). These variations are most easily interpreted in terms of density enhancements in the wind. In the case of Vel, Lépine et al. (1999) reported emission line profile variations that can be attributed to WR wind inhomogeinities. Eversberg et al. (1999) concluded from their variability observations that the whole WR wind is affected by clumping and that the inhomogeinities propagate outward.
In classical WR atmosphere models, the effects of wind clumping and the mass loss rate are difficult to disentangle. Different combinations of the two can lead to equally good descriptions of the emission line profiles. It is thus useful to try and obtain independent information about e.g. the WR mass loss rates and then use this in conjunction with WR atmosphere models to pin down clumping more accurately.
Here we use the X-ray absorption to measure directly an absorption column which yields a mass loss rate of 810-6 /yr for the WC8 star in the system. This value is based on simple physics and does not depend on any clumping model. It depends linearly on the density. Our mass loss rate is in very good agreement with a value from polarimetric observations which yields 710-6 /yr (Schmutz et al. 1997, St.-Louis et al. 1988). This rate is based on a scattering model and is also proportional to the density. Other mass loss rates based on methods that are proportional to the density squared (line profile fitting, radio data) are higher, typically by a factor of four. Such methods are much more sensitive to clumping and if clumping is included, the mass loss rates become smaller. With our low mass loss rate from the X-ray absorption we add another independent piece of evidence for lower WR mass loss rates.
Although the observational evidence for clumping is clear, it is difficult to convert it into a physical model. A simple description in terms of a clumping factor was introduced by Schmutz (1997) and Hamann & Koesterke (1998). The clumping factor is defined as the ratio of the density in a clump to the density in a homogeneous model with the same mass loss rate. Line profile fitting that includes electron line wings provide values of typically 10 with, however, a large uncertainty such that values in the range 4 - 25 are possible (e.g., Morris et al. 2000). Our new mass loss rate in conjunction with a WR atmosphere model is much more sensitive and provides a clumping factor 16 for the WC8 star in Vel. If the interclump medium is assumed to be empty the volume filling factor is 0.06.
6.2 Modeling the X-ray emission
Our X-ray spectra in both, low and high state, can be described by three relatively hot cie components with a temperature range from about 0.25 to 1.6 keV, and a cold photo-ionized component with a WC star composition.
Comparing our spectral fitting results with those obtained for the high state by Skinner et al. (2001) with Chandra-hetgs and by Rauw et al. (2000) with ASCA, we find good agreement for temperatures, emission measures and column densities (see Tab. 4). For the intrinsic X-ray luminosity Skinner et al. (2001) obtained 7.81032 erg s-1 in the 0.4 - 10 keV band at the binary phase = 0.08, while Rauw et al. (2000) obtained 9.01032 erg s-1 in the 0.5 - 10 keV band. This is in reasonable agreement with our value of 1.51033 erg s-1 at high state. At low state, however, our fitting results are different from those obtained by Rauw et al. (2000), but this may be explained by the fact that fits of ASCA lines cannot accurately constrain the emission measure and column density of the second component.
6.2.1 Intrinsic X-ray emission from the binary stars?
We have compared our Vel results with a 2-component model of the O9.7Ib star Ori that was fitted to XMM-rgs data (Raassen et al. 2004). From the relatively low emission measures of Ori we expect that the ‘single-star’ contribution from the O-type component in Vel cannot play a significant role in the overall X-ray emission. Some contribution to the soft and relatively weak component 3 due to shocks in the wind of the O star can, however, not be excluded.
From the - relation for single O-type stars derived from ROSAT data (Berghöfer et al. 1997), we estimate a contribution to the intrinsic X-ray luminosity (in the 0.1 - 2.4 keV band) of about 1.21032 erg s-1 with an error of a factor of 2 - 3. In principle, this agrees with our fitting results for component 3.
Oskinova et al. (2003) gave for single WC stars upper limits to the X-ray luminosities of 0.025 - 0.32 1032 erg s-1 in the 0.2 - 10 keV band. They explained the apparent absence of X-rays from single WC stars by strong absorption in the stellar wind. Accordingly stellar wind shocks from the WC star appear not to contribute significantly to the observed X-ray luminosity in Vel.
6.3 Towards constraints for hydrodynamical models
For makers of hydrodynamical wind collision models, Vel is a interesting object because its easy observational access can potentially provide important constraints. The broadband X-ray light curve as observed with ROSAT (Willis et al. 1995) has already yielded information about the orientation and opening angle of the wind cavity behind the O star. A similar light-curve obtained with high spectral resolution will reveal the detailed geometric structure of the wind-wind collision zone. Already our observations taken at only two phases show that a low temperature component exists that must be much more extended than expected. A tomographic survey, covering a complete orbit will reveal the distribution of the X-ray luminous matter as well as the absorption column in various directions.
An observational quantity that is of particular interest to model makers is the elemental abundances. Here we report for the first time a neon abundance that is enhanced compared to solar. This demonstrates that the shocked material is at least partly from the WC star. Theoretically, it is expected that the WC material dominates the X-ray emission.
In this context it may be useful to re-evaluate the cooling parameters that characterize the wind-wind collision zones because orbital parameters and mass loss rates have recently been revised. The cooling parameter (Stevens, Blondin & Pollock 1992) is given by the ratio of the cooling and the dynamical time scale
| (10) |
where is the mass loss rate in [10-7 M⊙yr-1], is the distance from the star center to the contact discontinuity in [], and is the wind velocity in []. With the new lower mass loss rates for the clumped WR wind (which is similar to the one derived in this paper) and the O-type component from De Marco et al. (2000), the value of turns out to be 1 for the shocked WC material and 40 for the shocked O star material. In terms of this parameter, the shocked O-type star wind can be considered adiabatic, while for the shocked WC wind radiative cooling begins to be important.
For an adiabatic wind-wind collision, the ratio of the X-ray luminosities emitted by the shocked winds is
| (11) |
With the observed terminal wind velocities of the O and the WC star of = 2500 and 1450 km s-1, respectively, this luminosity ratio is 3.3. The X-ray emission is expected to be dominated by shocked WC material and should reflect the abundance pattern of the WC star. If the observations would show a significant contribution from material with solar abundance (i.e. from the O star), this could be caused by a slower O star wind because e.g. the O star material can not reach the terminal velocity before it is entering the collision zone (e.g. Pittard & Stevens 1997 and references therein).
6.4 On the interpretation of the C vi and C v recombination features
The existence of narrow radiative recombination continuum features from hydrogen-like and helium-like carbon in the spectrum of Vel implies that highly ionized carbon is in the presence of cold electrons, and is recombining with them.
The most obvious explanation for this is that some part of the WR wind is being photoionized by the hard X-ray emission from the colliding wind shock.
The ionization parameter expected in the WR wind can be computed by approximating the X-ray emission as a point source at the wind collision point colinear with the two stars. If the wind is smooth,
The ionization parameter is
where is the distance from the colliding wind shock apex. We also make use of the notation , where is almost one at radii more than a few . The midplane is defined to be the plane which is equidistant from the WR star and the shock. At midplane,
or log (taking , , , and ).
The ionization parameter in the WR wind should be within a factor of 3 of throughout most of the volume. Close to the WR star it will be lower due to the higher densities, but we are not able to see that region due to photoelectric absorption. Close to the shock, the ionization parameter will be higher, but this is a relatively small amount of material. For a more detailed treatment of the geometrical dependence of the ionization parameter, see Hatchett & McCray (1977), Liedahl & Paerels (1996), and Sako et al. (1999). These deal with the photoionized winds of high mass X-ray binaries, but the mathematical description is similar.
The value of we calculate at the midplane for a smooth wind is three orders of magnitude smaller than the value required to completely strip carbon and allow us to observe C vi emission (). In addition to this, we know that the C vi emission does not appear to be phase variable, at least at the two phases we observed. Taken together, this implies that if the recombination emission comes from the photoionized WR wind, it comes from far out, and in a very rarefied part. If this is the case, then the C v and C vi emission is coming from the interclump medium, which is highly rarefied compared to the density expected for a smooth wind. This is certainly plausible considering the degree of clumping which is known to be present in WR winds in general, and the clumping we infer in the wind of Vel.
The other possible explanation is that the hot plasma created in the colliding wind shock stops cooling radiatively at some point before carbon recombines (presumably the density is falling off pretty fast, and adiabatic cooling should become more important at some point), and the highly ionized carbon ions are either mixed with cool electrons in the WR wind further out in the flow, or the adiabatic cooling allows the electrons in the colliding wind flow to become cool enough to reproduce the observed effect when they do eventually recombine.
One other important piece of information comes from the rest of the spectrum. We see emission from Ne ix, Fe xvii, O viii and O vii which we believe comes from material far out in the post-collision flow, mainly because these lines have the same strength at both phases observed, but also because the absorbing column must be very low for us to see these lines at all. We would expect to see some kind of emission from C vi and C v from this same material, because it must cool to the ambient temperature of the wind eventually, unless the emission occurs at a radius where the WR wind is still optically thick at about . Even if mechanisms other than radiative cooling are important, the fully stripped carbon atoms created in the colliding wind shock must recombine eventually, and when they do they must emit one X-ray photon per atom per electron added. However, the continuum optical depth (mainly from C iv in the cool WR wind) is higher for C vi emission than for Ne ix, so it is possible that C vi emission in the post-shock flow would be absorbed.
If we believe that the observed carbon emission is just from the cooler parts of the post-collision flow, we should ask why we see different emission mechanisms at work in the case of carbon as opposed to neon, iron and oxygen. The observed line ratios are Ne ix is consistent with what one would expect in a hot, collisionally ionized plasma. The statistics for Fe xvii and Fe xviii and O vii and O viii are relatively poor, and it is not impossible that O vii and O viii RRCs are present in the spectrum and are merely blended with the iron L-shell emission. Clearly at some point, the cooling of the post-shock flow switches from primarily radiative to primarily adiabatic, but it is not clear whether this can account for the recombining C vi and C v.
7 Summary and Conclusions
High-resolution X-ray spectra obtained at different orbital phases provide a wealth of information about Vel. Modeling the X-ray emission constrains the physical structure of the wind-wind collision zone, whereas the absorption observed at non-maximum phases gives indications about the geometric distribution of the emitting as well as the non-emitting material. Both, emission and absorption are important and reveal different but linked aspects of the Vel system. It is indeed likely that a comprehensive tomographic analysis using X-ray spectra taken at many more orbital phases will allow a detailed mapping of the colliding wind region as well as of the ambient material. In particular, the hypothesis of a constant clumping factor around the orbit could be tested.
7.1 WR mass loss and wind clumping
Phase dependent X-ray emission from Vel can be used to analyze the Wolf-Rayet wind. In order to quantitatively interpret the absorption at low state, we apply a previously published WR model atmosphere with a smooth density distribution (De Marco et al 2000). This model atmosphere is the result from a fit to the broad WR emission lines. The column density required by the observed X-ray absorption is a factor of 4 lower than what is predicted by this model. The mass loss rate that matches the X-ray absorption is correspondingly smaller. We conclude that the WC8 star in Vel loses mass at a rate of only 810-6 /yr.
The discrepancy between our directly measured mass loss rate and the one required by the model atmosphere can be reconciled if the wind is clumped. In order to still fit the WR emission line spectrum with the reduced mass loss a clumping factor f = 16 is required.
7.2 Size of line emitting regions
The observed absorption behaviour also constrains the geometry of the X-ray line emitting region. It is very interesting that in our spectra the separation between absorption and no absorption is quite sharp. While the Ne ix lines remain unabsorbed the Ne x lines are reduced by a factor of 5 (see Tab. 2). In terms of temperature this means that the plasma hotter than 5 MK is heavily absorbed at phase 0.37 while the cooler plasma is not. This is also reflected in our emission model in which the components 1 and 2 with temperatures of 8 and 19 MK are strongly absorbed whereas component 3 with a temperature of 3 MK is only weakly absorbed. We conclude that components 1 and 2 are formed in the central part of the colliding winds which is deeply embedded in the WR wind. The cool (3 MK) component is clearly detached from this hot region (see Fig. 9).
Furthermore, the Ne ix lines that predominantly come from this region are not affected by the UV radiation of the O star. They either are formed far away from the O star or they are shielded from that UV radiation by intervening material. In either case, the O star is not likely to contribute much to them and we conclude that firstly, this component is associated with the colliding winds and secondly that this region must be rather extended for it to still be well detectable at phase 0.37.
7.3 Neon abundance
A further interesting piece of evidence comes from the neon abundance we derive. Neon is considerably enriched through nuclear processing in WC stars and therefore differs significantly from solar abundance. Neon is in fact the only element that emits copious line radiation from the collisionally ionized region, and that allows to discriminate between WC and solar composition. We find a clear Neon enhancement compared to solar which indicates that Wolf-Rayet material is present at least in components 2 and 3.
It is noteworthy that much of what we learn about the collision zone actually comes from the Ne ix and Ne x lines. Apart from discriminating between WC and solar abundance patterns they also provide a dividing line between absorption and no absorption at phase 0.37. These lines seem to hold the key for further progress and their behaviour at other phases should certainly be very interesting to follow.
7.4 X-ray emission variability
An interesting feature of our X-ray spectra is the high energy end. The section above 4.5 keV is little affected by intrinsic absorption and interestingly there is no observable difference between the two phases. In particular the highest temperatures in the wind-wind collision zone seem to be the same at both phases. This is remarkable because the binary separation has changed from 0.83 AU at phase 0.12 to 1.27 AU at phase 0.37. From a simple 1/D law one would expect a 50% flux reduction (see e.g., Stevens et al. 1992). This confirms the result of Rauw et al. (2000) that Vel does not follow a 1/D distance relation. The X-ray flux and temperature from the hottest plasma as detected by XMM-Newton is not affected by the orbital separation.
7.5 Recombining plasma
Apart from the shock excited components we also find a recombining plasma. The relation (if any) between this fourth component to the shocked material is not clear. The recombining plasma is highly ionized and is not absorbed at phase 0.37. It therefore comes from far out in the binary system. We also know that it is of very low temperature of about 40 000 K and that it is of WC composition. Possibly this plasma is due to photoionization through the X-rays from the wind-wind collision region. This radiation propagates through the rarefied and warped cavity behind the O star and irradiates the higher regions of the WR wind. There it may re-ionize some of the material.
Acknowledgements.
We would like to thank R. Walder and H.M. Schmid for fruitful discussions. The SRON National Institute for Space Research is supported financially by NWO. M.A. and M.G. acknowledge support from the Swiss National Science Foundation (fellowship 81EZ-67388 & grant 2000-058827). M.A. and M.A.L. acknowledge support by a grant from NASA to Columbia University for XMM-Newton mission support and data analysis.References
- (1) Anders, E., & Grevesse, N. 1989, Geochimica et Cosmochimica Acta, 53, 197
- (2) Berghöfer, T.W., Schmitt, J.H.M.M., Danner, R., & Cassinelli, J.P. 1997, A&A (Letters), 322, 167
- (3) Blumenthal, G.R., Drake, G.W.F., Tucker, W.H. 1972, ApJ, 172, 205
- (4) Cassinelli, J.P., Miller, N.A., Waldron, W.L., Macfarlane, J.J., Cohen D.H. 2001, ApJ (Letters), 554 L55
- (5) Corcoran, M.F. 2003, in: K.A. van der Hucht, A. Herrero & C. Esteban (eds.), A Massive Star Odyssey, from Main Sequence to Supernova, Proc. IAU Symp. No. 212 (San Francisco: ASP), p. 130
- (6) De Marco, O., & Schmutz, W. 1999, A&A, 345, 163
- (7) De Marco, O., Schmutz, W., Crowther, P. A., Hillier, D. J., Dessart, L., de Koter, A., & Schweickhardt, J. 2000, A&A, 358, 187
- (8) den Herder, J.W., Brinkman, A.C., Kahn, S.M., et al. 2001, A&A (Letters), 365, L7
- (9) Dessart, L., Crowther, P.A., Hillier, D.J., et al., 2000, MNRAS, 315, 407
- (10) Dumm, T., Güdel, M., Schmutz, W., Audard, M., Schild, H., Leutenegger, M., van der Hucht, K.A., 2003, in New Visions of the X-ray Universe in the XMM-Newton and Chandra era, ESA SP-488, in press
- (11) Eenens, P.R.J., & Williams, P.M. 1994, MNRAS, 269, 1082
- (12) Eversberg, T., Moffat, A.F.J., Marchenko, S.V. 1999, PASP, 111, 861
- (13) Grevesse, N., & Sauval, A.J. 1998, in: C. Fröhlich, M.C.E. Huber, S.K. Solanki & R. von Steiger (eds.), Solar Composition and its Evolution – From Core to Corona, Space Sci. Rev., 85, 161
- (14) Grevesse, N., & Sauval, A.J. 1999, A&A, 347, 348
- (15) Hamann, W.R., & Koesterke, L. 1998, A&A, 335, 1003
- Hatchett & McCray (1977) Hatchett, S., & McCray, R. 1977, ApJ, 211, 552
- (17) Hillier, D.J. 2003, in: K.A. van der Hucht, A. Herrero & C. Esteban (eds.), A Massive Star Odyssey, from Main Sequence to Supernova, Proc. IAU Symp. No. 212 (San Francisco: ASP), p. 70
- (18) van der Hucht, K.A., Cassinelli, J.P., & Williams, P.M. 1986, A&A, 168, 111
- (19) van der Hucht, K.A., Schrijver, H., Stenholm, B., Lundstrom, I., Moffat, A.F.J., Marchenko, S.V., Seggewiss, W., Setia Gunawan, D.Y.A., Sutantyo, W., van den Heuvel, E.P.J., de Cuyper, J.-P., & Gomez, A.E. 1997, New Astronomy, 2, 245
- (20) van der Hucht, K.A. 2001, New Astronomy Reviews, 45, 135 (VIIth WR Catalogue)
- (21) van der Hucht, K.A. 2002, in: F. Giovanelli & L. Sabau-Graziati (eds.), Multifrequency Behaviour of High Energy Cosmic Sources, Proc. Frascati Workshop 2001, Vulcano (Italia) 21-26 May 2001, Mem. Soc. Astron. Italia73, No. 4, 822
- (22) Hummel, C.A., White, N.M., Elias, N.M., Hajian, A.R., & Nordgren, T.E. 2000, ApJL 540, L91
- (23) Jansen, F., Lumb, D.H., Altieri, B., et al. 2001, A&A (Letters), 365, L1
- (24) Kaastra, J.S., Mewe, R., & Nieuwenhuijzen, H. 1996, in: K. Yamashita & T. Watanabe (eds.), UV and X-ray Spectroscopy of Astrophysical and Laboratory Plasmas (Tokyo: Universal Academy Press, Inc.), p. 411 (spex)
- (25) Kahn, S.M., Leutenegger, M.A., Cottam, J., Rauw, G., Vreux, J.-M., den Boggende, A.J.F., Mewe, R., & Güdel, M. 2001, A&A (Letters), 365, L312
- (26) Lanz, T., Hubeny, I. 2003, ApJS146, 417
- (27) Lépine, S., Moffat, A.F.J. 1999, ApJ, 514, 909
- (28) Lépine, S., Eversberg, T., & Moffat, A.F.J. 1999, AJ, 117, 1441
- (29) Lépine, S., Moffat, A.J.M, St-Louis, N., Marchenko, S.V., Dalton, M.J., Crowther, P.A., Smith, L.J., Willis, A.J., Antokhin, I.I & Tovmassian, G.H. 2000, AJ, 120, 3201
- Liedahl & Paerels (1996) Liedahl, D. A., & Paerels, F. B. S. 1996, ApJ, 468, L33
- (31) Marchenko, S.V. 2003, in: K.A. van der Hucht, A. Herrero & C. Esteban (eds.), A Massive Star Odyssey, from Main Sequence to Supernova, Proc. IAU Symp. No. 212 (San Francisco: ASP), p. 296
- (32) Mewe, R., Gronenschild, E.H.B.M., & van den Oord, G.H.J. 1985, A&AS, 62, 197 (mekal)
- (33) Mewe, R., Kaastra, J.S., & Liedahl, D.A. 1995, Legacy 6, 16 (mekal)
- (34) Miller, N.A., Cassinelli, J.P., Waldron, W.L., Macfarlane, J.J., Cohen, D.H. 2002, ApJ, 577 951
- (35) Moffat, A.F.J., Drissen, L, Lamontagne, R., Robert, C. 1988, ApJ, 334, 1038
- (36) Moffat, A.F.J., Paquin, G., Lamontagne, R., Vogt, N., & Barrera, L.H. 1986, AJ, 91, 1386
- (37) Morris, P.W., van der Hucht, K.A., Crowther, P.A., Hillier, D.J., Dessart, L., Williams, P.M., & Willis, A.J. 2000, A&A, 353, 624
- (38) Morrison, R., & McCammon, D. 1983, ApJ, 270, 119
- (39) Niemela, V.S., & Sahade, J. 1980, ApJ, 238, 244
- (40) Oskinova, L.M., Ignace, R., Hamann, W.-R., Pollock, A.M.T., & Brown, J.C. 2003, A&A, 402, 755
- (41) Pike, C.D., Stickland, D.J., & Willis, A.J. 1983, Observatory, 103, 154
- (42) Pittard, J.M., & Stevens, I.R. 1997, MNRAS, 292, 298
- (43) Pollock, A.M.T. 1987, ApJ, 320, 283
- (44) Raassen, A.J.J., Mewe, R., Pollock, A.M.T., van der Hucht, K.A., Cassinelli, J.P., Miller, N.A., Güdel, M., Audard, M., Leutenegger, M.A. 2004, in preparation
- (45) Rauw, G., Stevens, I.R., Pittard, J.M. & Corcoran, M.F. 2000, MNRAS, 316, 129
- (46) Robert, C., Moffat, A.F.J., & Seggewiss, W. 1991, in: K.A. van der Hucht & B. Hidayat (eds.), Wolf-Rayet Stars and Interrelations with Other Massive Stars in Galaxies, Proc. IAU Symp. No. 143 (Dordrecht: Kluwer), p. 147
- (47) Rodrigues, C.V., & Magalhaes, A.M. 2000, ApJ, 540, 412
- Sako et al. (1999) Sako, M., Liedahl, D.A., Kahn, S.M., & Paerels, F. 1999, ApJ, 525, 921
- (49) Schaerer, D., Schmutz, W., & Grenon, M. 1997, ApJ, 484, 153
- (50) Schmutz, W. 1997, A&A, 321, 268
- (51) Schmutz, W., Schweickhardt, J., Stahl, O., Wolf, B., Dumm, T., Gang, Th., Jankovics, I., Kaufer, A., Lehmann, H., Mandel, H., Peitz, J., & Rivinius, Th. 1997, A&A, 328, 219
- (52) Schulz, N. S., Canizares, C. R., Huenemoerder, D., Lee, J. C. 2000, ApJ (Letters), 545 L135
- (53) Skinner, S.L., Güdel, M., Schmutz, W., & Stevens, I.R. 2001, ApJ (Letters), 558, L113
- (54) Stevens, I.R., Blondin, J.M., & Pollock, A.M.T. 1992, ApJ, 386, 265
- (55) Stevens, I.R., Corcoran, M.F., Willis, A.J., Skinner, S.L., Pollock, A.M.T., Nagase, F., & Koyama, K. 1996, MNRAS, 283, 589
- (56) Stickland, D.J., & Lloyd, C. 1990, Observatory, 110, 1
- (57) St.-Louis, N., Moffat, A.J.M., Drissen, L., Bastien, P., Robert, C., 1988, ApJ, 330, 286
- (58) Strüder, L., Briel, U.G., Dennerl, K., et al. 2001, A&A (Letters), 365, L18
- (59) Turner, M.J.L., Abbey, A., Arnaud, M., et al. 2001, A&A (Letters), 365, L27
- (60) Usov, V.V. 1992, ApJ, 389, 635
- (61) Verner, D.A., & Yakovlev D.G. 1995, A&AS, 109, 125
- (62) Walborn, N.R. 1980 ApJS, 44, 535
- (63) Waldron, W.L., Cassinelli, J.P. 2001, ApJ (Letters), 548 L45
- (64) White, R.L., & Long, K.S. 1986, ApJ, 310, 832
- (65) Willis, A.J., Schild, H., & Stevens, I.R. 1995, A&A, 298, 549