eurm10 \checkfontmsam10 \pagerange1–8
Black Hole Masses from Reverberation Measurements
Abstract
We have reanalyzed in a consistent way existing reverberation data for 35 AGNs for the purpose of refining the black hole masses derived from these data. We find that the precision (or random component of the error) of reverberation-based black hole mass measurements is typically around 30%, comparable to the precision attained in measurement of black hole masses in quiescent galaxies by gas or stellar dynamical methods. As discussed in this volume by Onken et al., we have established an absolute calibration for AGN reverberation-based masses by assuming that AGNs and quiescent galaxies follow an identical relationship between black hole mass and host-galaxy bulge velocity dispersion. The scatter around this relationship implies that the typical systematic uncertainties in reverberation-based black hole masses are smaller than a factor of three. We present a preliminary version of a mass–luminosity relationship that is much better defined than any previous attempt. Scatter about the mass–luminosity relationship for these AGNs appears to be real and could be correlated with either Eddington ratio or source inclination.
in Galactic Nuclei††editors: Th. Storchi Bergmann, L.C. Ho & H.R. Schmitt, eds.
1 Introduction
While black holes have been invoked since the early days of quasar research as the principal ingredient in AGNs, it is only within the last several years that it has become possible to measure the masses of the central objects in galactic nuclei. At the present time, there has not yet been a definitive detection of the relativistic effects that would be required for unambiguous identification of a singularity, although studies of the Fe K emission line in the X-ray spectra of AGNs currently afford some promise (e.g., Reynolds & Nowak 2002). However, it seems to be true that the centers of both active and quiescent galaxies host supermassive objects that must be so compact that other alternatives are very unlikely.
Black hole masses are measured in a number of ways. In Type 1 active galaxies, reverberation mapping (hereafter RM; Blandford & McKee 1982; Peterson 1993) of the broad-line region (BLR) can be used to determine the central masses. RM is the only method of black hole mass measurement that does not depend on high angular resolution, so it is of special interest as it is extendable in principle to both very high and very low luminosities and to objects at great distances. Moreover, RM studies reveal the existence of simple scaling relationships that can be used to anchor secondary methods of mass measurement, thus making it possible to provide estimates of the masses of large samples of quasars, including even very distant quasars, based on relatively simple spectral measurements (e.g., Vestergaard 2002, 2004; McLure & Jarvis 2002).
The evidence that RM-based black hole masses are valid is twofold:
-
1.
There is an anticorrelation between emission-line time lag , which measures the size of the line-emitting region by light-travel time, and emission-line width that is consistent with the virial prediction . Relative to lower ionization lines, higher ionization lines are both broader and closer to the central source, consistent with ionization stratification of the BLR and dynamics that are dominated by a central mass (Peterson & Wandel 1999, 2000; Onken & Peterson 2002; Kollatschny 2003).
-
2.
There is a relationship (Gebhardt et al. 2000b; Ferrarese et al. 2001) between the RM-based black hole masses and the host galaxy stellar velocity dispersion similar to that seen in quiescent galaxies (Ferrarese & Merritt 2000; Gebhardt et al. 2000a).
A difficulty with the existing RM database is the lack of uniformity in how the measurements have been made. This leads to considerable scatter in many of the relationships among various AGN properties. We have therefore undertaken a complete reanalysis of existing RM data with two goals in mind:
-
1.
In order to improve the precision (i.e., reduce the random errors) of AGN black hole mass measurements, we reanalyzed all of the readily available RM data to determine the best measures of time lag and line width for these studies.
-
2.
In order to improve the accuracy (i.e., reduce the systematic errors) of AGN black hole mass measurements, we obtained high-precision measurements of to determine the relationship for AGNs. This is the subject of a companion paper (Onken et al., this volume), which we will draw on for the absolute calibration of the RM-based black hole mass scale.
The results of this program are described in detail by Peterson et al. (2004), Onken et al. (2004), and Kaspi et al. (2004) and are intended to supersede previous compliations of AGN black hole masses by Wandel, Peterson, & Malkan (1999) and Kaspi et al. (2000).
2 Results of the Reanalysis
Goals of our program to improve the precision of RM-based black hole masses have been (1) to improve and homogenize cross-correlation results by employing the most up-to-date measurement and error analysis software, and (2) to determine empirically the best measures of time delay and line width in measurement of the central masses. We considered 117 independent time series on 35 separate AGNs. Our basic conclusions are:
-
1.
For line-width measurement, it is important to measure the width of the variable part of the emission line. Our preferred method is to construct a root-mean-square (rms) spectrum from the many spectra produced in the monitoring campaign as the rms spectrum automatically includes only the variable part of the emission line. Use of the mean spectrum (or a single spectrum) is also possible, provided that contaminants, most importantly the non-variable narrow emission-line components, are effectively removed.
-
2.
For time lag measurements, we considered both the centroid and peak of the continuum/emission-line cross-correlation function (CCF), and for the line width measurements, we considered both FWHM and line dispersion (i.e., second moment of the line profile). While all of these measures are acceptable, the highest precision in virial masses is attained by using the CCF centroid and the line dispersion to form the virial product .
Using these measures, we find that the precision of RM-based black hole mass measurements is typically about 30%.
The masses of the central black holes are given by
| (1) |
where is a factor of order unity that depends on the structure, kinematics, and aspect of the BLR. As described by Onken et al. in this volume, the scaling factor can be empirically determined by assuming that AGNs and quiescent galaxies follow the same relationship. This assumption leads to . The scatter around the correctly scaled AGN relationship is about a factor of about 2.8, which thus represents the typical accuracy of RM-based mass measurements. It is important to keep in mind that this level of accuracy is statistical in nature and individual black hole masses may be less accurate. While the limited scatter in the AGN relationship is reassuring, additional tests of the efficacy of black hole mass measurement by RM remain highly desirable.
3 The AGN Mass–Luminosity Relationship
Our improved black hole masses lead to the AGN mass–luminosity relationship shown in Fig. 1. We have also estimated the bolometric luminosity in the same fashion as Kaspi et al. (2000), i.e., , and this scale is shown on the upper axis of Fig. 1. The diagonal lines show the Eddington limit, and 10% and 1% its value. None of the sources in Fig. 1 exceed the Eddington limit, though of course we caution that the bolometric correction we used is nominal and may not apply equally well to all AGNs. Furthermore, the optical luminosities used here have not been corrected for the contribution of starlight from the host galaxies — this can be a significant factor, especially in the lower-luminosity sources. Similary, no correction for internal extinction has been attempted.
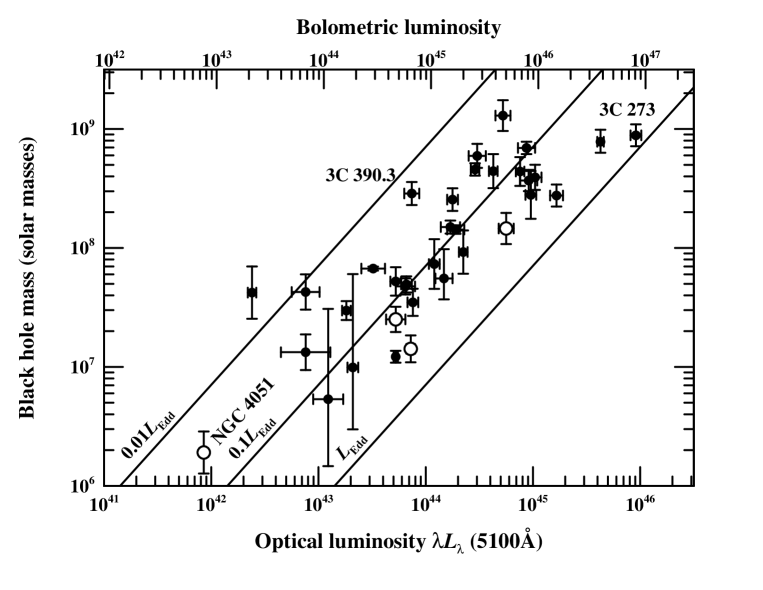
Given the small formal error bars for most of the sources, much of the scatter in Fig. 1 appears to be real. Interestingly, the scatter correlates with other AGN properties; the narrow-line Seyfert 1 galaxies (NLS1s) are shown as open circles, and all of them except NGC 4051 lie on the lower edge of the mass–luminosity envelope, along with several PG quasars with I Zw 1-type spectral characteristics. Conversely, the one reverberation-mapped object with strongly double-peaked Balmer line profiles, 3C 390.3, lies along the upper edge of the envelope. The locations of these extreme objects on this diagram suggest that at least some of the dispersion of the data points correlates with Eigenvector 1, consistent with the suggestion originated by Boroson & Green (1992) and reaffirmed by numerous later investigators that Eigenvector 1 appears to be driven by Eddington ratio . However, the physical origin of the scatter observed in Fig. 1 could be attributable either to differences in Eddington ratio or to inclination effects, or most likely some combination of both of these effects. Decreasing inclination (i.e., from edge-on to face-on) will translate points to the right as the apparent luminosity increases on account of decreased limb darkening and downward as the line-of-sight projection of the rotational velocities appear to decrease. Increasing the Eddington ratio will translate points in the same sense.
The best-fit slope to the relationship yields . However, there is no reason to believe that there are no selection effects operating. Indeed, the extreme objects 3C 273 and NGC 4051 certainly tend to make the relationship flatter than it would be otherwise. Interestingly, the lower edge of the envelope seems to parallel the lines of constant Eddingtion ratio rather well, suggesting that the intrinsic mass–luminosity slope may not differ signficantly from unity.
4 Some Remarks
4.1 On Black Hole Masses
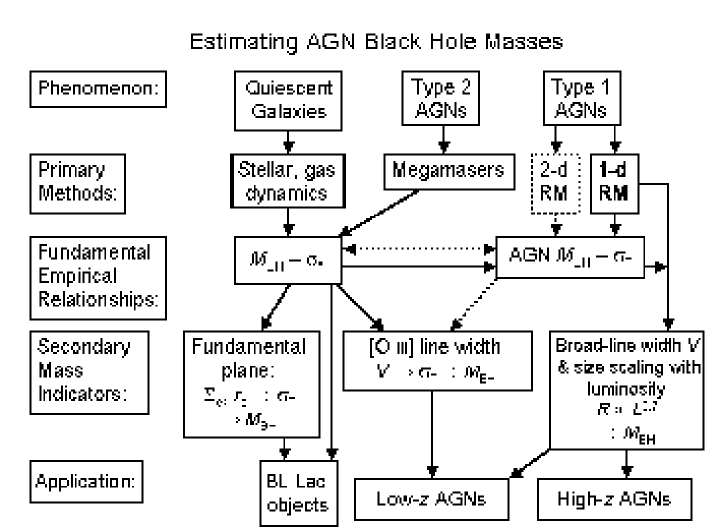
In Figure 2, we summarize the methods used in measuring the masses of black holes in galactic nuclei in an attempt to clarify the role of RM. “One-dimensional (1-d) RM” refers to measurement of only mean time lags for emission lines, as we have described here. Absolute calibration of this method relies on the assumption that the relationship is the same for both active and quiescent galaxies. “Two-dimensional (2-d) RM,” on the other hand, yields a unique velocity–time delay map that reveals the geometry and kinematics of the BLR, thus leading to an independent high-accuracy measurement of the black hole mass. Unfortunately, on account of the demanding data requirements (e.g., Horne et al. 2004; Peterson & Horne 2004), this has not yet been accomplished. The primary methods of black hole mass measurement lead to empirical relationships among properties that can be used as relatively easy-to-observe surrogates for quantities that are difficult to measure. In the case of quiescent galaxies, the value of the stellar surface brightness at the effective radius can be used to infer through the fundamental plane relationship, and then the black hole mass can be inferred through the relationship. In the case of active galaxies, the narrow [O iii] line width can be used as a surrogate for (the author confesses to deep reservations about this assumption, though practitioners clearly note the potential problems). Another widely employed method makes use of the correlation between BLR radius and AGN luminosity (e.g., Kaspi et al. 2000). This method is especially attractive since a single spectrum of only modest spectral resolution and quality can yield a luminosity (from which one infers a BLR radius) and a line width, which can be combined for a mass estimate. This method is already widely employed in estimating black hole masses in large samples of AGNs, though it is clear that more work must be done on the basic calibrations to understand the uncertainties more quantitatively.
4.2 On Future Work
Based on the existing database, we are continuing investigation of a number of issues, notably:
-
1.
Refinement of the BLR radius–luminosity relationship (cf. Kaspi et al. 2000). A key element here is that the luminosity measures are affected by the starlight contribution from the host galaxy, and this is particularly important at the low-luminosity end. We are currently obtaining Hubble Space Telescope (HST) images of the lower-luminosity reverberation-mapped AGNs in order to model the nuclear surface brightness distributions of the starlight and thus correct the luminosities used in both the radius–luminosity and mass–luminosity relationships.
-
2.
Direct comparison of RM and stellar dynamical mass measurements. Of all the reverberation-mapped AGNs, only NGC 3227 and NGC 4151 might be expected to have a black hole radius of influence that is spatially resolvable with HST. These two AGNs are thus good candidates for measuring their black hole masses by stellar dynamical methods. A serious problem is that the AGN nuclear light swamps the stellar light, making the stellar absorption features difficult to detect. We have attempted to mitigate this problem by obtaining HST STIS spectra of the Ca ii triplet in the nucleus of NGC 4151 while the active nucleus was in a faint state in 2003 December. We are now attempting to model the centeral stellar dynamics from these data, and thus effect for the first time a direct comparison between the RM and stellar dynamical methods of black hole mass measurement. This is proving to be an extremely challenging program.
-
3.
Determine the kinematics and structure of the BLR via RM. Reverberation mapping still offers the best promise for understanding the BLR and understanding the potential systematic errors in RM-based black hole masses. It is a technique that is still underutilized, primarily because it is resource intensive and moderately risky. However, the fact remains that we do not have one reliable velocity-delay map for any emission line in any AGN. Until we succeed in acquiring one, we will not be able to assess the full potential and practical merit of the technique.
Acknowledgements.
We are grateful for support of this work through NSF grant AST-0205964 to The Ohio State University.References
- [] Blandford, R.D., and McKee, C.F. 1982 ApJ, 255, 419
- [] Boroson, T.A., and Green, R.F. 1992 ApJS, 80, 109
- [] Ferrarese, L., and Merritt, D. 2000 ApJ, 539, L9
- [] Ferrarese, L., et al. 2001 ApJ, 555, L79
- [] Gebhardt, K., et al. 2000a ApJ, 539, L13
- [] Gebhardt, K., et al. 2000b ApJ, 543, L5
- [] Horne, K., Peterson, B.M., Collier, S., & Netzer, H. 2004, PASP, in press.
- [] Kaspi, S., et al. 2000 ApJ, 533, 631
- [] Kaspi, S., et al. 2004, to be submitted to ApJ
- [] Kollatschny, W. 2003 A&A, 407, 461
- [] McLure, R.J., & Jarvis, M.J. 2002 MNRAS, 337, 109
- [] Onken, C.A., & Peterson, B.M. 2002 ApJ, 572, 746
- [] Onken, C.A., et al. 2004, to be submitted to ApJ
- [] Peterson, B.M. 1993 PASP, 105, 247
- [] Peterson, B.M., & Horne, K. 2004 Astron. Nachr., 325, 248
- [] Peterson, B.M., & Wandel, A. 1999 ApJ, 521, L95
- [] Peterson, B.M., & Wandel, A. 2000 ApJ, 540, L13
- [] Peterson, B.M., et al. 2004, submitted to ApJ
- [] Reynolds, C.S., & Nowak, M.A. 2003 Physics Reports, 377, 389
- [] Vestergaard, M. 2002 ApJ, 571, 733
- [] Vestergaard, M. 2004 ApJ, 601, 676
- [] Wandel, A., Peterson, B.M., and Malkan, M.A. 1999 ApJ, 526, 579