Dynamical segregation of galaxies in groups and clusters
Abstract
We have performed a systematic analysis of the dynamics of different galaxy populations in galaxy groups from the 2dFGRS. For this purpose we have combined all the groups into a single system, where velocities and radius are expressed adimensionally. We have used several methods to compare the distributions of relative velocities of galaxies with respect to the group centre for samples selected according to their spectral type (as defined by Madgwick et al., 2002), band luminosity and colour index. We have found strong segregation effects: spectral type I objects show a statistically narrower velocity distribution than that of galaxies with a substantial star formation activity (type II-IV). Similarly, the same behavior is observed for galaxies with colour index compared to galaxies with . Bright () and faint () galaxies show the same segregation. It is not important once the sample is restricted to a given spectral type. These effects are particularly important in the central region () and do not have a strong dependence on the mass of the parent group. These trends show a strong correlation between the dynamics of galaxies in groups and star formation rate reflected both by spectral type and by colour index.
keywords:
methods: statistical – galaxies: clusters: general – galaxies: kinematics and dynamics – galaxies: evolution1 Introduction
Galaxy properties can be affected by several mechanisms in groups or clusters. The fact that different galaxies can be modified to a different extent, could give rise to observable segregational effects. By studying these effects, we may obtain valuable information on the way in which these mechanisms act on galaxies and drive their evolution.
The morphology density relation (Oelmer, 1974; Dressler, 1980; Andreon et al., 1996) is the best known segregational effect. Early type galaxies are more concentrated in denser regions, and lie closer to the centres of the clusters than late type galaxies. More recently, the clustering properties of galaxies have been found to be dependent on the characteristics of spectral features (Martínez et al., 2002; Domínguez et al., 2002; Biviano et al., 2002; Madgwick et al., 2003c), and luminosity (Benoist et al., 1996; Norberg et al., 2001, 2002; Stein, 1997; Adami et al., 1997; Girardi et al., 2003).
Several mechanisms have been proposed to explain galaxy transformations. Their relevance are quite different according to the environmental conditions (Balogh et al., 2004) and so, their importance depends on the mass of the clusters, and perhaps on the history of galaxy clustering (Gnedin, 2003b). Some effects are more effective in dense regions like rich clusters, whereas in groups of galaxies other mechanisms play the most important role.
Ram pressure (Gunn & Gott, 1972) can inhibit star formation by exhausting the gas present in galaxies that move fast in the intergalactic medium of rich clusters. Similarly, galaxy harassment (Moore et al., 1996) can produce significant changes in the star formation rate of a galaxy. These effects are not expected to be important in poor clusters or groups, where the velocity dispersion is lower, instead, effects such as mergers or tidal interactions can be dominant in these environments (Gnedin, 2003a).
Besides affecting galaxy properties, such as star formation, luminosity and colour index, some of the physical processes listed above may also produce changes on the dynamics of the galaxy with respect to the cluster centre. In turn, the efficiency of some of these mechanisms to produce significant changes on a galaxy, depends on its dynamical behavior. For example, the effects of galaxy interactions are stronger for galaxies moving slowly with respect to the cluster centre. This suggests that the dynamical properties of galaxies in groups and clusters may be related with the star formation efficiency, colours or luminosities of galaxies(Menci & Fusco-Femiano, 1996; Moore et al., 1998). Segregation effects of galaxy velocities in clusters are predicted theoretically (Menci & Fusco-Femiano, 1996; Gnedin, 2003b), in semi–analytical models (Menci et al., 2002), and has been reported in rich clusters (Sodré, 1989).
The relation between the dynamical properties and the luminosity of a galaxy has been observed in rich clusters, by e.g. Whitmore, Gilmore & Jones (1993); Adami et al. (1997) and Stein (1997), who find evidence for velocity segregation. In agreement with these findings, theoretical studies (Fusco-Femiano & Menci, 1998) and numerical simulations (Yepes et al., 1991) show similar trends.
However, it is not clear how to interpret these results. Some authors propose different orbit shapes for galaxies with different morphologies or luminosities. In this scheme, early–type galaxies have quasi–isotropic orbits, while late–type galaxies move in nearly radial orbits (Benoist et al., 1997; Adami et al., 1997). However, other models have been proposed that contradict this statement (Ramírez & de Souza, 1998).
Theoretical works predict virialized systems with a Maxwellian velocity distribution (Saslaw et al., 1990; Ueda, 1993) so it has been proposed that early and late-type galaxies have Gaussian velocity distributions. However, observations in rich clusters do not support these hypothesis (e.g. Colles & Dunn, 1996)
The purpose of this paper is to explore for a possible difference in the dynamical behavior of galaxies with different spectral types, luminosities and colour indexes. The outline of this paper is as follows. In section 2 we describe the data sample used in our work, and in section 3, the method used in our analysis. Section 4 presents the results of our search for velocity segregation in spectral type, luminosity and colour. Finally, in section 5 we present a discussion of our results and future perspectives.
2 The data

In order to analyse the dynamics of different galaxy populations in galaxy systems, we have carried out a systematic search for segregation effects of galaxies in velocity space. We have used a group catalogue constructed from the final version of the 2dF Galaxy Redshift Survey (Colles et al., 2001), using the same technique used by Merchán & Zandivarez (2002) to construct the group catalogue of the 2dFGRS 100K release (Folkes et al., 1999). This sample comprises 40978 galaxies in 5568 groups. Virial mass, velocity dispersion and virial radius have been determined for the groups in this sample.
Principal component analysis technique has been applied to all galaxies in the 2dFGRS by Madgwick et al. (2002). This technique allows to obtain the maximum possible spectral information with a minimum set of parameters, and so it offers a quantitative and efficient way to classify galaxies with a spectral index . This index has a clear physical interpretation, since it is strongly related to the galaxy morphology (Madgwick, 2003a), and correlates with the equivalent width of the H line and with the star birthrate parameter (Madgwick et al., 2003b). These spectral parameters measure the strength of absorption features by stars and ISM, and the strength of nebular emission features, making possible to obtain an idea of the relative contributions of different populations of stars. Negative values of correspond to non star-forming galaxies, usually early type galaxies, whereas large values imply star formation features in the integrated spectra, typical of late type galaxies. Madgwick et al. (2002) defined 4 spectral types based on the shape of the distribution of for galaxies in the 2dFGRS. Type I comprises all galaxies with ; type II, galaxies with ; type III, galaxies with and type IV all galaxies with .
The 2dFGRS also contains photometric information in the APM band and in the super-cosmos and bands. This is a useful tool to study the dependence of a possible velocity segregation on galaxy luminosity and colour. Absolute magnitudes are denoted , and . Distance dependent quantities are calculated using a Hubble parameter .
3 Analysis
| case | samples | restriction | |||||||
| Spectral type segregation | |||||||||
| 1 | vs. | all luminosities | all masses | 8985 | 2561 | ||||
| 2 | vs. | all luminosities | all masses | 8985 | 6066 | ||||
| 3 | vs. | all luminosities | all masses | 7234 | 1803 | ||||
| 4 | vs. | all luminosities | all masses | 7234 | 4250 | ||||
| 5 | vs. | all masses | 4086 | 603 | |||||
| 6 | vs. | all masses | 3148 | 1200 | |||||
| 7 | vs. | all luminosities | 2430 | 916 | |||||
| 8 | vs. | all luminosities | 4804 | 887 | |||||
| Luminosity segregation | |||||||||
| 9 | vs. | all types | all masses | 5770 | 5714 | ||||
| 10 | vs. | all types | all masses | 1669 | 1898 | ||||
| 11 | vs. | all masses | 4086 | 3148 | |||||
| 12 | vs. | all masses | 1684 | 2566 | |||||
| 13 | vs. | all masses | 603 | 1200 | |||||
| 14 | vs. | all types | 1841 | 2660 | |||||
| 15 | vs. | all types | 3929 | 3054 | |||||
| Colour index segregation | |||||||||
| 16 | vs. | all types & luminosities | all masses | 7291 | 4180 | ||||
| 17 | vs. | all types & luminosities | all masses | 1904 | 1663 | ||||
| 18 | vs. | all masses | 3583 | 3651 | |||||
| 19 | vs. | all masses | 805 | 998 | |||||
| 20 | vs. | all masses | 136 | 1666 | |||||
| 21 | vs. | all masses | 6361 | 866 | |||||
| 22 | vs. | all masses | 4121 | 1639 | |||||
| 23 | vs. | all masses | 3170 | 2541 | |||||
| 24 | vs. | all types & luminosities | 2341 | 2154 | |||||
| 25 | vs. | all types & luminosities | 4950 | 2026 | |||||
3.1 Ensemble group
In order to make a suitable analysis of the data, we have combined all the groups into a single system. In this ensemble, velocities and radius are expressed adimensionally. The line of sight velocities of each object , relative to the group average velocity, are scaled by the corresponding velocity dispersion of the host group. In a similar fashion, galaxy projected distance to the group centre are scaled by its virial radius value . This procedure allows for a simple and improved statistical treatment of the data and, assuming isotropy with respect to their centres, maintains spatial and dynamical properties of the ensemble groups. Similar procedures have been implemented e. g. by Adami et al. (1997); Stein (1997) and Ramírez & de Souza (1998).
The virial radius is estimated from the projected distances of members to the group centre (Merchán & Zandivarez, 2002). Uncertainties in these value, as well as in the determination of the centre of the system (derived by the unweighted mean of group member positions), can be larger for groups with few galaxies. Accordingly we have restricted all our analysis to groups with more than 10 members to reduce these uncertainties. In section 4.5 we analyse the reliability of our results related to this choice.
In order to explore the possible differences in the velocity distribution of galaxies between groups and clusters, we have divided the total sample of galaxies according to membership into low () and high () virial mass systems. In Fig. 1 we show the resulting velocity distribution functions where it can be appreciated that both sets present remarkably similar distributions. This fact allows us to perform the same treatment to all groups irrespective of their mass. We notice, however, that the shape of this distribution is influenced by uncertainties in galaxy redshift determinations in the 2dFGRS. The rms uncertainty is approximately 85 km/s (Colles et al., 2001). In section 4.5 we explore the effect of these uncertainties in our analysis.
3.2 Analysis of the ensemble group
Our analysis is based on the comparison of normalized velocity distributions of galaxies in different samples, selected by spectral type (), colour index (CI) or luminosity (quantified by ).
In order to test the presence of a difference in the dynamical behavior of two given samples of galaxies, we have adopted different procedures to deal with the velocity distribution functions . One of these methods is the Kolmogorov–Smirnov (KS) test (Press et al., 1986). In this method, it is possible to disprove, to a given level of significance, the null hypothesis that two distributions were taken from the same population distribution function.
We have calculated the difference between the values of the kurtosis of the two distribution functions. This parameter provides a useful characterisation of the velocity distributions since it is related to the relative fraction of galaxies with low velocity () in each subsample objectively.
We have also binned the velocities in , using 5 bins. The uncertainties in each bin have been determined using the bootstrap resampling technique. We defined a parameter as the difference between the first bins of each distribution. The uncertainty of is estimated by propagating individual errors for each bin.
We have constructed 1000 new samples drawn from the original data but reassigning spectral types, colour indexes or luminosities. The distributions of these parameters mimics the ones of the original observed sample. For each one of these random samples we have determined and . The resulting distributions of these parameters provide an estimate of the significance of the observed values in the real data, since these distributions can be used to calculate the probabilities and of obtaining, in the random samples, values of and greater than the observed ones. The resulting probabilities , and the KS significance are shown in Table 1.
As previously mentioned, we have resampled sets of data using the bootstrap technique in order to estimate the reliability of the results. Explicitly, for each pair of samples we have calculated the variance of and for the corresponding bootstrapped samples. This variance provides a reliable estimate of the uncertainties of the given parameter.
The large size of the data set has allowed us to explore the results for different subsamples of the data corresponding to different galaxy and group properties such as spectral types, luminosities, colour indexes, group centric distance and parent group virial mass. To achieve this goal we have applied the tests described above to the different subsamples.
4 results


4.1 Spectral type segregation

We have analysed the distribution functions of the relative velocities for subsamples of different spectral type index, with no further restriction in galaxy luminosity or colour index. Figure 2 shows the velocity distributions for type I and types III–IV galaxies, where the presence of a strong segregation can be clearly appreciated. The relative line of sight velocities of type I galaxies are statistically smaller than those of galaxies with a substantial star formation activity. To compute the statistical significance of the difference between these two distributions, we have applied the three tests described in the previous section. According to the KS test, we can disprove to a significance level greater than 99.9% that the two distributions are drawn from the same parent distribution. The distributions of the parameters and obtained for 1000 random realizations are shown in Fig. 3, the arrows indicate the values obtained for the real data.
According to these results, velocity segregation by spectral type is very significant statistically, corresponding to a fraction of of early type galaxies and of late type galaxies within the group mean velocity dispersion () with respect to the total number of galaxies in each subsample. These quantities may depend on the uncertainties on the determination of velocities, however, as is stated in section 4.5, this fact does not affect the observed trends.
Table 1 summarizes the results for spectral type segregation obtained by restricting the samples to a given galaxy luminosity and group centric distance, as well as different parent group virial mass. If we restrict our analysis to the inner region of the groups (), the segregation intensity is stronger, but it is similar for systems of different mass. These facts will be addressed in more detail in section 4.4
4.2 Luminosity segregation

We have searched for a possible velocity segregation by luminosity, by applying the same methods as in section 4.1. We find a significant difference of the normalized relative velocity distributions between bright and faint galaxies, as can be appreciated in Fig. 4. The luminosity cut adopted to define the two subsamples, , give a similar number of galaxies in both of them. We have also considered the central () region of the groups, where it can be seen that the velocity segregation by luminosity is stronger (see Table 1). This trend is similar to the observed behavior of the segregation by spectral type, which is stronger in denser environments (see section 4.1) and will be discussed in more detail in section 4.4.
Given the significant velocity segregation by spectral types, we have searched for luminosity segregation in subsamples restricted to type I and types III-IV galaxies. We find that the luminosity segregation signal is of less significance in these cases, indicating that luminosity is not a primary parameter in defining the dynamics of galaxies in groups. This suggests that early spectral type galaxies, on average more luminous than late types, could provide the observed dependence on luminosity.
4.3 Colour segregation
Using the same procedure we have also explored the relation between galaxy dynamics and colour index. We have considered the colour index provided in the 2dFGRS final data release for the galaxies in the group sample. Given the narrow range of redshifts in the group sample (), a unique threshold is suitable to define a sample of red galaxies.
The normalized velocity distributions for red () and blue () galaxies are shown in Fig. 5, where a significant velocity segregation of velocity according to galaxy colour index can be clearly appreciated. Given the correlation between colour index and spectral index , we have restricted our analysis to galaxies with low present star formation (type I), and strongly star forming galaxies (types III-IV). The results are shown in Table 1, and for type I objects in the small box of Fig. 5. As it can be appreciated, velocity segregation has a lower level of significance in the last case.
4.4 Dependence of segregation on global properties

In the previous section we have analysed the different dynamics of galaxies according to their intrinsic properties, namely spectral type, luminosity and colour index. Our results suggest that the segregation effects are stronger in denser environments although there is no indication of a strong dependence on the parent group mass. In this section we explore in more detail the dependence of our results on galaxy–group centric distance and parent group virial mass.
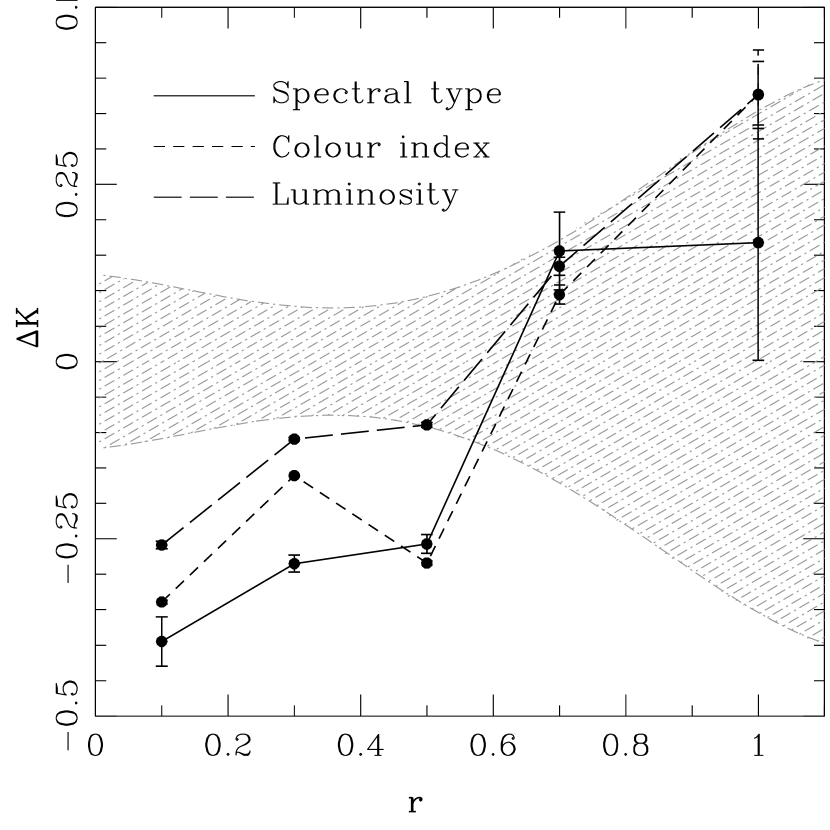
In Fig. 6 we show the dependence of the kurtosis differences on . The dashed region displays the rms of the distribution of obtained for the random samples described in section 3.2. It can be clearly appreciated that velocity segregation in the central regions () is particularly important for spectral type and colour index but smoothly decreases at larger group centric distances. In a similar fashion, we have analysed the dependence of velocity segregation on parent group virial mass. Our results for galaxies with are shown in Fig. 7. It can be appreciated that there is no strong dependence of the segregation effects on the mass of the parent group. This is an important fact suggesting that the mechanisms that generate the observed difference in the dynamics, according to the galaxy star formation activity, are efficient on a wide range of masses.
4.5 Analysis of uncertainties
The uncertainty in redshift determinations in the 2dFGRS amounts to a rms of (Colles et al., 2001). This is a quite large figure, so its effects on our statistical analysis deserves particular attention. To account for this uncertainty we have convolved each line of sight velocity measurement with a Gaussian with dispersion . The resulting smoothed histograms are suitable to compute the parameters characterizing the differences of the distribution of velocities of two given samples of galaxies taking into account line of sight velocity errors. As an example of this analysis, in Fig. 8 we show the results for case 3, where it can be appreciated that the binned and the smoothed distributions show the same behavior. Moreover we have computed the parameters and for the cases shown in Table 1, finding similar results which show the stability of our analysis against redshift measurements errors.
As a test of the stability of our results against the number of group members, we have also analysed a sub-sample of groups restricted to have at least 20 members. We obtain similar and even more prominent segregation effects for the same galaxy properties analysed previously. Also, in order to test the effects of possible erroneous determination of the centre of the groups in our results, we have repeated the analysis for re–centered groups. These new centres where calculated using only galaxies within 1.2 times the virial radius and 2.5 times the velocity dispersion, which would provide a better estimate of group centres for elongated or clumpy systems. Again here the results are similar and show that our conclusions are not strongly dependent on the group centre definition.
5 Discussion

We find a statistically significant difference of the distributions of group centric line of sight velocities, normalized to the group mean velocity dispersion, for samples of galaxies selected by spectral type, luminosity or colour index. Given the large data set analysed, we have been able to investigate the dependence of this velocity segregation on group properties and galaxy–group centric distance. Spectral type I objects, corresponding to passively star forming galaxies, show a statistically narrower velocity distribution than that of galaxies with a substantial star formation activity (types III-IV). Similarly, samples of galaxies with greater colour index () have a larger fraction of small velocities () compared to galaxies with . These two trends show a strong correlation between galaxy dynamics in groups and star formation, reflected both by spectral type and by colour index.
The velocity distribution of luminous galaxies (typically brighter than ) also show a larger fraction of small velocities, although we notice that once the galaxies are restricted to a given spectral type, there is a less significant segregation. Thus, luminosity is not likely to be a primary parameter determining galaxy dynamics in groups. Our results suggest that the observed luminosity segregation might be related to the fact that the slowest objects, of early spectral type, are on average more luminous than star forming galaxies.
There are several mechanisms that may produce dynamical segregations of galaxies in groups and clusters. Ram pressure can effectively remove the existing gas in the galaxies and transform star forming into passively star forming objects. This mechanism affects most strongly those galaxies with large velocities with respect to the intra–cluster medium, and then it should produce a dynamical segregation with opposite trends to the observed one. Moreover, since our analysis concerns groups and small clusters of galaxies, ram pressure is not expected to be significant. Our results indicates that the velocity segregation effects are nearly independent of group virial mass. This fact also suggests that ram pressure is not important since its effects are stronger in more massive systems, and with higher velocity dispersion. Thus, it is unlikely that ram pressure may explain the observed correlations.
Mergers on the other hand, are effective to generate spheroidal objects with a low star formation rate. Galaxy encounters are expected to lower the original cluster-centric relative velocities of each galaxy, with respect to the velocities of the galaxies prior to the merger event, so that they can act effectively in generating the observed trends.
In a similar fashion, tidal interactions may effectively remove a substantial amount of gas from disks of galaxies, and then, are also effective in truncating star formation. Early type objects generated through this mechanism, would be biased to smaller velocities since interactions are expected to be more effective in slow encounters. Furthermore, these are generally brighter and redder objects.
It has been suggested that morphological transformation of galaxies takes place in systems which have a density threshold larger than the density of groups and poor clusters of galaxies (Moore et al., 1996; Gray, 2004). Our results indicate that dynamical segregation of passively star forming galaxies is a generic feature of systems of galaxies, irrespective of global properties. However, the fact that segregation effectively occurs in the inner regions of groups indicates that density might be an important parameter in determining the observed effects.
Acknowledgments
This work was partially supported by the Concejo Nacional de Investigaciones Científicas y Tecnológicas (CONICET), the Secretaría de Ciencia y Técnica (UNC) and the Agencia Córdoba Ciencia.
References
- Adami et al. (1997) Adami C., Biviano A., Mazure A., 1997, A&A,331,439
- Andreon et al. (1996) Andreon S., 1996, A&A, 314, 763
- Balogh et al. (2004) Balogh M., Eke V., Miller C., Lewis I., Bower R., Couch W.,Nichol R., Bland-Hawthorn J., et al., 2004, MNRAS, 348, 1355
- Benoist et al. (1996) Benoist C., Maurogordato S., da Costa L. N., Cappi A., Schaeffer R., 1996, ApJ, 472, 452
- Benoist et al. (1997) Biviano, A., Katgert, P., Mazure, A., Moles, M., den Hartog, R., Perea, J., Focardi, P., 1997, A&A, 321, 84
- Biviano et al. (2002) Biviano A., Katgert P., Thomas T., Adami C., 2002, A&A, 387, 8
- Colles et al. (2001) Colles M. M. et al., 2001, MNRAS, 328, 1039
- Colless & Dunn (1996) Colles M., Dunn A. M., 1996, ApJ, 458, 435
- Dressler (1980) Dressler A., 1980, ApJ, 236, 351
- Domínguez et al. (2002) Domínguez M., Zandivarez A., Martínez H. J., Merchán M. E., Muriel H., Lambas D. G., 2002, MNRAS, 335, 825 ApJ, 236, 351
- Folkes et al. (1999) Folkes S., et al., 1999, MNRAS, 308, 459
- Fusco-Femiano & Menci (1998) Fusco-Femiano R., Menci N., 1998, ApJ, 498, 95
- Girardi et al. (2003) Girardi M., Rigoni E., Mardirossian F., Mezzetti M., 2003, A&A,406,403
- Gnedin (2003a) Gnedin O., 2003, ApJ, 582, 141
- Gnedin (2003b) Gnedin O., 2003, ApJ, 589, 752
- Gray (2004) Gray M. E., Wolf C., Meisenheimer K., Taylor A., Dye S., Borch A., Kleinheinrich M., 2004, MNRAS, 347, L73
- Gunn & Gott (1972) Gunn J. E., Gott J. R., 1972, ApJ, 176, 1
- Madgwick et al. (2002) Madgwick et al., 2002, MNRAS, 333, 133
- Madgwick (2003a) Madgwick D. S., 2003, MNRAS, 338, 197
- Madgwick et al. (2003b) Madgwick D. S., Somerville R., Lahav O., Ellis R., 2003, MNRAS, 343, 871
- Madgwick et al. (2003c) Madgwick D. S. et al., 2003, MNRAS, 344, 847
- Martínez et al. (2002) Martínez H. J., Zandivarez A., Domínguez M., Merchán M. E., Lambas D. G., 2002, MNRAS, 333L, 31
- Menci et al. (2002) Menci N., Cavaliere A., Fontana A., Giallongo E., Poli F., 2002, ApJ, 575, 18
- Menci & Fusco-Femiano (1996) Menci N., Fusco-Femiano R., 1996, ApJ, 472, 46
- Merchán & Zandivarez (2002) Merchán M. E., Zandivarez A., 2002, MNRAS, 335, 216
- Moore et al. (1996) Moore B., Katz N., Lake G., Dressler A., & Oemler A., 1996, Nature, 379, 613
- Moore et al. (1998) Moore B., Lake G., Katz N., 1998, ApJ, 495, 139
- Norberg et al. (2001) Norberg P., et al., 2001, MNRAS, 328, 64
- Norberg et al. (2002) Norberg P., et al., 2002, MNRAS, 332, 827
- Oelmer (1974) Oelmer A. J., 1974, ApJ, 194, 1
- Press et al. (1986) Press W. H., Teukolsky S. A., Vetterling W. T., Flannery B. P., 1986, Numerical Recipes in fortran 77. Cambridge University Press, Cambridge.
- Ramírez & de Souza (1998) Ramírez A. C., de Souza R. E., 1998, ApJ, 496, 693
- Saslaw et al. (1990) Saslaw W. C., Chitre S. M., Itoh M., Inagaki S., 1990, ApJ, 365, 419
- Sodré (1989) Sodré L., Capelato H., Steiner J., Mazure A., 1989, AJ, 97, 1279
- Stein (1997) Stein P., 1997, A&A, 317,670
- Ueda (1993) Ueda H., Itoh M., Suto Y., 1993, ApJ, 45, 7
- Whitmore, Gilmore & Jones (1993) Whitmore B., Gilmore D., Jones C., 1993, ApJ, 407, 489
- Yepes et al. (1991) Yepes G., Domínguez–Tenreiro R., del Pozo–Sanz R., 1991, ApJ, 373, 336