Abstract
There is overwhelming evidence for the presence of supermassive black holes (SMBHs) in the centers of most nearby galaxies. The mass estimates for these remnant black holes from the stellar kinematics of local galaxies and the quasar phenomenon at high redshifts point to the presence of assembled SMBHs. The accretion history of SMBHs can be reconstructed using observations at high and low redshifts as model constraints. Observations of galaxies and quasars in the submillimeter, infrared, optical, and X-ray wavebands are used as constraints, along with data from the demography of local black holes. Theoretical modeling of the growth of black hole mass with cosmic time has been pursued thus far in two distinct directions: a phenomenological approach that utilizes observations in various wavebands, and a semi-analytic approach that starts with a theoretical framework and a set of assumptions with a view to matching observations. Both techniques have been pursued in the context of the standard paradigm for structure formation in a Cold Dark Matter dominated universe. In this chapter, we examine the key issues and uncertainties in the theoretical understanding of the growth of SMBHs.
Modeling the accretion history of supermassive black holes \rheadModeling the accretion history
1 Introduction
The local demography of black holes (Ferrarese, this volume) has established that most galaxies harbor a supermassive black hole (SMBH; Kormendy & Richstone 1995; Magorrian et al. 1998; van der Marel 1999), most likely assembled via a combination of accretion and mergers. These nuclear SMBHs are “dead quasars”, relics of quasar activity that might have occurred in many galaxies over their history (Lynden-Bell 1969; Sołtan 1982; Rees 1990; Richstone et al. 1998). Early attempts to interlink the properties of these remnant black holes with those of their host galaxy luminosities (Magorrian et al. 1998) yielded a relation between the bulge luminosity and the black hole mass of about 0.5 dex in the ratio of . A tighter correlation has since been measured between the velocity dispersion of the bulge and the black hole mass (Ferrarese & Merritt 2000; Gebhardt et al. 2000), suggesting that the formation and evolution of SMBHs is inextricably linked to that of the stellar component of galactic bulges.
Quasar activity is powered by gas accretion onto SMBHs (Lynden-Bell 1969), and hence the build-up of these SMBHs is likely to have commenced at fairly high redshifts. Indeed, optically bright quasars have now been detected at redshifts greater than 6 (e.g., Fan et al. 2001a, 2003). Quasars at these high redshifts provide an efficient tool to investigate the relation between black hole and early spheroid assembly. There are indications that high redshift quasar hosts are often strong sources of dust emission (Omont et al. 2001; Cox et al. 2002; Carilli et al. 2002; Walter et al. 2003), suggesting that quasars were common in massive galaxies at a time when the galaxies were undergoing copious star formation.
The growth of black hole mass in the universe can therefore be traced using quasar activity. The phenomenological approach to understanding the assembly of SMBHs involves using observational data from both high and low redshifts as a starting point to construct a viable and consistent picture that is consonant with the larger framework of the growth and evolution of structure in the universe. Another approach that has been pursued is semi-analytic modeling, in which one starts from a set of ab initio assumptions and attempts to explain the observations.
Both approaches have proved to be fruitful and, in fact, share many common features. They are both grounded in the framework of the standard paradigm that involves the growth of structure via gravitational amplification of small perturbations in a Cold Dark Matter (hereafter, CDM) universe—a model that has independent validation, most recently from Wilkinson Microwave Anisotropy Probe (WMAP) measurements of the anisotropies in the cosmic microwave background (Spergel et al. 2003; Page et al. 2003). Structure formation in both modeling schemes is tracked in cosmic time by keeping a census of the number of collapsed dark matter halos of a given mass that form; these provide the sites for harboring black holes. The computation of the mass function of dark matter halos is done using either the Press-Schechter (Press & Schechter 1974) or the extended Press-Schechter theory (Lacey & Cole 1993), or, in some cases, directly from cosmological N-body simulations (Di Matteo et al. 2003). In this chapter, we present the detailed modeling procedures and key parameters and uncertainties for the phenomenological approach, as discussed by Haehnelt, Natarajan, & Rees (1998). We also summarize the results from the semi-analytic modeling.
2 The Phenomenological Approach: Basic Notation
We first outline some of the basic definitions and assumptions that are useful in understanding the accretion paradigm. The Eddington luminosity of a black hole of mass is defined to be
| (1) |
where is the proton mass and is the Thomson scattering cross-section. The bolometric luminosity of the accreting black hole is given by
| (2) |
where is the mass accretion rate and (typically assumed to be 10%) is the radiative efficiency factor. The Eddington rate is defined to be the mass accretion rate for which a black hole with radiative efficiency has the Eddington luminosity,
| (3) |
The dimensionless rate is simply the accretion rate measured in units of the Eddington rate, .
This definition of the Eddington rate applies in the case of accretion onto a black hole from a thin accretion disk whose viscosity is defined in terms of the parameter , the sound speed , and the disk scale height . The mass growth rate of a black hole accreting at is exponential with an e-folding timescale
| (4) |
the Salpeter time. For Eddington accretion, this is the only characteristic timescale in the problem.
3 Observational Constraints from High and Low Redshifts
In tying the various lines of observational evidence together, we first consider the abundance and luminosity function (LF) of quasars at various redshifts. While bright quasar activity in the optical seems to peak around a redshift of (Schmidt, Schneider, & Gunn 1994; Warren, Hewett, & Osmer 1994; Shaver et al. 1996; Boyle et al. 2000; Fan et al. 2001b), luminous quasars are now detected at redshifts beyond 6 (Fan et al. 2001a, 2003). Since quasars are believed to be powered by accretion onto SMBHs at the centers of galaxies, a number of authors have linked the changes in quasar activity to changes in the availability of fuel supply at the centers of the host galaxies (Rees 1984; Cavaliere & Szalay 1986; Wandel 1991; Small & Blandford 1992; Haehnelt & Rees 1993). Efstathiou & Rees (1988) also recognized that the peak of quasar activity coincides with the time when the first deep potential wells assemble in plausible variants of hierarchical cosmogonies in CDM models. This enables the linking of the formation of the central black holes with that of the dark matter halos in which the host galaxies assemble.
The past few years have seen dramatic observational improvements in the detection of galaxies and quasars at high redshifts, transforming our knowledge of galaxy and star formation in the high redshift universe (e.g., Madau, Pozzetti, & Dickinson 1998). Now there are also far more extensive data on the demography of SMBHs in nearby galaxies (Ferrarese, this volume) and on low level activity of Active Galactic Nuclei (AGN) in both the optical and X-ray wavebands (Narayan & Yi 1995; Mushotzky, this volume). We next discuss some of the implications for the formation and evolution of AGN and attempt to combine the evidence from low and high redshift data.
4 Local Demography of Black Holes
The last few years have seen tremendous progress in establishing the existence of SMBHs. There are now a number of excellent cases (including that of our own Galaxy) where observations strongly imply the presence of a relativistic potential well (Watson & Wallin 1994; Miyoshi et al. 1995; Genzel et al. 1997). Magorrian et al. (1998) first published about thirty estimates for the masses of the putative black holes in the bulges of nearby galaxies. They confirmed previous claims of a strong correlation between black hole and bulge mass (Kormendy & Richstone 1995). Recent determinations of this relation (Merritt & Ferrarese 2001) give
| (5) |
However, considering the observational scatter, a mildly non-linear relation would probably also be consistent with the data. We would further like to clarify that a linear relation between black hole and bulge mass does not necessarily imply a linear relation between black hole and halo mass, and, as we will argue later, a non-linear relation might be more plausible.
Subsequently, a tighter correlation was found between the black hole mass and the velocity dispersion of the bulge (Ferrarese & Merritt 2000; Gebhardt et al. 2000; Tremaine et al. 2002). Combining that relation with the distribution function of velocity dispersions for nearby galaxies from the SDSS (Sheth et al. 2003), Yu & Tremaine (2002) determined the local black hole mass density to be
| (6) |
Although this number is reasonably well determined, possible systematic errors in the black hole mass estimates imply that this number is still somewhat uncertain (van der Marel 1999; Valluri, Merritt, & Emsellem 2004).
Integrating the LF of optically bright quasars provides a secure lower bound to the mass density acquired by black holes via accretion at high redshifts (Sołtan 1982; Chokshi & Turner 1992). Yu & Tremaine (2002) determined the integrated mass density of accreting black holes at to be
| (7) |
for their preferred values of the bolometric correction, , and accretion efficiency, . Somewhat remarkably, given that we have assumed no contribution to black hole mass growth from obscured accretion, these numbers appear to be in agreement, within substantial uncertainties.
5 Relating the LFs of Star-forming Galaxies and Quasars to CDM Halos
5.1 Lyman Break Galaxies
Steidel and collaborators (Steidel & Hamilton 1992; Steidel et al. 1996; Giavalisco, Steidel, & Macchetto 1996) exploited a technique (the so-called “drop out” or “Lyman break” technique) developed by Cowie et al. (1988) for picking out galaxies at high redshifts. The procedure is to make ultraviolet and optical observations in various wavebands and then see how bright the galaxies are in each of the wavebands. Steidel and collaborators were interested in galaxies at redshifts of around three. At these redshifts, intrinsic absorption by both hot stars in the galaxies and surrounding neutral gas causes the galaxies to appear very faint—or “drop out”—in the observed ultraviolet waveband. In this way, Steidel and his collaborators found many hundreds of star-forming galaxies at . These galaxies, called Lyman Break Galaxies (LBGs), bear a close resemblance to local starburst galaxies. The abundance of LBGs is roughly half that of present-day galaxies. There are, however, no secure direct dynamical mass estimates for the LBGs. The relation of the LBG masses to the rate of detected star formation is becoming more clear with the discovery of strong outflows and winds in many cases (Adelberger et al. 2003). Strong clustering detected in the LBGs at leads to an interpretation of these objects as the potential progenitors of massive galaxies at the present epoch.
5.2 High Redshift Quasars
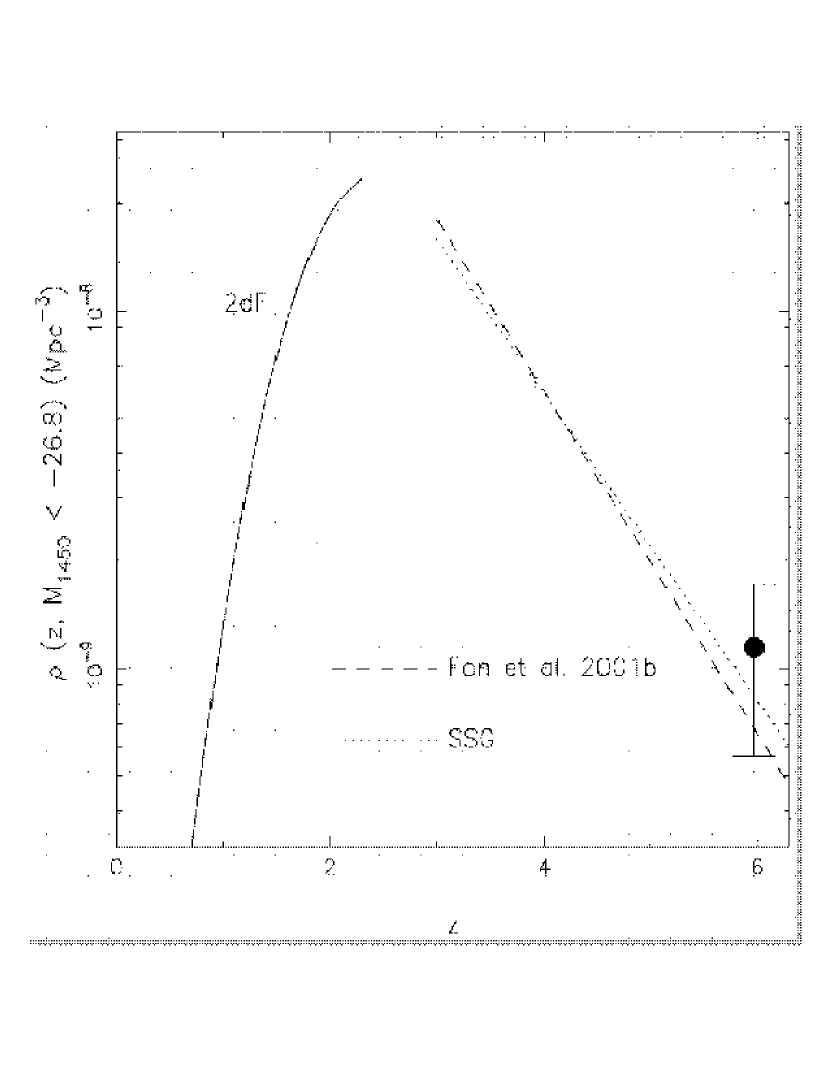
Several groups have been engaged in the quest for high redshift quasars. In the Palomar Transit Grism Survey, Schmidt et al. (1994) detected 90 quasars in the redshift range by their Ly emission. They found that the space density of quasars decreases by a factor of 2.7 per unit redshift beyond . Based on their analysis, they concluded that the peak of the comoving space density distribution of quasars with lies in the redshift range . More recently, the Anglo-Australian Telescope’s Two Degree Field (2dF) redshift survey and the Sloan Digital Sky Survey (SDSS) have detected quasars from (2dF) and beyond (SDSS). Using color selection techniques, Fan et al. (2001b) derived the LF over the ranges and from a sample of 39 quasars from the SDSS; this LF is in good agreement with previous estimates. Figure 1 shows how the space density of quasars detected at these bright magnitudes by the SDSS is consistent with extrapolations of the best fit LFs from the 2dF (Boyle et al. 2000).
Using their sample of six quasars, Fan et al. (2003) computed the space density of quasars at to be Mpc-3 for a Lambda dominated universe with , , and km s-1 Mpc-1. The quasars have luminosities that imply black hole masses of a few times , providing an important constraint for theoretical models.
The quasar LF at high redshifts also provides a sensitive test of cosmological parameters and models of quasar evolution. The observed luminous quasars probably represent the rare mass peaks in the density field at and hence probe the high mass tail of the dark halo mass function at these epochs. The slope of the LF is determined by both the slope of the dark halo mass function and the relation between black hole mass (proportional to the quasar luminosity, if the quasar is radiating at the Eddington limit) and dark halo mass. Since quasars are extremely rare at , representing extremely high significance peaks in the underlying density field, their LF is expected to be very steep. While current determinations are not robust due to the small number of detected quasars, the slope at (Boyle et al. 2000) is found to be (where the quasar LF is ), and the slope at (Fan et al. 2001b) is found to be . An interesting fact to note here is that the mass function of CDM halos at is, in fact, steeper than the slope of the quasar LF at the relevant mass scale, which immediately suggests that for high redshift quasars, their luminosities cannot simply scale linearly with the mass of the halo that hosts them; rather, high mass black holes radiate more efficiently than do lower mass ones.
All studies are in agreement with a steep decline in the abundance of quasars at low redshifts. At the high redshift end, the observed decline in the quasar number density could be due either to the real paucity of quasars or to obscuration by dust, introducing a systematic bias at high redshifts. Radio wavelengths are unaffected by dust: Shaver et al. (1996) report that in the Parkes radio survey of a large sample of flat spectrum sources covering roughly 40% of the sky, the space density of radio loud quasars does indeed decline with redshift at . These authors argue that the same conclusion probably applies to all quasars.
5.3 Linking Star-forming Galaxies and Quasars
In what follows, we explore the link between star-forming galaxies and quasars at high redshifts, assuming that both populations trace the mass function of DM halos in the universe. Using the Press-Schechter formalism, we obtain estimates of the space density of DM halos for an assumed cosmological model. The space density of high redshift, star-forming galaxies detected via the Lyman break technique corresponds to that of halos with masses and virial velocities of order 300 km s-1 (see also Baugh, Frenk, & Lacey 1998). Further evidence for masses of this order comes from the strong clustering of these galaxies (Steidel et al. 1998; Bagla 1998; Jing & Suto 1998).
A reasonable fit to the LF can be obtained by assuming a linear relation between the star formation rate and the halo mass, i.e., a constant mass-to-light ratio. A weakly non-linear relation is also consistent with the data and, indeed, would be required to match the shallow slope of the LF at the high luminosity end, as reported by Bershady et al. (1997). Comparable fits are obtained for the other variants of the CDM model. The observed widths of the LBGs of km s-1 (Pettini et al. 1998) are assumed to be due to the massive amounts of star formation ongoing in the inner parts of the galaxies. Nearby starbursts suggest that most of this emission originates at very small radii, and hence these velocities do not reflect the virial velocities of km s-1 required from the inferred masses of CDM host halos.
The space density of optically selected quasars at with is smaller than that of the detected star-forming galaxies by a factor of a few hundred. As demonstrated by Haehnelt & Rees (1993), the evolution of optically selected quasars can be linked to the hierarchical growth of DM halos on a similar timescale only if the duration of the optically bright phase, , is considerably shorter than the Hubble time. For small , this is more and more in line with the predicted space densities of DM halos and star-forming galaxies at high redshifts. However, hardly anything is known about the masses of the host galaxies of optically selected quasars, and this still leaves considerable freedom in the exact choice of .
Following the approach of Haehnelt et al. (1998), we estimate the formation rate of active black holes by taking the positive term of the time derivative of the halo mass function and a simple parameterization for the black hole formation efficiency. It is further assumed that active black holes radiate with a light curve of the form
| (8) |
where is the ratio of the bolometric luminosity to the Eddington luminosity, and is the fraction of the bolometric luminosity radiated in the -band.

Given the number of free parameters, this is only a consistency check, but we find that with a simple set of assumptions, we are able to connect the CDM mass functions to a model of optically bright quasars that the DM halos can host. Figure 2 shows how—if we allow ourselves some freedom in the relation between halo mass and black hole mass—reasonable fits are obtained for a range of lifetimes and for all of the CDM variants (the variants considered are the Standard CDM [SCDM] model with and , the Open CDM [OCDM] model with and , and the Lambda CDM [CDM] model with and ). There are, however, systematic trends: with increasing lifetime, (1) the black hole mass has to become a progressively more non-linear function of the halo mass, and (2) the black hole formation efficiency has to decrease in order to match the LF of quasars. This is due to the fact that quasars are identified with rarer and more massive halos with increasing lifetime, and these fall on successively steeper portions of the halo mass function.
In three of the panels in Figure 2, we assume a quasar lifetime close to the Salpeter timescale and the following scaling of the black hole mass with the halo virial velocity:
| (9) |
This particular choice of dependence is in very good agreement with the tight empirical correlation found between the black hole mass and the velocity dispersion of the host bulge for local galaxies (Ferrarese & Merritt 2000; Gebhardt et al. 2000; Tremaine et al. 2002). The remaining panel (b) shows a linear relation between the halo mass and the black hole mass, as advocated by Haiman & Loeb (1998); this requires a quasar lifetime of less than yr—much shorter than the Salpeter time for the usually assumed values of .
In principle, could also depend on mass or other parameters. The main uncertainty is the duty cycle or lifetime of the optically bright phase of the quasar. The lifetime is degenerate with the fraction of galaxy halos that host a black hole. Menou, Haiman, & Narayanan (2001) showed that, despite the ubiquity of SMBHs at the centers of luminous nearby galaxies, only a small fraction need to harbor SMBHs at high redshifts, due to the assembly of structure at late times via multiple mergers. This fact needs to be taken into account while studying the clustering properties of quasars. It is precisely those observations—clustering as a function of redshift—that will help constrain the lifetime and hence break the degeneracy.
We should also note that the lifetime of the optically bright quasar phase probably reflects only a small fraction of the time that the black hole is accreting gas. Direct evidence for this comes from X-ray surveys, which show that about 4% of the galaxy population are X-ray luminous (Barger et al. 2001a, 2001b). This implies that accretion at a level sufficient to produce detectable X-ray emission lasts for at least half a gigayear in these galaxies.
6 The Semi-Analytic Approach
Semi-analytic models of galaxy formation track the formation and evolution of galaxies within a merging hierarchy of dark matter halos in a CDM universe (e.g., Kauffmann & White 1993). Simple recipes are adopted to describe gas cooling within these halos, star formation, supernova feedback, and merging rates of galaxies. Stellar population synthesis models are used to generate galaxy LFs, counts, and redshift distributions for direct comparison with observations. These models have been studied extensively and can reproduce many properties of observed galaxies, including variations in galaxy clustering with morphology, luminosity, and redshift (Baugh et al. 1998; Kauffmann et al. 1999), the evolution of cluster galaxies (Kauffmann & Charlot 1998), and the properties of the LBG population (Baugh et al. 1998; Somerville, Primack, & Faber 2001).
Into this merging scheme, Kauffmann & Haehnelt (2000) incorporated the growth of SMBHs. It is assumed that SMBHs are fueled with gas and hence grow via accretion during major mergers. In addition, it is assumed that when two galaxies of comparable mass merge, their central black holes also merge, accompanied by gas accretion over the Salpeter time. With these simple assumptions, the model proposed by Kauffmann & Haehnelt (2000, 2002) fits many aspects of the evolution of galaxies. It successfully reproduces (1) the observed correlation between bulge luminosity and black hole mass (Magorrian et al. 1998; Gebhardt et al. 2000), and the tighter version of the same—the velocity dispersion of the bulge versus black hole mass in nearby galaxies (Ferrarese & Merritt 2000; Gebhardt et al. 2000; Tremaine et al. 2002), (2) what is currently known of the evolution of the abundance of quasars with redshift, and (3) the relation between quasars and their host galaxy luminosities. Kauffmann & Haehnelt (2000) demonstrate that the sharp decline observed in the number density of quasars from to reflects a combination of effects: a decrease in the merging rate of DM halos in this redshift range, depletion in the availability of cold gas to fuel these black holes, and an increased timescale for gas accretion.
7 Constraints on the Accretion History of Supermassive Black Holes
The question of when SMBHs gained most of their mass is closely related to and . For bright quasars, must be ; otherwise, excessively massive individual black holes would be required to explain the most luminous quasars detected at high redshifts. If , then significant growth could not have occurred in a low radiative efficiency phase, either after the optically bright phase (in which case it would be in an advection dominated accretion flow or ADAF), or as a result of over-fed accretion during the optically bright phase. Furthermore, will always be smaller than unity, even if the ratio of the accretion rate to that necessary to sustain the Eddington luminosity, , greatly exceeds unity (over-fed accretion case). This is because a “trapping surface” develops at a radius proportional to in the accretion disk, within which the radiation advects inwards rather than escapes. In consequence, the emission efficiency declines inversely with for (Begelman 1978).
If exceeds 10%, then the inferred mass density gained during the optically bright phase is proportionally reduced, allowing room for a significant fraction of the mass to be accreted in an obscured phase. This ties in very nicely with the large number of obscured sources detected in deep X-ray (e.g., Barger et al. 2003) and submillimeter (see Blain et al. 2002 for a review) surveys and is a very plausible scenario, at least if the typical black hole has a non-zero spin. A significant spin is more likely to arise as a result of rapid accretion rather than growth via black hole mergers (Hughes & Blandford 2003; see also Gammie, Shapiro, & McKinney 2003).

Using the observed quasar LF, the observed black hole mass function in local early-type galaxies at , and assuming that quasars are accreting at the Eddington limit, Yu & Tremaine (2002) derive constraints on the mean lifetime of quasars (i.e., the duration of their optically bright phase; Fig. 3). The lifetime obtained as a function of black hole mass is yr. Thus, current observations are consistent with the fact that the primary growth phase for black holes has a duration comparable to the Salpeter time, implying that accretion during the optically bright quasar phase can add substantial mass to the black holes (as opposed to mass accretion via mergers alone). To avoid over-producing the mass in local black holes, the mean accretion rate subsequent to the optically bright phase must be more than two orders of magnitude lower than the Eddington rate. Theoretically, this requires a relatively low feeding rate within ADAF models, in which the mass supply at large radius is equal to the accretion rate at the event horizon (Narayan & Yi 1995). No such constraint is obtained if the low radiative efficiency is primarily due to mass loss from accretion flows (Blandford & Begelman 1999).
8 Possible Accretion Histories

In Figure 4, we illustrate the observable effects of two possible accretion histories with low overall efficiencies for producing blue light—the solid curves describe an accretion history where most of the mass is accreted during the ADAF phase, while the dashed curves describe an accretion history where the black hole gains most of its mass during a short lived early phase with . We show versus time (top panel) the mass accretion rate in units of the Eddington accretion rate, (second panel) the mass relative to the final mass, and (bottom two panels) the optical and hard X-ray luminosities. The accretion rate is constant at the beginning with . The mass therefore linearly rises and decreases. The spectral energy distribution (SED) for accretion with is rather uncertain (as indicated by the three parallel lines for in the two bottom panels) and should depend on the absorbing column and the dust content of the outer parts of the self-gravitating disk and/or the host galaxy. The sharp drop of marks the onset of the back-reaction on the accretion flow, and either the start or the peak of the optically bright phase (with a rather inefficient production of hard X-rays). Once the accretion rate has fallen below the critical rate for an ADAF (indicated by the dashed lines in the top panel), the SED will change to one peaked in the hard X-ray waveband.
9 Faint X-ray Sources and the Hard X-ray Background
The X-ray emission from quasars provides direct information about their black hole regions and where accretion occurs, as the X-rays are produced by the inner accretion disk and its corona. X-ray observations can address the fundamental question of whether early black holes at high redshifts grow and feed in a similar fashion to their low redshift counterparts. The comoving number density of quasars declines dramatically over cosmic time (Fig. 1), and part of this strong evolution is believed to be due to changes in the environment that are likely to impact the X-ray emission region (Vignali et al. 2003).
As pointed out by many authors, the X-ray emission of optically selected quasars is too soft to explain the origin of the hard X-ray background. Di Matteo & Fabian (1997) and Yi & Boughn (1998) argued that the emission from ADAFs has a spectral shape similar to the hard X-ray background. Fabian et al. (1998) suggested that this might also be true for dust obscured accretion. The ROSAT, Chandra, and XMM-Newton X-ray observations and ground-based follow-ups (e.g., Almaini et al. 1996; Hasinger et al. 1998, 2001; Schmidt et al. 1998; McHardy et al. 1998; Mushotzky et al. 2000; Brandt et al. 2001; Barger et al. 2001b, 2002; Giacconi et al. 2002; Szokoly et al. 2004) that resolve the X-ray background into discrete sources show that obscured AGN are the primary contributors to the X-ray background. The majority of these sources are at low redshifts; thus, while they contribute to the integrated black hole mass density, their significance compared to the optically bright quasars is uncertain (see Cowie & Barger, this volume, for a discussion of this issue). That accretion occurs in galaxies other than luminous AGN also fits in well with the detection of extremely low level optical AGN activity in a large fraction of galaxies reported by Ho, Filippenko, & Sargent (1997).
10 Conclusions
The optical quasar LF at can be plausibly matched with the LF of star-forming galaxies at the same redshift, and with the mass function of DM halos predicted by a range of variants of CDM cosmogonies (and believed to comply with observational constraints in the low redshift universe). This is possible for lifetimes of optically bright quasars in the range to yr. There is a correlation between the lifetime and the required degree of non-linearity in the relation between black hole and halo mass. The non-linearity has to increase for increasing lifetime. Predicted host halo masses, host galaxy luminosities, and the clustering strength all increase with increasing lifetime, and further observations of these offer our best hope of constraining the duration of the optically bright phase of quasars.
The present-day black hole mass density implied by the integrated luminosities of optically bright quasars is comparable to that inferred from recent black hole estimates in nearby galaxies for generally assumed efficiencies for producing blue light. This limits the contribution of accretion in a low radiative efficiency mode to either (1) modest rates at low redshifts or (2) highly super-Eddington rates during the final assembly of black holes.
While the conventional picture of quasars as a population of supermassive black holes growing by accretion and mergers seems more secure than ever, there remain many open key questions. The importance of several parameters is as yet poorly understood: the role of the black hole mass, the accretion rate, the radiative efficiency, the properties of accretion flows at low and high accretion rates, the relative importance of mergers versus accretion as a function of cosmic epoch, and the relation between quasar populations observed at different wavelengths. Bearing in mind that fundamental quantities like the radiative efficiency might well be functions of the black hole mass, redshift, and environment—rather than constants, as assumed hitherto for simplicity—it is clear that the comparison of integrated quantities alone is insufficient to uniquely specify the model.
Recent modeling attempts have, however, made considerable progress in integrating multiwavelength data into the schemes outlined here (Steed & Weinberg 2004; Yu & Tremaine 2002). The key observations in the future that are likely to constrain theoretical models are probing the faint end of the quasar LF, determining the clustering properties of quasars with redshift, and obtaining better measurements of the joint X-ray, optical, infrared, and submillimeter luminosity functions.
References
- [1] Adelberger, K. L., Steidel, C. C., Shapley, A. E., & Pettini, M. 2003, ApJ, 584, 45
- [2] Almaini, O., Boyle, B. J., Shanks, T., Griffiths, R. E., Roche, N., Stewart, G. C., & Georgantopoulos, I. 1996, MNRAS, 282, 295
- [3] Bagla, J. S. 1998, MNRAS, 297, 251
- [4] Barger, A. J., Cowie, L. L., Bautz, M. W., Brandt, W. N., Garmire, G. P., Hornschemeier, A. E., Ivison, R. J., & Owen, F. N. 2001a, AJ, 122, 2177
- [5] Barger, A. J., Cowie, L. L., Brandt, W. N., Capak, P., Garmire, G. P., Hornschemeier, A. E., Steffen, A. T., & Wehner, E. H. 2002, AJ, 124, 1839
- [6] Barger, A. J., Cowie, L. L., Mushotzky, R. F., & Richards, E. A. 2001b, AJ, 121, 662
- [7] Barger, A. J., et al. 2003, AJ, 126, 632
- [8] Baugh, C. M., Frenk, C. S., & Lacey, C. 1998, ApJ, 498, 504
- [9] Begelman, M. C. 1978, MNRAS, 184, 53
- [10] Bershady, M., Majewski, S. R., Koo, D. C., Kron, R. G., & Munn, A. 1997, ApJ, 490, L41
- [11] Blain, A. W., Smail, I., Ivison, R. J., Kneib, J-P., & Frayer, D. T. 2002, PhR, 369, 111
- [12] Blandford, R., & Begelman, M. 1999, MNRAS, 303, L1
- [13] Boyle, B. J., Shanks, T., Croom, S. M., Smith, R. J., Miller, L., Loaring, N., & Heymans, C. 2000, MNRAS, 317, 1014
- [14] Boyle, B. J., Shanks, T., & Peterson, B. A. 1988, MNRAS, 235, 935
- [15] Brandt, W. N., et al. 2001, AJ, 122, 2810
- [16] Carilli, C., et al. 2002, AJ, 123, 1838
- [17] Cavaliere, A., & Szalay, A. 1986, ApJ, 311, 589
- [18] Chokshi, A., & Turner, E. L. 1992, MNRAS, 259, 421
- [19] Cowie, L. L., Lilly, S. J., Gardner, J., & McLean, I. S. 1988, ApJ, 332, L29
- [20] Cox, P., et al. 2002, A&, 387, 406.
- [21] Di Matteo, T., Croft, A. C., Springel, V., & Hernquist, L. 2003, ApJ, 593, 56
- [22] Di Matteo, T., & Fabian, A. C. 1997, MNRAS, 286, 393
- [23] Efstathiou, G. P., & Rees, M. J. 1988, MNRAS, 230, 5
- [24] Fabian, A. C., Barcons, X., Almaini, O., & Iwasawa, K. 1998, MNRAS, 297, L11
- [25] Fan, X., et al. 2001a, AJ, 122, 2833
- [26] Fan, X., et al. 2001b, AJ, 121, 54
- [27] Fan, X., et al. 2003, AJ, 125, 1649
- [28] Ferrarese, L., & Merritt, D. 2000, ApJ, 539, L9
- [29] Gammie, C. F., Shapiro, S. L., & McKinney, J. C. 2003, ApJ, 602, 312
- [30] Gebhardt, K., et al. 2000, ApJ, 539, L13
- [31] Genzel, R., Eckart, A., Ott, T., & Eisenhauer, F. 1997, MNRAS, 201, 219
- [32] Giacconi, R., et al. 2002, ApJS, 139, 369
- [33] Giavalisco M., Steidel, C. C., & Macchetto, F. D. 1996, ApJ, 470, 189
- [34] Haehnelt, M. G., Natarajan, P., & Rees, M. J., 1998, MNRAS, 300, 817
- [35] Haehnelt, M. G., & Rees, M. J. 1993, MNRAS, 263, 168
- [36] Haiman, Z., & Loeb, A. 1998, ApJ, 503, 505
- [37] Hasinger, G., Burg, R., Giacconi, R., Schmidt, M., Trümper, J., & Zamaroni, G. 1998, A&A, 329, 482
- [38] Hasinger, G., et al. 2001, A&A, 365, L45
- [39] Ho, L. C., Filippenko, A. V., & Sargent, W. L. W., ApJ, 1997, 487, 568
- [40] Hughes, S., & Blandford, R. 2003, ApJ, 585, L101
- [41] Jing, J.P., & Suto, Y. 1998, ApJ, 494, L5
- [42] Kauffmann, G., & Charlot, S. 1998, MNRAS, 297, 23
- [43] Kauffmann, G., Colberg, J., Diaferio, A., & White, S. D. M. 1999, MNRAS, 303, 188
- [44] Kauffmann., G., & Haehnelt, M. 2000, MNRAS, 311, 576
- [45] Kauffmann., G., & Haehnelt, M. 2002, MNRAS, 332, 529
- [46] Kauffmann, G., & White, S. D. M. 1993, MNRAS, 261, 921
- [47] Kormendy, J., & Richstone, D. 1995, AR&A, 33, 581
- [48] Lacey, C., & Cole, S. 1993, MNRAS, 262, 627
- [49] Lynden-Bell, D. 1969, Nature, 223, 690
- [50] Madau, P., Pozzetti, L., & Dickinson, M. 1998, 498, 106
- [51] Magorrian, J., et al. 1998, AJ, 115, 2285
- [52] McHardy, I. M., et al. 1998, MNRAS, 295, 641
- [53] Menou, K., Haiman, Z., & Narayanan, V. 2001, ApJ, 558, 535
- [54] Merritt, D., & Ferrarese, L. 2001, MNRAS, 320, L30
- [55] Miyoshi, M., Moran, M., Hernstein, J., Greenhill, L., Nakai, N., Diamond, P., & Inoue, N. 1995, Nature, 373, 127
- [56] Mushotzky, R. F., Cowie, L. L., Barger, A. J., & Arnaud, K. A. 2000, Nature, 404, 459
- [57] Narayan, R., & Yi, I. 1995, ApJ, 452, 710
- [58] Omont, A., Cox, P., Bertoldi, F., McMahon, R. G., Carilli, C., & Isaak, K. G. 2001, A&A, 374, 371
- [59] Page, L., et al. 2003, ApJS, 148, 233
- [60] Pettini, M., Kellogg, M., Steidel, C. C., Dickinson, M., Adelberger, K. L., & Giavalisco, M. 1998, ApJ, 508, 539
- [61] Press, B., & Schechter, P. 1974, ApJ, 181, 425
- [62] Rees, M. J. 1984, ARA&A, 22, 471
- [63] Rees, M. J. 1990, Science, 247, 817
- [64] Richstone, D., et al. 1998, Nature, 395, 14
- [65] Schmidt, M., Schneider, D. P., & Gunn, J. E. 1994, AJ, 110, 68
- [66] Schmidt, M., et al. 1998, A&A, 329, 495
- [67] Shaver, P., Wall, J. V., Kellermann, K. I., Jackson C. A., & Hawkins, M. R. S. 1996, Nature, 384, 439
- [68] Sheth, R., et al. 2003, ApJ, 594, 225
- [69] Small, T., & Blandford, R. 1992, MNRAS, 259, 725
- [70] Sołtan, A. 1982, MNRAS, 200, 115
- [71] Somerville, R., Primack, J., & Faber, S. M. 2001, MNRAS, 320, 504
- [72] Spergel, D., et al. 2003, ApJS, 148, 161
- [73] Steed, A., & Weinberg, D. H. 2004, ApJ, in press [astro-ph/0311312]
- [74] Steidel, C. S., Adelberger, K., Dickinson, M., Giavalisco, M., Pettini, M., & Kellogg, M. 1998, ApJ, 492, 428
- [75] Steidel, C. S., Giavalisco, M., Pettini, M., Dickinson, M., & Adelberger, K. L. 1996, ApJ, 462, L17
- [76] Steidel, C. S., & Hamilton, D. 1992, AJ, 104, 941
- [77] Szokoly, G. P., et al. 2004, ApJS, in press
- [78] Tremaine, S., et al. 2002, ApJ, 574, 740
- [79] van der Marel, R. 1999, AJ, 117, 744
- [80] Valluri, M., Merritt, D., & Emsellem, E. 2004, ApJ, 602, 66
- [81] Vignali, C., et al. 2003, AJ, 125, 2876
- [82] Walter, F., et al. 2003, Nature, 424, 406
- [83] Wandel, A. 1991, A&A, 241, 5
- [84] Warren, S. J., Hewitt, P.C., & Osmer, P.S. 1994, ApJ, 421, 412
- [85] Watson, W.D., & Wallin, B. K., 1994, ApJ, 432, L35
- [86] Yi, I., & Boughn, S. P. 1998, ApJ, 499, 198
- [87] Yu, Q., & Tremaine, S. 2002, MNRAS, 335, 965