Carina’s Defiant Finger: HST Observations of a Photoevaporating Globule in NGC 3372††thanks: Based in part on observations made with the NASA/ESA Hubble Space Telescope, obtained at the Space Telescope Science Institute, which is operated by the Association of Universities for Research in Astronomy, Inc., under NASA contract NAS5-26555.
Abstract
We present Hubble Space Telescope Wide Field Planetary Camera 2 images of a prominent externally-ionized molecular globule in the Carina Nebula (NGC 3372), supplemented with ground-based infrared images and visual-wavelength spectra. This molecular globule has a shape resembling a human hand, with an extended finger that points toward its likely source of ionizing radiation. Following an analysis of the spatially-resolved ionization structure and spectrum of the photoevaporative flow from the Finger, we conclude that the dominant ionizing source is either the WNL star WR25 (HD 93162), the adjacent O4 If-type star Tr16-244, or perhaps both. We estimate a mass-loss rate of 210-5 M⊙ yr-1 from the main evaporating surface of the globule, suggesting a remaining lifetime of 105.3 to 106 years. We find a total mass for the entire globule of more than 6 M⊙, in agreement with previous estimates. The hydrogen column density through the globule derived from extinction measurements is a few times 1022 cm-2, so the photodissociation region behind the ionization front should be limited to a thin layer compared to the size of the globule, in agreement with the morphology seen in H2 images. Although a few reddened stars are seen within the boundary of the globule in near-infrared continuum images, these may be background stars. We do not detect a reddened star at the apex of the finger, for example, down to a limiting magnitude of 17. However, considering the physical properties of the globule and the advancing ionization front, it appears that future star formation is likely in the Finger globule, induced by radiation-driven implosion.
keywords:
H ii regions — ISM: globules — ISM: individual (NGC 3372) — stars: formation1 INTRODUCTION
Compact bright-rimmed molecular globules are common in evolved massive star forming regions, and are among the last vestiges of the molecular cloud that gave birth to the OB stars powering the H ii region (e.g., Bok & Reilly 1947). These globules are externally illuminated and are photoevaporated and photoionized by UV radiation. They typically range in size from 0.1 to 1 pc, and appear striking in [S ii] 6717,6731 and H emission arising in the limb-brightened surfaces of their thin ionization fronts. Famous examples of this class of objects are Thackeray’s globules in IC 2944 (Thackeray 1950; Reipurth et al. 2003), as well as similar features in the Rosette Nebula (Herbig 1974), the Gum Nebula (Hawarden & Brand 1976; Reipurth 1983), and the Carina Nebula (Walborn 1975; Cox & Bronfman 1995).
Material evaporated from these clumps partly fills the interior of an H ii region and may help stall the advance of the main ionization front by absorbing incident Lyman continuum radiation and converting it to a recombination front, but perhaps the most pertinent role played by these globules is that they are potential sites of continued star formation. Some globules show clear evidence for embedded star formation, while others do not (Reipurth 1983; Reipurth et al. 2003). If they are sites of star formation, one possibility is that they are simply dense cores that spontaneously collapsed to form stars and were then uncovered by the advancing ionization front. Another more intriguing idea is that pressure from the ionization-shock front at the surface propagates through a globule and helps to overcome the magnetic, turbulent, and thermal pressure that supports it against collapse, thereby inducing a star to form in the globule. This process of radiation-driven implosion is often referred to as triggered star formation. However, direct and unambiguous observational evidence for actively triggered star formation remains elusive; the pillars in M16 may be an example of this phenomenon (White et al. 1999; Hester et al. 1996; Williams et al. 2001; McCaughrean & Andersen 2002). Numerous investigators have examined theoretical aspects of these evaporating globules, including details of the photoevaporative flows, their effect on the surrounding H ii region, the globule’s shaping, destruction, and acceleration (through the “rocket effect”), and the possibility of triggered collapse and star formation due to the pressure of the impinging ionization front (Oort & Spitzer 1955, Kahn 1969; Dyson 1973; Dyson et al. 1995; Elmegreen 1976; Bertoldi 1989; Bertoldi & McKee 1990; Bertoldi & Draine 1996; Lizano et al. 1996; Gorti & Hollenbach 2002; Williams 1999; Williams et al. 2001). The evolution of these globules depends strongly on the incident UV radiation field, the initial size and density of the globule, and other properties, so observations of them in a wide variety of different environments are useful.
| Telescope | Instrument | Filter or | Exp. Time | Comment |
|---|---|---|---|---|
| Emiss. Lines | (sec) | |||
| HST | WFPC2 | F502N, [O iii] 5007 | 320 | image |
| HST | WFPC2 | F656N, H, [N ii] | 400 | image |
| HST | WFPC2 | F673N, [S ii] 6717,6731 | 800 | image |
| CTIO 4m | OSIRIS | J | 120 | image |
| CTIO 4m | OSIRIS | H | 120 | image |
| CTIO 4m | OSIRIS | K | 120 | image |
| CTIO 4m | OSIRIS | He i 10830 | 720 | image |
| CTIO 4m | OSIRIS | Pa | 720 | image |
| CTIO 4m | OSIRIS | H2 1-0 S(1) 2.122 | 1080 | image |
| CTIO 1.5m | RC Spec | blue; 3600-7100 Å | 1200 | long-slit, P.A.=69 |
| CTIO 1.5m | RC Spec | red; 6250-9700 Å | 1200 | long-slit, P.A.=69 |
A rich population of these globules resides in the Carina Nebula (NGC 3372; d=2.3 kpc), with the most notable grouping clustered around the famous Keyhole Nebula. Their emission from ionized, photodissociated, and molecular gas has been documented by several studies (Walborn 1975; Deharveng & Maucherat 1975; Cox & Bronfman 1995; Brooks et al. 2000; Smith 2002; Rathborne et al. 2002). There are a dozen of these clumps around the Keyhole, with typical masses of order 10 M☉ (Cox & Bronfman 1995). A few of these are seen only in silhouette, but most have bright H2 and polycyclic aromatic hydrocarbon (PAH) emission from their illuminated surfaces (Brooks et al. 2000; Rathborne et al. 2002). In addition, several dozen smaller features with diameters of only 5000 AU were recently discovered by Smith et al. (2003a), and additional proplyd candidates are seen in our images (see below, and Barbá et al. in prep.). They may be either large photoevaporating circumstellar disks (proplyds) or very small cometary clouds that are remnants of larger globules in more advanced stages of photoevaporation (e.g., Bertoldi & McKee 1990). It is not yet known if these smaller proplyd candidates or the larger globules in Carina contain embedded protostars or collapsing cores that may someday form stars. However, one large globule in the southern part of the nebula has recently been shown to harbor a Class i protostar that drives the HH 666 jet (Smith et al. 2004). In any case, these globules present a rare opportunity to study their associated phenomena in an environment powered by some of the hottest and most massive stars in the Galaxy (Walborn 1995; Walborn et al. 2002), while still being located near to us and suffering little interstellar extinction.
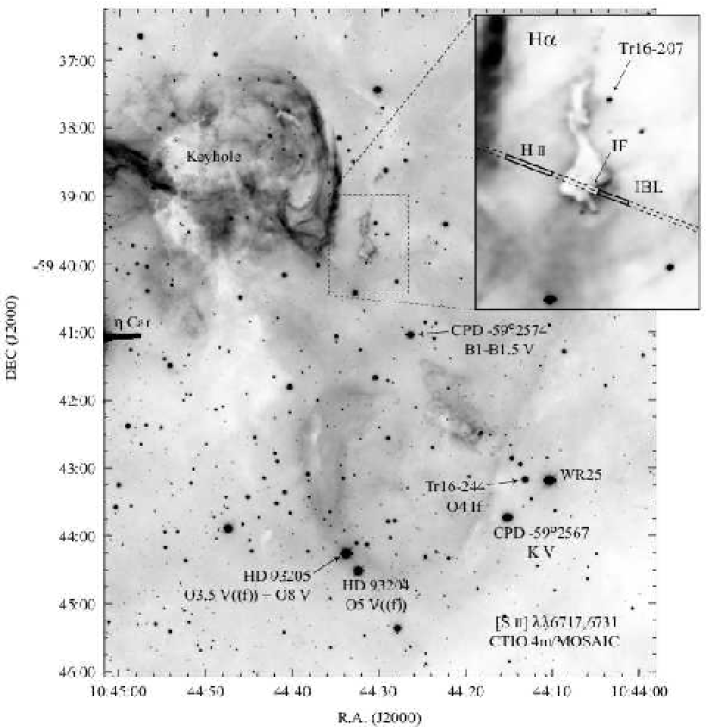
In this paper we untertake a detailed analysis of one particularly striking bright-rimmed globule in the Carina Nebula (see Figure 1) that we call the “Finger” because of its gesticulatory morphology (it has previously been identified as clump 4; Cox & Bronfman 1995). The defiant finger seems to point toward its dominant UV source, and as such, allows for an interesting application of models of photoevaporating globules mentioned above. In §2 we discuss our observations, and in §3 and §4 we briefly discuss the results of our imaging and spectroscopy. In §5 we undertake a detailed analysis of the photoevaporative flow, and in §6 we discuss implications for potential star formation in the globule.
2 OBSERVATIONS AND DATA REDUCTION
2.1 HST/WFPC2 Images
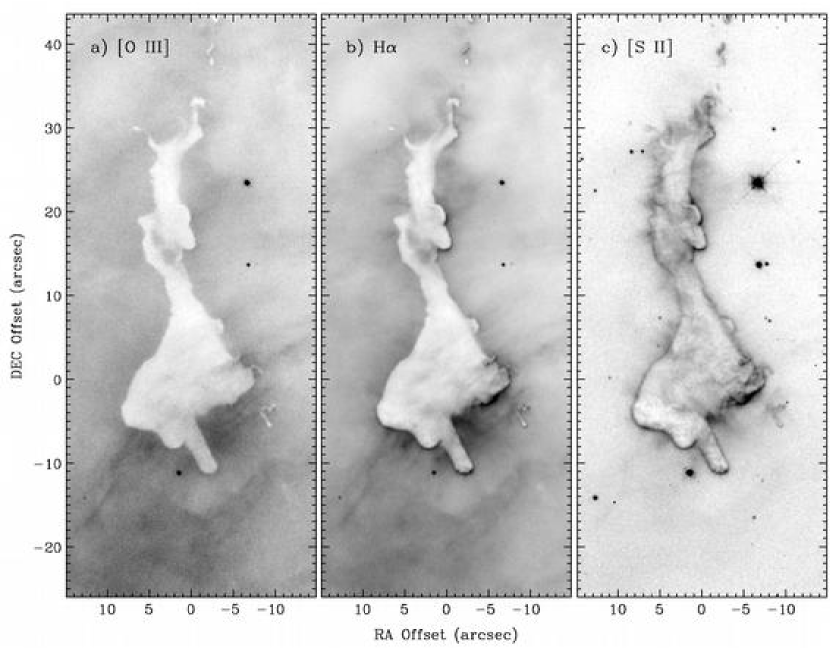
Images of the Keyhole Nebula were obtained on 1999 April 18 with the Wide Field Planetary Camera 2 (WFPC2) instrument onboard the Hubble Space Telescope (HST). Four different pointings were observed and combined to form a large mosaic image, which has been released by the Hubble Heritage Team111See http://oposite.stsci.edu/pubinfo/pr/2000/06/.. Here we focus on only a small portion of the total area observed, containing the globule that we call the Finger. Images were obtained through narrowband filters F502N ([O iii] 5007), F656N (H), and F673N ([S ii] 6717,6731), as well as the broadband filters F469W, F555W, and F814W. Only the emission-line images will be discussed here, however. Pairs of images in each narrowband filter were combined and processed in the usual way to remove cosmic rays and hot pixels, and to correct for geometric distortion, as described in the HST Data Handbook (however, the images were not CTE corrected). Finally, the individual frames were combined to form a single mosaic image with a pixel scale of 00995. Subsections of the images showing the region around the Finger are displayed in Figure 2, oriented with north up and east to the left.
2.2 Near-Infrared Images
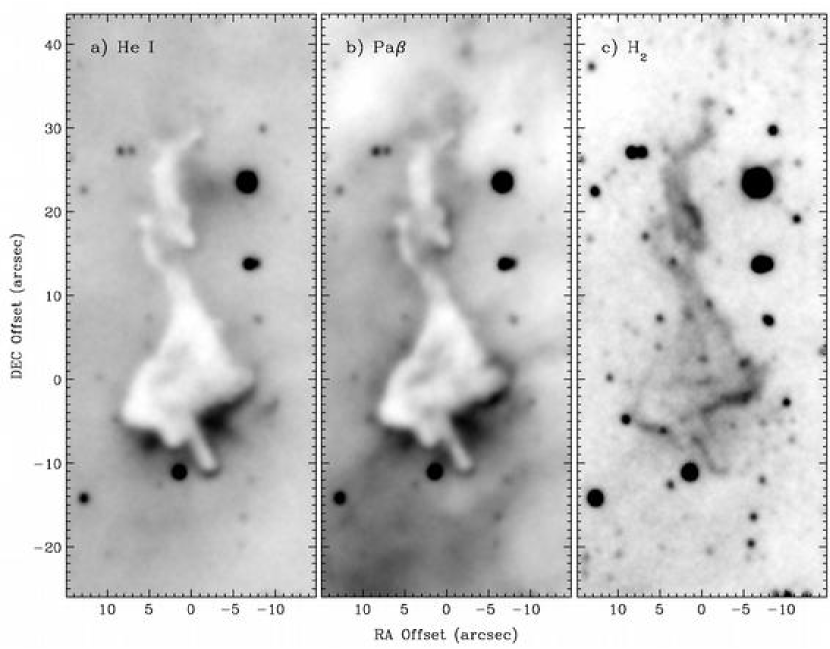
Near-infrared (IR) images of the Finger and its immediate environment were obtained on 2003 February 25 with the Ohio State IR Imaging Spectrometer (OSIRIS) mounted on the CTIO 4m telescope. OSIRIS has a 10241024 NICMOS3 array, with a pixel scale of 0161. Only a portion of the array is illuminated in this configuration, yielding a field of view of 15. We obtained images in the broadband , , and filters, as well as narrowband filters isolating He i 10830, Pa 12818, and H2 1-0 S(1) 21218. In each filter, several individual exposures were taken with small offsets between them to correct for bad pixels on the array. The seeing during the observations was 08. There is no position on the sky near the Finger that is suitable for measuring the background sky because of bright emission from the H ii region and nearby star clusters, so for sky subtraction we nodded the telescope to a position roughly 2 south. Flux calibration was accomplished by measuring isolated stars from the 2MASS catalog that were included in our field of view, and is valid to within about 10%. The IR images were aligned with the WFPC2 images and are shown in Figure 3.
2.3 Optical Spectroscopy
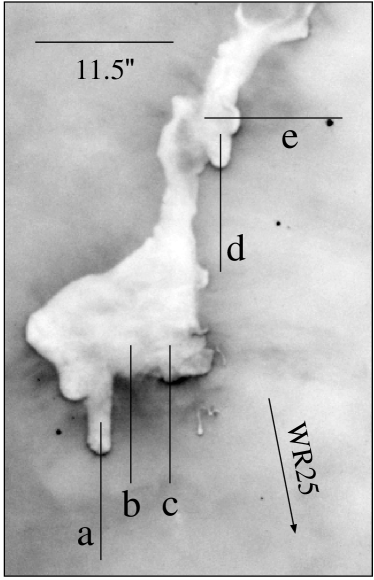
Low-resolution () spectra from 3600 to 9700 Å were obtained on 2002 March 1 and 2 using the RC Spectrograph on the CTIO 1.5-m telescope. Long-slit spectra of the Finger were obtained with the 15-wide slit aperture oriented at P.A.69 crossing through the middle of the globule as shown in Figure 1. The pixel scale in the spatial direction was 13. Spectra were obtained on two separate nights in two different wavelength ranges (blue, 3600-7100 Å; and red, 6250-9700 Å), with total exposure times and other details listed in Table 1. Sky conditions were mostly photometric, although a few thin transient clouds were present when the blue spectrum was obtained. Flux calibration and telluric absorption correction were accomplished using the standard stars LTT-3218 and LTT-2415.
From the resulting long-slit spectra, we extracted several one-dimensional (1-D) segments of the slit that sampled emission from the thin ionization front (IF), the ionized boundary layer (IBL), the total emission from the IF and IBL (TOT), and a nearby sample of the emission from the background Carina Nebula H ii region. The sizes of these subapertures are identified in Figures 1 and 5. The blue and red wavelength ranges of these extracted 1-D spectra were merged to form a single 3600-9700 Å spectrum for each position, with a common dispersion of 2 Å pixel-1; the average of the two was taken in the region of the spectrum near H where the blue and red spectra overlapped (in the overlap region, bright line fluxes agreed to within about 5%, comparable to the assumed uncertainty). Finally, the background H ii region spectrum was subtracted from the IF, IBL, and TOT spectra. The final flux-calibrated spectra are shown in Figure 5. Observed intensities are listed in Table 2, relative to H=100. Uncertainties in these line intensities vary depending on the strength of the line and the measurement method. The integrated fluxes of isolated emission lines were measured; for these, brighter lines with 10 typically have measurement errors of a few percent, and weaker lines may have uncertainties of 10 to 15%. The uncertainties increase somewhat at the blue edge of the spectrum. Blended pairs or groups of lines were measured by fitting Gaussian profiles. For brighter blended lines like H+[N ii] and [S ii], the measurement uncertainty is typically 5 to 10%. Obviously, errors will be on the high end for faint lines adjacent to bright lines, and errors will be on the low end for the brightest lines in a pair or group, or lines in a pair with comparable intensity.
3 IMAGING RESULTS
Figures 2, 3, and 4 show imaging data concentrated on a small region (less than 1 square arcminute) featuring the evaporating molecular globule that is the focus of this paper. Images showing the Keyhole Nebula and its environment on a much larger spatial scale but with lower spatial resolution, and using filters transmitting these same optical and IR emission lines, have been presented by Smith (2002), Brooks et al. (2000), Lopez & Meaburn (1984), Walborn (1975), and Deharveng & Maucherat (1975). Near-IR continuum images of the Finger will be discussed later in §6.

| (Å) | IF | IF | IBL | IBL | TOT | TOT | H ii | H ii |
|---|---|---|---|---|---|---|---|---|
| and I.D. | (Obs) | (Dered.) | (Obs) | (Dered.) | (Obs) | (Dered.) | (Obs) | (Dered.) |
| 3727 [O ii] | 312 | 436 | 105 | 146 | 178 | 248 | 93.0 | 130 |
| 3869 [Ne iii] | 9.9 | 13.3 | 16.2 | 21.9 | 14.0 | 18.8 | 15.0 | 20.1 |
| 3889 H8+He i | 19.1 | 25.5 | 22.2 | 29.7 | 21.7 | 29.0 | 20.2 | 27.1 |
| 3970 H+[Ne iii] | 18.1 | 23.7 | 19.2 | 25.2 | 20.0 | 26.2 | 20.6 | 27.1 |
| 4026 He i | 2.9 | 3.7 | 2.4 | 3.1 | 2.4 | 3.1 | 2.6 | 3.3 |
| 4073 [S ii] | 3.9 | 5.0 | … | … | 1.6 | 2.0 | 0.7 | 1.0 |
| 4102 H | 24.8 | 31.3 | 23.4 | 29.6 | 23.8 | 30.0 | 23.4 | 29.5 |
| 4340 H | 44.6 | 52.6 | 46.3 | 54.7 | 47.5 | 56.1 | 44.9 | 53.0 |
| 4363 [O iii] | 0.8 | 0.9 | 1.3 | 1.6 | 0.8 | 0.9 | 4.9 | 5.7 |
| 4387 He i | … | … | 0.9 | 1.1 | 0.8 | 0.9 | 0.5 | 0.6 |
| 4471 He i | 4.1 | 4.7 | 4.3 | 4.9 | 4.5 | 5.1 | 4.9 | 5.6 |
| 4861 H | 100 | 100 | 100 | 100 | 100 | 100 | 100 | 100 |
| 4922 He i | 1.6 | 1.6 | 1.5 | 1.5 | 1.3 | 1.3 | 1.6 | 1.5 |
| 4959 [O iii] | 51.7 | 50.1 | 83.8 | 81.2 | 77.1 | 74.7 | 99 | 96.1 |
| 5007 [O iii] | 161 | 153 | 254 | 242 | 236 | 225 | 300 | 286 |
| 5755 [N ii] | 3.22 | 2.5 | 0.8 | 0.6 | 1.5 | 1.2 | 0.7 | 0.56 |
| 5876 He i | 15.0 | 11.2 | 16.3 | 12.2 | 15.8 | 11.8 | 16.8 | 12.5 |
| 6300 [O i] | 5.1 | 3.4 | 1.3 | 0.9 | 2.2 | 1.5 | 0.9 | 0.6 |
| 6312 [S iii] | 2.5 | 1.7 | 1.4 | 0.9 | 1.6 | 1.1 | 1.4 | 1.0 |
| 6364 [O i] | 1.8 | 1.2 | 0.6 | 0.4 | 0.8 | 0.5 | 0.3 | 0.2 |
| 6548 [N ii] | 95.1 | 61.2 | 29.1 | 18.7 | 41.8 | 26.9 | 19.2 | 12.4 |
| 6563 H | 339 | 217 | 439 | 281 | 383 | 246 | 442 | 284 |
| 6583 [N ii] | 280 | 179 | 68.3 | 43.7 | 114 | 73.0 | 37.5 | 24.0 |
| 6678 He i | 3.4 | 2.1 | 6.2 | 3.9 | 5.4 | 3.4 | 6.3 | 3.9 |
| 6717 [S ii] | 33.7 | 20.9 | 10.4 | 6.5 | 15.3 | 9.5 | 7.0 | 4.4 |
| 6731 [S ii] | 47.7 | 29.6 | 11.4 | 7.1 | 19.2 | 11.9 | 5.9 | 3.6 |
| 7065 He i | 4.6 | 2.7 | 4.7 | 2.7 | 4.1 | 2.4 | 5.0 | 2.9 |
| 7136 [Ar iii] | 25.2 | 14.4 | 23.3 | 13.3 | 21.4 | 12.2 | 23.4 | 13.4 |
| 7237 [Ar iv] | … | … | 1.2 | 0.7 | … | … | 0.9 | 0.5 |
| 7281 He i | … | … | 1.1 | 0.6 | … | … | 1.3 | 0.7 |
| 7320 [O ii] | 22.5 | 12.4 | 4.0 | 2.2 | 7.6 | 4.2 | 1.5 | 0.8 |
| 7330 [O ii] | 20.4 | 11.2 | 3.1 | 1.7 | 6.7 | 3.6 | 1.3 | 0.7 |
| 7751 [Ar iii] | 6.6 | 3.3 | 5.9 | 3.0 | 5.8 | 2.9 | 6.2 | 3.1 |
| 7774 O i | … | … | 0.6 | 0.3 | … | … | 0.6 | 0.3 |
| 8446 O i | 3.9 | 1.7 | … | … | … | … | 1.1 | 0.5 |
| 8750 Pa12 | 2.4 | 1.0 | 2.6 | 1.1 | 2.3 | 1.0 | 3.4 | 1.4 |
| 8863 Pa11 | 3.4 | 1.4 | 3.0 | 1.2 | 2.5 | 1.0 | 4.0 | 1.6 |
| 9015 Pa10 | 7.2 | 2.8 | 7.2 | 2.8 | 6.0 | 2.3 | 6.5 | 2.6 |
| 9069 [S iii] | 68.1 | 26.6 | 66.3 | 25.9 | 59.4 | 23.2 | 86.9 | 34.0 |
| 9229 Pa9 | 6.9 | 2.6 | 7.2 | 2.7 | 5.8 | 2.2 | 7.6 | 2.9 |
| 9532 [S iii]+Pa8 | 219b | 79.7b | 215 | 78.5 | 145 | 52.8 | 300 | 110 |
| 9711 [Fe ii] | 16.1 | 5.7 | 13.2 | 4.7 | 12.4 | 4.4 | 9.3 | 3.3 |
a Observed line intensities were dereddened using the extinction
law of Cardelli et al. (1989), with =0.37 and .
b The intensity of [S iii] 9532 was assumed to be
3[S iii] 9069 in the IF spectrum, since that
line at that position partly fell on a bad pixel on the detector.
3.1 Emission Line Morphology of the Finger
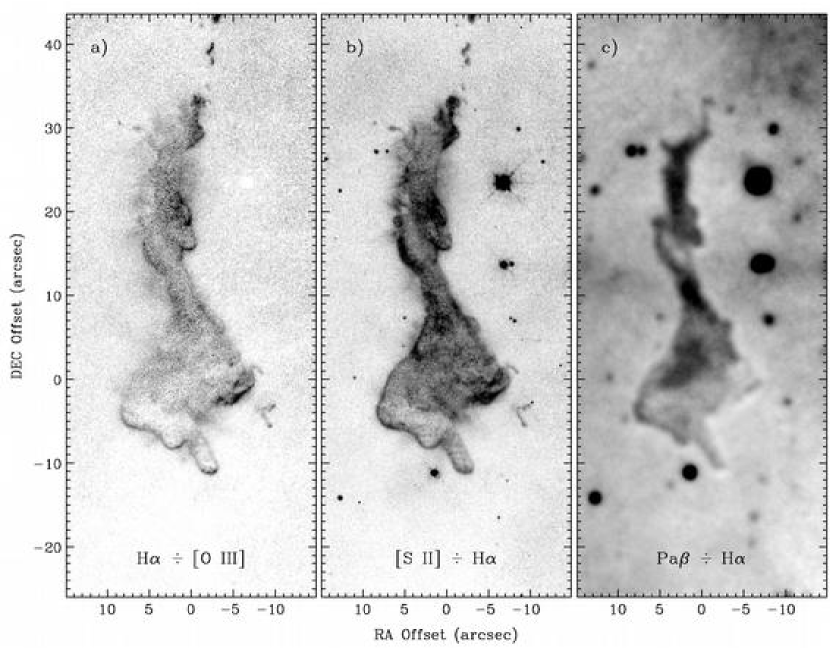
The overall morphology of the Finger in Figures 2 and 3 is quite striking, and consistent with the interpretation that the emission arises from the ionized evaporating flow and dense ionization fronts of an externally-illuminated molecular globule. The [O iii], H, and [S ii] images are reminiscent of many HST/WFPC2 images of dust pillars and globules in other H ii regions (e.g., Hester et al. 1996; Reipurth et al. 2003). Differences in the observed structure in various emission lines give interesting clues to the nature of the evaporating globule: In [O iii] emission, the Finger is seen almost exclusively as a silhouette against the bright background, except for a faint halo from the evaporated flow around the globule. In H, the emission from the evaporating halo material and extinction features are almost identical to [O iii], as the extended halo mostly disappears in the H[O iii] image in Figure 4. H is significantly stronger than [O iii] only near the sharp limb-brightened edges of the cloud, where strong [S ii] emission is also seen at the ionization front (i.e. the H[O iii] flux ratio image in Figure 4 looks nearly identical to the [S ii] image). The globule itself appears to be optically thick, especially at visual wavelengths where it totally obscures the background H ii region; the emission from [O iii] and H seen projected within the boundaries of the globule is due primarily to the ionized evaporating flow on the near side. The globule does not become transparent at near-IR wavelengths like the pillars in M16 (e.g., Thompson et al. 2002; McCaughrean & Andersen 2002). It is seen clearly as a silhouette in Pa, He i 10830, H, and [O iii], but is not a silhouette in [S ii] or H2 because the emission from the globule’s front surface is brighter than the background. This is especially clear from the [S ii]H ratio image in Figure 4. The spatially-resolved structure of the stratified ionization fronts and photoevaporating halo will be discussed in more detail in §5.
There appear to be two dominant locations of active photoevaporation where the surface of the globule is directly irradiated by individual stars; these are at the southern end of the globule (the “knuckles”, if the Finger globule is imagined to resemble a human hand), and at the western side of the northern part (the “wrist”). The activity in these two regions is highlighted best by emission from He i 10830 (Figure 3) and H2 (Figure 3). The He i line has a metastable lower level and is enhanced by collisions in dense ionized gas, such as that found in a dense ionized photoevaporative flow. H2 emission will be brightest in the photodissociation region (PDR) immediately behind the strongest ionization fronts, where a strong flux of FUV (Balmer continuum) photons penetrates, or where the gas is heated by a shock or Ly from the ionization front itself. Both He i and H2 are most prominent in the two regions mentioned above: the “knuckles” and the “wrist”. Relatively weak limb-brightened [S ii] emission is seen around the periphery of the globule, probably caused by the ambient UV field and Ly radiation.
The most obvious photoevaporating flow on the southern edge of the globule exhibits a thin straight finger protruding normal to a bright edge-on ionization front. This thin finger appears to identify its source of irradiation: It points toward P.A.=208, close to the massive star WR25 (HD 93162) at P.A.=219 relative to the Finger, although other early-type stars are seen along the same apparent trajectory. The ionizing source is addressed quantitatively in §5.2. Extending toward the south from this main ionization front is a large-scale ionized flow, prominent in [O iii], H, and Pa, where it fills the lower left corner in Figures 2, 2, and 3. About 6 from the end of the finger, one can see an arc-shaped structure in these same emission lines; the density here might be enhanced in a shock as the ram pressure of the photoevaporating flow off the globule balances the pressure of the ambient ionized gas in the H ii region. From conservation of momentum, this should occur at a distance from the globule’s center given roughly by , where and are the electron densities at the ionization front and in the H ii region, respectively, and is the radius of curvature of the ionization front. Electron densities are estimated below (Table 3), and the resulting distance is in reasonable agreement with the location of the shock.
Both of the main evaporating surfaces of the globule are found at relatively flat interfaces (a large effective radius of curvature). This may be an important factor in their enhanced emission, as the radial density profile will fall off more rapidly in a spherically divergent flow than from a planar ionzation front. The northern evaporative flow (the “wrist”) is particularly interesting, as it may be caused by a very nearby star – the bright B star located only 10 to the west (Tr16-207; see Figure 1).222Additionally, we note that the northern part of the globule appears to be curved with a radius of curvature of 10, and with Tr16-207 located at the center of curvature. The motivation for this conjecture is that both the He i and H2 emission are localized, while most of the rest of the western side of the globule also appears relatively flat and normal to the same direction. If the ionizing source were a luminous star at a large distance, we might expect to see a similar level of enhanced emission all along the western side of the globule. A third region of active photoevaporation may have a different UV source from the other two just mentioned; the southeast edge of the globule shows enhanced emission in [S ii] and H2, most notably on the east side of the thin finger, while such emission is not as strong on the west side of the same finger. The very luminous and massive evolved star Carinae is located toward the southeast; Car may have been a prodigious FUV source in the recent past (more than 160 years ago) before it was surrounded by its young circumstellar dust shell (Smith et al. 1998). The O4 V((f+)) star HDE 303308 is seen toward the east/southeast as well, and may add to the FUV flux striking the side of the Finger.
3.2 Proplyd Candidates?
The new HST/WFPC2 images also reveal a small group of distinct cometary clouds located immediately west of the Finger, the largest member of which has approximate dimensions of 052 (about 11004500 AU). This object closely resembles the numerous “proplyd candidates” seen throughout the Carina Nebula (Smith et al. 2003a). This object, which we denote 104430.2-593953 (following the naming convention of Smith et al. 2003a), is smaller than many of the other cometary objects in Carina, but is still larger than the proplyds seen in Orion and is apparently seen primarily in extinction and limb-brightened emission from H and [S ii]. The nature of these objects remains somewhat ambiguous (are they analogues of Orion’s proplyds, starless cometary clouds, or something in between?), but this image hints that an HST imaging survey of Carina would uncover many such objects that are missed in ground-based images.

4 SPECTROSCOPIC RESULTS
Figure 5 shows ground-based spectra extracted from the long-slit data for sub-apertures identified in Figure 1. The IF spectrum does not truly isolate emission from the thin ionization front on the surface of the globule because these ground-based data lack the requisite spatial resolution. However, emission in this sub-aperture is dominated by the limb-brightened emission from the IF; this is especially true for low-ionization lines like [S ii], whereas much of the emission in high-ionization lines like He i and [O iii] may originate in immediately adjacent regions. The IBL spectrum samples the more extended photoevaporated flow, or the ionized boundary layer that absorbs the hard UV photons incident upon the globule. The TOT spectrum includes both the IF and the IBL, and is mainly useful for comparison with some diagnostic line ratios mentioned later. Finally, the background spectrum of the Carina Nebula is shown for comparison; of course, this is a mixture of the high-ionization gas inside the H ii region with the ionization front and photodissociation regions on the far side of the nebula.
The most notable aspect of the IF spectrum is its low ionization, with strong [O ii] 3726,3729, [N ii] 6548,6583, and [S ii] 6717,6731 compared to H. These lines are typically enhanced at the ionization front or just beyond it if they are not collisionally de-excited; O has roughly the same ionization potential as H, the ionization potential of S is below 13.6 eV, and although the ionization potential of N is 14.5 eV, it can be ionized from the excited 2D state by photons with energies as low as 12.1 eV. The IBL spectrum is intermediate in ionization and excitation between the IF and the background H ii region, as expected. The IF and IBL spectra qualitatively resemble the low- and high-excitation spectra, respectively, of the similar photoevaporating globule in the nearby open cluster NGC 3572 (Smith et al. 2003b).
Table 2 lists observed and dereddened line intensities relative to H=100 for the various selected regions. The reddening used to correct the observed line intensities was determined by comparing observed strengths of hydrogen lines in the background H ii region to the Case B values calculated by Hummer & Storey (1987). As shown in Figure 6, the observed Balmer and Paschen decrements suggest a value for of roughly 0.370.03, using the reddening law of Cardelli, Clayton, & Mathis (1989) with , which is appropriate for local extinction from dust clouds around the Keyhole Nebula (Smith 1987; Smith 2002). The value of =0.37 we derive from nebular emission is close to the average value of 0.47, and within the range of values of 0.25 to 0.64, as listed for several bright O-type stars in Tr16 by Walborn (1995). Table 3 lists representative physical quantities like electron density and temperature derived from a standard deductive nebular analysis of the usual line ratios. These are useful to guide the interpretation of the physics of the ionization front and photoevaporative flow discussed below.
| Parameter | units | IF | IBL | Hii |
|---|---|---|---|---|
| ne [S ii] | cm-3 | 2200500 | 860200 | 23070 |
| Te [N ii] | K | 9700400 | 9800400 | 12000400 |
| Te [O iii] | K | 9700700 | 10000700 | 152001300 |
| Te [S iii] | K | 100001500 | 80001100 | 7200900 |
Values for TOT from lines in Table 2 are not shown here, because TOT contains distinct regions (IF and IBL) with different physical parameters.
5 ANALYSIS OF THE PHOTOEVAPORATIVE FLOW
Combining spectra with WFPC2 images that spatially resolve the stratified IF on the globule’s surface provides a powerful diagnostic tool, and allows us to undertake a detailed analysis of the photoevaporative flow and the incident UV field. From our narrowband images we made tracings of the observed intensity normal to the IF at five different positions around the Finger, indicated as through in Figure 7. The corresponding intensity tracings at these five postions are shown in Figure 8 to . Surface brightness in Figure 8 has been corrected for reddening and extinction, with =0.37 and =4.8.
5.1 The Stratified Ionization Fronts of the Finger
All the tracings in Figure 8 show the same general stratification with respect to the IF (at position=0), although there are some detailed differences. Starting from the left, H2 emission peaks 05 to 15 (1200 to 3500 AU at d=2.3 kpc) behind the IF, while [S ii], H, and Pa then rise sharply. [S ii] peaks at the IF and decreases exponentially thereafter, while hydrogen lines continue to rise, with their peak 025 outside the IF in most cases (except position ). [O iii] and He i rise sharply at the IF (due to extinction by dust), reach a broad peak (if any) outside the IF, and then decrease gradually at larger distances. The narrowest [S ii] zones with a FWHM of 05 are spatially resolved by HST, but the widths of some of the narrow Pa and He i zones are unresolved in the ground-based images.
Far from the IF (7) the intensities of H and [O iii] are roughly equal in each set of tracings. Then, moving toward the IF, the intensities of H and [O iii] diverge as hard photons capable of ionizing O+ to O2+ (with 35 eV) are eaten up by the photoevaporating flow and O2+ recombines (note the very strong [O ii] 3727,3729 at the IF in Figure 5 and Table 2). At the same time, the strength of [S ii] tends to increase in proportion to the difference between H and [O iii]. This is consistent with the qualitative similarity between the [S ii] image (Figure 2) and the [O iii]H ratio (Figure 4). Although every position shares the same basic behavior described above, there are differences among the five positions. In particular, the IF’s of and are much narrower than the other positions. The stratification at position is particularly broad. These differences are probably due to different radii of curvature (although position B may be affected by evaporation off the near side of the thin finger as well). For example, at the IF appears nearly straight, in stark contrast to the small radius of curvature at the end of the finger at position . In general, a smaller radius of curvature means that the photoevaporative flow diverges and the density drops faster than in a planar IF, so the stratified ionization structure is compressed. Both positions and seem to be nearly planar surfaces with a high-density flow extending far from the IF.

| Pos. | log10() | Spectral | |||
|---|---|---|---|---|---|
| (a) | (1016 cm) | (cm-3) | (s-1 cm-2) | Typeb | |
| a… | 6.5 | 3.5 | 6200 | 11.06 | O7.5 |
| b… | 5.5 | 10.4 | 3300 | 10.99 | O6.5 |
| c… | 7.0 | 6.9 | 4600 | 11.09 | O7 |
| d… | 6.0 | 3.5 | 6000 | 11.03 | O7.5 |
| e… | 3.0 | 10.4 | 2400 | 10.73 | B0 |
a 10-13 erg s-1 cm-2 arcsec-2. This H
intensity may be contaminated somewhat by [N ii] 6583
incuded in the F656N filter; this effect is strongest at the IF.
Using the [N ii]/H ratio for the IF spectrum from Table
2, combined with the transmission curve of the F656N filter of HST/WFPC2, we estimate that [N ii] contributes less than about
5% of the measured H flux at the IF.
b See Sankrit &
Hester (2000).
5.2 Does WR 25 Ionize the Finger?
As noted earlier, the finger at the southern end of the globule seems to point toward the luminous WNL star WR25 (HD 93162), but since some other luminous early-type stars are seen along this same general trajectory, this relationship should be tested quantitatively. By examining the properties of the IF and photoevaporative flow from the globule, we can estimate the necessary ionizing photon flux and the shape of the incident continuum. These can then be compared to likely values for candidate sources.
The electron density at the IF is the critical quantity for estimating the flux of ionizing photons striking the globule if we assume that the recombination rate roughly balances ionizations. From the ratio [S ii] 67176731 we find 2200 cm-3 in the thin [S ii] emitting region on the surface of the globule (see Table 3). However, this is only the value near position , which may be somewhat unusual because of its nearly planar geometry, as noted earlier, and ground-based spatial resolution in these spectra does not effectively sample the highest density at the thin IF. At and other positions , , , and , the electron density at the IF can be estimated independently using the extinction-corrected H surface brightness in Figure 8. If we assume , and adopt a reasonable estimate of the depth of the emitting layer333The values of are determined from images in a somewhat subjective manner, and the uncertainties will be smallest for the ionization fronts at positions and , which have the least ambiguous geometry. along the line of sight , then we have
| (1) |
where 10-14 cm3 s-1 for T104 K (Osterbrock 1989), and 2062652 just converts from arcsec-2 to sr-2 so that we can simply use values gleaned from Figure 8. Adopted values of , , and are listed in Table 4. Since derived from images is somewhat higher than that derived from the [S ii] lines for position , as we would expect if [S ii] lines trace a region where hydrogen already has a large neutral fraction, we take the values for in Table 4 as more reliable estimates of the IF density. We can then use these values of to estimate the number of ionizing photons incident on an IF of radius per second and per unit area if we assume that ionizations are approximately balanced by recombinations at the IF, so that we have
| (2) |
where 10-13 cm3 s-1 is the total case B hydrogen recombination coefficient for T104 K (Osterbrock 1989). To calculate for the five positions listed in Table 4, we assumed the characteristic thickness of the recombination front is , which seemed a fair approximation based on the width of the limb-brightened surfaces seen in images. Judging by the morphology observed in Figure 2, positions through all have the same ionizing source, and Table 4 indicates that all these positions have roughly the same incident flux of ionizing photons, with an average of log10()=11.04 s-1 cm-2. Position has a lower incident UV flux, with log10()10.7 s-1 cm-2. The disagreement between the values of for positions through compared to is consistent with the apparent morphology in Figure 2, where position seems to have a different UV source.
The shape and relative intensities of various lines in Figure 8 can also be used to constrain the spectral type of the ionizing star, by comparison to detailed emission models of photoevaporative flows. Sankrit & Hester (2000; SH hereafter) modeled ionized photoevaporative flows as seen in the same optical emission line tracers as we observed with HST. SH found that while the maximum density at the IF depends on the total ionizing flux but not on the shape of the incident continuum, the ratio of [O iii] to H is sensitive to the spectral type of the ionizing star. In Table 4 we list spectral types of the ionizing stars inferred from values of the peak [O iii]H ratio for positions through , corresponding to the models of SH with log10()11 s-1 cm-2 for positions through , and log10()10.7 s-1 cm-2 for position (see their Figure 8). We regard these characteristic spectral types as very rough estimates; they should be taken as representing the approximate ratio of photons with 35 eV to those with 13.6 eV, rather than the actual spectral type of a main sequence star (SH also noted that the derived properties differed depending on the type of model atmosphere used).444When interpreting the characteristic spectral types, one should also keep in mind recent revisions to the scale for O stars (e.g., Martins et al. 2002). This is especially relevant to the possibility of WR25 as the ionizing source, as it is not a main-sequence star and has a strong wind ( M⊙ yr-1; Crowther et al. 1995). Also, these characteristic spectral types may underestimate the actual hardness of the source energy distribution, since hard photons may be absorbed in the ambient material between the star and the Finger or by dust in the photoevaporative flow itself. In general, the peak [O iii]H ratios for positions through are consistent with a characteristic spectral type of O7 or O7.5, according to the models by SH, while position requires a source with a spectral type later than B0 (an [O iii] peak is weak or non-existent at position ).
| Star | Spectral | P.A. | log10(QH) | |
|---|---|---|---|---|
| Type | (deg) | (parsec) | (s-1) | |
| WR25 | WNL | 219 | 2.82 | 50.1 |
| Tr16-244 | O4 If | 215 | 2.71 | 49.9 |
| HD 93205 | O3.5 V ((f)) | 176 | 2.96 | 49.5 |
| HD 93204 | O5 V ((f)) | 179 | 3.12 | 49.2 |
| -592574 | B1-B1.5 V | 209 | 0.87 | 46.5 |
Spectral types are taken from Walborn et al. (2002) and Massey & Johnson (1993), is the projected separation from the Finger measured in images, and ionizing photon fluxes for spectral types are taken from Smith et al. (2002), except for WR25 where QH is from models by Crowther et al. (1995). Also, HD 93205 is a binary, actually classified as O3.5 V ((f)) + O8 V, but the hotter component dominates the ionizing luminosity.
Figure 9 shows the hydrogen-ionizing photon luminosity Q that would be required at a distance to produce a flux of log10()=11.04 s-1 cm-2 at the surface of the Finger. This is compared to the actual values of QH and for stars that are potential sources of the UV flux evaporating the Finger. values are taken from Smith et al. (2002) for the corresponding spectral type. For WR25 we adopted from the models by Crowther et al. (1995; Crowther, private comm.; models by Smith et al. 2002 and Crowther et al. 1995 include line blanketing.) The positions of these candidate source stars are identified in Figure 1 and their properties are collected in Table 5. Figure 9 shows two values for : the separation on the sky given in Table 5, and a value that is a factor of larger to account for a possible projection effect. From Figure 9 we conclude that the dominant source of ionization for the Finger is either the WNL star WR25 (Crowther et al. 1995) or the neighboring O4 If star Tr16-244 (star number 257 of Massey & Johnson 1993) — or perhaps both working together. It is somewhat unsettling that the thin Finger appears to point toward a slightly skewed position angle of 208, while WR25 is found at P.A.=219 and Tr16-244 is at P.A.=215, relative to the Finger; one might expect a feature like the Finger to point directly toward its UV source. However, other factors may affect the appearance of photoionized columns as well (see Williams et al. 2001; Cantó et al. 1998). The Finger does point almost exactly at CPD 592574, but as an early B star, it does not even come close to providing the required ionizing flux (Figure 9). Located directly south of the Finger, the massive hot stars HD 93204 and HD 93205 also provide insufficient ionization.

One further complication, however, is that the ionizing continuum striking the Finger appears to be softer than that produced by either WR25 or Tr16-244. The spectral type inferred from the [O iii]H ratio at the IF is only about O7 (Table 4), whereas both likely UV sources have much earlier spectral types. We have not considered the effect of the strong X-ray flux from WR25 (e.g., Raassen et al. 2003; Seward et al. 1979). Since there are no other plausible sources of ionization in this direction, this suggests that the incident radiation field is softened as it passes through the nebula and the IBL on its way to the Finger. From the spectrum of the IBL we would derive an earlier spectral type from the [O iii]H ratio than in the thin IF itself (Figure 5 and Table 2).
5.3 Mass-Loss Rate and Lifetime
From 12CO(2-1) observations, Cox & Bronfman (1995) estimated a characteristic mass for the Finger of 6 M⊙, but because the emission sampled mostly the warm surface of the cloud, they noted that the total mass of the globule is probably 10 to 20 M⊙. This mass provides the reservoir for future photoevaporation, and allows us to estimate a likely evaporation timescale for the cloud. If the evaporation of the cloud is dominated by the brightest southern IF, and if the geometry can be approximated as a cylinder illuminated on one side, the mass loss rate is given roughly by
| (3) |
where is the characteristic radius of curvature of the cloud appropriate for the apparent size of the IF (1017.3 cm), and is the speed of the evaporative flow through the IF. The electron density at the main evaporating surface (positions and ) is 4000 cm-3 (Table 4), while right at the IF itself we typically have because the gas is not fully ionized (e.g., SH). If we assume that the material expands away from the ionization front at the isothermal sound speed (10 km s-1), then M⊙ yr-1. In that case, the remaining lifetime of the entire cloud is 105.3 to 106 years; about 15% to 30% of the age of the nebula. The Finger and other associated molecular clumps probably represent the last vestiges of the original molecular cloud core that spawned Tr16, while significant reservoirs for future star formation exist in the neighboring giant molecular cloud (Grabelsky et al. 1988).
6 STAR FORMATION IN THE FINGER?
In addition to the emission-line images described above, near-IR images in the , , and broadband filters were obtained. A few reddened sources with 14 were detected within the boundaries of the globule, but these were positioned randomly and could easily be chance alignments of background sources (these point sources can be seen in the 2.122 H2 image in Figure 3). A few of these -band sources seem preferentially located near the limb-brightened edges of the globule, but no reddened stars were detected near the southern ionization front or inside the thin “finger” protruding from it, as one might have expected. However, that doesn’t necessarily mean that no stars are currently forming here or that no stars will form in the future. Below we estimate the amount of extinction in the Finger and the -band source that could be hidden, as well as other pertinent quantities like the column density and mass in the Finger and its associated globule. Then we discuss implications for current and future star formation in this globule.

6.1 Extinction and Dust Mass
The Finger globule is seen as a silhouette in [O iii], H, He i 10830, and Pa, so tracings through the globule in these emission lines can be used to estimate the optical depth, mass column density, and total mass of the globule. Figure 10 shows representative cross-cuts through the middle of the globule and through the thin finger (perpendicular to tracing “a” in Figure 7). Differences in spatial resolution between the HST and ground-based data aside, it is clear that the minimum emission intensity in the center of each tracing increases with wavelength. Thus, the globule becomes translucent at the longer near-IR wavelengths. Interpreting these tracings is not entirely straightforward, however, because the Finger is not a simple silhouette blocking light from a background source — instead, it is a bright-rimmed globule suspended inside the H ii region. Thus, some fraction of the observed minimum intensity originates along our line-of-sight to the Finger or near its surface. For example, it would not be unreasonable to assume that roughly half the intensity for each line in Figure 10 is foreground emission. Since the globule has a flat-bottom profile and negligible limb brightening in [O iii], we can make a crude correction for this foreground emission if we assume that the globule is optically thick and “black” in the [O iii] line. Then, the effective transmission at a given wavelength is given by , where is the minimum flux in the [O iii] line in the middle of the globule. Contamination from the IBL is probably worst in H and Pa, so using the He i 10830 line, we estimate an effective transmission through the middle of the globule of roughly 30%, and a corresponding optical depth () of 1.2 at a wavelength of 1.08 . Similarly, for the thin finger we estimate a slightly higher of 1.5 at 1.08 . The dust-mass column density is given by
| (4) |
where is the assumed grain radius (large grains dominate the opacity), 1 g cm-3 is the average grain mass density, and =0.04 is the extinction coefficient at 1.08 (e.g., Draine & Lee 1984). Then, with at 1.08 , we have characteristic dust-mass column densities of 4 to 510-4 g cm-2. If we integrate over the entire projected area of the globule, and assume a typical gas:dust mass ratio of 100:1 (this is the dominant source of uncertainty), then we find a total mass for the Finger globule of 6 to 8 M⊙. Likewise, the mass of the small clump at the end of the thin finger is of order 0.1 to 0.2 M⊙. The corresponding hydrogen column density through the globule is 2 to 31022 cm-2.
The excellent agreement with the mass of 6 M⊙ derived for the globule by Cox & Bronfman (1995) is fortuitous, given the large inherent uncertainty in the assumed gas:dust mass ratio. In fact, just as Cox & Bronfman noted that their value was an underestimate because the CO emission was dominated by warm outer layers of the globule, ours is probably an underestimate because some parts of the finger may be optically thick even at 1 to 2 and may hide additional mass.
In our images, the -band detection limit for point sources projected against the uneven background emission associated with the Finger globule is 17. The extinction estimated above could then hide an intrinsic 15.5 source from detection. At 2.3 kpc, this corresponds to an absolute magnitude of roughly 3.5 to 4, or a young star of roughly 0.3 to 0.5 M⊙. (Note that this is comparable to the minimum mass of dust and gas within the end of the thin finger.) Considering our detection limit we cannot rule out the possibility that a low-mass star has already formed at the end of the finger, so deeper images with high spatial resolution are desirable.
6.2 Future Star Formation in the Finger?
Even though we have found no direct evidence for newly-formed stars within the Finger, this globule and others like it in Carina may still be likely sites of future star formation. In §5.3 we found that the remaining lifetime before the globule evaporates away is of order 105.3 to 106 years, which is longer than the average free-fall time for the whole globule, and is plenty of time to allow a dense clump to collapse and form a protostar that would survive exposure to the interior of the H ii region. Thus, it is worth a closer look at the physical conditions within the globule and its advancing IF. In particular, we ask whether the formation of a star may be triggered by radiation-driven implosion. We consider two cases: the main southern IF working on the body of the globule, and the end of the thin finger protruding from it.
6.2.1 The Main Ionization Front
With a characteristic radius of 10 or 31017 cm, the Jeans mass for the whole globule is 2 M⊙ (T/10 K). Thus, with a temperature of 10 - 40 K (e.g. Cox & Bronfman 1995), a mass larger than 6 M⊙ makes it plausible that the globule can collapse to form stars — or at least, one could argue that the globule is on the verge of collapse under self gravity, neglecting rotation and magnetic support. Thus, external pressure may play an important role in the globule’s future.
When evaluating if radiation-driven implosion is important, we must consider pressure balance between the ionization front (Pif) and the pressure inside the neutral globule (P0). We have
| (5) |
| (6) |
where is the back pressure from the photoevaporative flow launched from the IF (roughly equal to ), is the mass density, is the mean molecular weight, is the inferred turbulent pressure of the molecular gas, and the last term in equation (6) is the magnetic pressure inside the cloud. The electron density and temperature of the IF are roughly 4000 cm-3 and 104 K (Tables 3 and 4), respectively, the average mass density inside the cloud is 210-19 g cm-3 (see §6.1), and is roughly 1.1 km s-1 inferred from CO line widths of 2.7 km s-1 (Cox & Bronfman 1995). If we neglect magnetic fields555Note that turbulence dominates over thermal pressure, and we have neglected rotation because the straight edges of the thin finger protruding from the globule suggest that it has maintained the same orientation for its evaporation timescale of 105 years., we find . Thus, a significant external overpressure may be causing the globue to collapse. If magnetic pressure is to support the globule, the perpendicular component of the magnetic field that would be required is 510-4 G. Interestingly, in their analysis of the pillars of the Eagle Nebula, White et al. (1999) find a similar field of G (in fact, many of the physical parameters of the Finger resemble those estimated for the M16 pillars). However, as noted by those authors, a field of this strength would broaden the observed line width to 4 km s-1 because of Alfvenic motions, which is broader than the CO linewidth of 2.7 km s-1 reported by Cox & Bronfman (1995) for the Finger. Thus, we find it likely that radiaton-driven implosion at the IF may be triggering the formation of low-mass stars in the globule.
6.2.2 The Thin Finger
The thin finger protruding from the IF presents a somewhat different case, because it is smaller and denser than the main globule. One might expect that it was much denser than its intial surroundings, and that it has come into pressure equilibrium with the IF, since it has obviously resisted evaporation more than adjacent areas of the initial cloud (see also Williams et al. 2001). We approximate the end of the thin finger as a spherical globule with radius 51016 cm, a mass of 0.2 M⊙ (see §6.1), and a corresponding mass density of 10-18 g cm-3. The Jeans mass is then 0.3 M⊙ (T/10 K), and again, we find it plausible that the dense clump may be in the process of collapsing to form a star — especially if 0.2 M⊙ is an underestimate of the clump’s mass because of high optical depth as noted earlier. Following the analysis above, we find . This is considerably more uncertain than for the main globule above, because turbulence dominates the internal pressure, and we do not know to what extent the value of used above applies to the small fingertip (this uncertainty also precludes a meaningful estimate of the magnetic field needed to halt collapse). Thus, the most likely scenario may be that the fingertip is in pressure equilibrium, and that a slowly-advancing D-type (dense) IF is eating into the fingertip, and the shock from the IF has long ago passed through the clump. If a star is to form here, the process should already be underway. The fingertip may contain a faint low-mass protostar that has escaped detection in our images, or it may have a very young Class 0 protostar. In the latter case, thermal IR emission from a dense hot core would be difficult to detect, as it would be masked by thermal emission from the adjacent warm IF and PDR.
7 CONCLUSIONS
We have presented optical narrow-band HST/WFPC2 images, ground-based optical spectra, and near-IR images of the “Finger” – a photoevaporating molecular globule in the core of the Carina Nebula. The main conclusions of this work are the following:
1. The Finger globule exhibits an interesting morphology, with a thin extended middle finger apparently pointing toward its source of ionizing photons. The spatially-resolved structure of the stratified ionization fronts are consistent with the interpretation of the Finger as an optically-thick photoevaporating molecular globule, similar to structures often seen in HST images of H ii regions.
2. Quantitatively, electron densities and the corresponding flux of ionizing photons incident upon the southward-facing ionization fronts of the Finger indicate that the dominant UV source is either WR25 (a late-type Wolf-Rayet star), Tr16-244 (O4 If), or perhaps both. This is reassuring, since the finger points to within a few degrees of these stars.
3. The mass-loss rate for the main evaporating surface of the globule is of order 210-5 M⊙ yr-1.
4. From extinction measurements, we estimate an average hydrogen column density of a few times 1022 cm-2 through the globule, and a total mass (assuming a gas:dust mass ratio of 100:1) of at least 6 M⊙, in agreement with independent estimates from molecular studies. This is an underestimate if the globule contains clumps that are optically-thick in the near-IR.
5. The remaining lifetime of the globule before it is evaporated away is of order 105.3 to 106 years.
6. Several reddened stars are seen projected within the boundaries of the Finger globule, but whether or not these sources are newly-formed stars that are physically associated with the globule is uncertain. No reddened star is seen at the apex of the thin protruding finger or immediately behind the main ionization front, down to a limit of .
7. Considering the properties of the advancing ionization front, it appears likely that stars are currently forming or will soon form in the globule, triggered by radiation-driven implosion. At the main ionization front we find an external overpressure of a factor of 5, and a smaller overpressure (1) at the end of the thin finger.
ACKNOWLEDGMENTS
We thank John Bally for supplying the ground-based [S ii] image used in Figure 1, and we benefitted from helpful discussions with Paul Crowther regarding models of WR25. Support was provided by NASA through grant HF-01166.01A from the Space Telescope Science Institute, which is operated by the Association of Universities for Research in Astronomy, Inc., under NASA contract NAS 5-26555. NOAO funded N.S.’s travel to Chile and accommodations while at CTIO. Some travel support was also provided by NASA grant NAG-12279 to the University of Colorado.
References
- [] Bertoldi, F. 1989, ApJ, 346, 735
- [] Bertoldi, F., & McKee, C.F. 1990, ApJ, 354, 529
- [] Bertoldi, F., & Draine, B.T. 1996, ApJ, 458, 222
- [] Bok, B.J., & Reilly, E.F. 1947, ApJ., 105, 255
- [] Brooks, K.J., Burton, M.G., Rathborne, J.M., Ashley, M.C.B., & Storey, J.W.V. 2000, MNRAS, 319, 95
- [] Cantó, J., Raga, A.C., Steffen, W., Shapiro, P.R. 1998, ApJ, 502, 695
- [] Cardelli, J.A., Clayton, G.C., & Mathis, J.S. 1989, ApJ, 345, 245
- [] Cox, P., & Bronfman, L. 1995, A&A, 299, 583
- [] Crowther, P.A., Smith, L.J., Hillier, D.J., & Schmutz, W. 1995, A&A, 293, 427
- [] Deharveng, L., & Maucherat, M. 1975, A&A, 41, 27
- [] Draine, B.T., & Lee, H.M. 1984, ApJ, 285, 89
- [] Dyson, J.E. 1973, A&A, 27, 459
- [] Dyson, J.E.. et al. 1995, MNRAS, 227, 700
- [] Elmegreen, B.G. 1976, ApJ, 205, 405
- [] Gorti, U., & Hollenbach, D. 2002, ApJ, 573, 215
- [] Grabelsky, D.A., Cohen, R.S., Bronfman, L., & Thaddeus, P. 1988, ApJ, 331, 181
- [] Hawarden, T.G., & Brand, P.W.J.L. 1976, MNRAS, 175, 19
- [] Herbig, G.H. 1974, PASP, 86, 604
- [] Hester, J.J., et al. 1996, AJ, 111, 2349
- [] Hummer, ,D.G., & Storey, P.J. 1987, MNRAS, 224, 801
- [] Kahn, F.D. 1969, Physica, 41, 172
- [] Lizano, S., Canto, J., Garay, G., & Hollenbach, D. 1996, ApJ, 468, 739
- [] López, J.A., & Meaburn, J. 1984, MNRAS, 211, 267
- [] Martins, F., Schaerer, D., & Hillier, D.J. 2002, A&A, 382, 999
- [] Massey, P., & Johnson, J. 1993, AJ, 105, 980
- [] McCaughrean, M.J., & Andersen, M. 2002, A&A, 389, 513
- [] Oort, J.H., & Spitzer, L. 1955, ApJ, 121, 6
- [] Osterbrock, D.E. 1989, Astrophysics of Gaseous Nebulae and Active Galactic Nuclei (Mill Valley: University Science)
- [] Raassen, A.J.J., van der Hucht, K.A., Mewe, R., Antokhin, I.I., Rauw, G., Vreux, J.M., Schmutz, W., & Güdel, M. 2003, A&A, 402, 653
- [] Rathborne, J.M., Burton, M.G., Brooks, K.J., Cohen, M., Ashley, M.C.B., & Storey, J.W.V. 2002, MNRAS, 331, 85
- [] Reipurth, B. 1983, A&A, 17, 183
- [] Reipurth, B., Raga, A., & Heathcote, S. 2003, AJ, 126, 1925
- [] Sankrit, R., & Hester, J.J. 2000, ApJ, 535, 847
- [] Seward, F.D., et al. 1979, ApJ, 234, L55
- [] Smith, L.J., Norris, R.P.F., & Crowther, P.A. 2002, MNRAS, 337, 1309
- [] Smith, N. 2002, MNRAS, 331, 7
- [] Smith, N., Bally, J., & Brooks, K.J. 2004, AJ, in press
- [] Smith, N., Bally, J., & Morse, J.A. 2003a, ApJ, 587, L105
- [] Smith, N., Gehrz, R.D., & Krautter, J. 1998, AJ, 116, 1332
- [] Smith, N., Morse, J.A., Bally, J., & Phelps, R.L. 2003b, PASP, 115, 342
- [] Smith, R.G. 1987, MNRAS, 277, 943
- [] Thackeray, A.D. 1950, MNRAS, 110, 529
- [] Thompson, R.I., Smith, B.A., & Hester, J.J. 2002, ApJ, 570, 749
- [] Walborn, N.R. 1975, ApJ, 202, L129
- [] Walborn, N.R. 1995, RevMexAA, Ser. Conf., 2, 51
- [] Walborn, N.R., et al. 2002, AJ, 123, 2754
- [] White, G.J., et al. 1999, A&A, 342, 233
- [] Williams, R.J.R. 1999, MNRAS, 310, 789
- [] Williams, R.J.R., Ward-Thompson, D., & Whitworth, A.P. 2001, MNRAS, 327, 788