2004 \SetConfTitleSecond International Workshop on Science with the GTC
Star-Forming Galaxies at : a major science case for the EMIR/GOYA survey on GTC
Abstract
We present the first results of a project aiming to derive the physical properties of high-redshift lensed galaxies, intrinsically fainter than the Lyman break galaxies currently observed in the field. From FORS and ISAAC spectroscopy on the VLT, we use the full rest-frame UV-to-optical range to derive the physical properties (SFR, extinction, chemical abundances, dynamics, mass, etc) of low-luminosity star-forming galaxies. Although the sample is still too small for statistical studies, these results give an insight into the nature and evolutionary status of distant star-forming objects and their link with present-day galaxies. Such a project will serve as a basis for the scientific analysis of the EMIR/GOYA survey on the GTC.
galaxies: evolution \addkeywordgalaxies: starburst \addkeywordgalaxies: abundances \addkeywordgalaxies: infrared \addkeywordgalaxies: kinematics and dynamics
0.1 Motivations
Obtaining statistically significant samples of galaxies, from the local Universe to the highest redshifts, is mandatory to constrain the models of galaxy formation and evolution. Large spectroscopic samples of galaxies at all redshifts have become available during the last ten years, thanks to massive surveys in the different rest-frame wavelength domains (e.g. Lilly et al. 1995; Steidel et al. 1996, 1999, 2004; Colless et al. 2001; Pettini et al. 2001; Schneider et al. 2003). The evolution of the physical properties of galaxies as a function of redshift is particularly important for galaxies at z 1, a redshift domain where galaxies are expected to be strongly affected by merging or assembly processes.
In this context, massive clusters acting as Gravitational Telescopes (GTs) constitute a powerful tool to study the high-redshift Universe. They have been successfully used over a wide range of wavelengths, ranging from the UV to the sub-mm (e.g. Pelló et al. 2003 and references therein) and allowed recently the detection of the most distant galaxies known so far (; Pello et al. 2004; Kneib et al. 2004; see also the contribution by R. Pello in these proceedings). The large magnification factors of galaxies that are close to the critical lines (typically 1 to 3 magnitudes) can be used to probe the physical properties of intrinsically faint high-redshift galaxies, which would otherwise be beyond the limits of conventional spectroscopy (e.g. Ebbels et al. 1996; Pelló et al. 1999, Pettini et al. 2000, Mehlert et al. 2001).
The recent development of near-IR (NIR) spectrographs on 10m-class telescopes has allowed the study of the rest-frame optical properties of high-redshift galaxies. Indeed, NIR spectroscopy allows to access the most relevant optical emission lines (, , [O ii] 3726,3728, [O iii] 4959,5007, etc), in order to probe the physical properties of galaxies (SFR, reddening, chemical abundances, kinematics, virial mass, etc), all the way from the local universe to , using the same parameter space and indicators. The pioneering work by Pettini and collaborators (1998, 2001) has shown that the rest-frame optical properties of the brightest Lyman break galaxies (LBGs) at are relatively uniform. A new sample of 16 LBGs at has been recently published by Erb et al. (2003) and, in this case, significant differences are found in the kinematics of galaxies at compared to .
However, the current studies of the high-redshift Universe are limited to the most luminous/massive galaxies (). Moreover, the redshift interval (the so-called “redshift desert”) remains relatively poorly known because of the lack of strong spectral features that can be used to identify sources at such redshift. We thus started, about two years ago, an observational program to perform a detailed study of the physical properties for a significant sample of amplified high-redshift galaxies by using the full rest-frame UV/optical spectral features (observed in the optical/NIR domains respectively) in order to build a comprehensive picture of the nature of the low-luminosity galaxy population at .
In this paper, we present the first results obtained on three galaxies at from our ongoing spectroscopic program with FORS and ISAAC on the VLT (Lemoine-Busserolle et al. 2003, 2004; Le Borgne et al. 2004). Our ultimate objective is to obtain rest-frame UV and optical spectroscopy for a sample of 15 gravitationally amplified high-redshift galaxies to study their physical properties. This project can be considered as a pilot program for the future NIR multi-object spectrograph EMIR on GTC.
0.2 Physical properties from the rest-frame UV-to-optical spectra


Both rest-frame UV (Leborgne et al. 2004; Lemoine-Busserolle et al. 2004) and rest-frame optical (Lemoine-Busserolle et al. 2003, 2004) spectra have been obtained on three lensed galaxies at using FORS and ISAAC respectively on the VLT.
Examples of -bands ISAAC spectra are shown in Fig. 1 for the lensed galaxies S2 and A2 located behind the massive cluster AC 114 (). Relatively long integration times (typically 3-5 hours per band) are mandatory to get high enough S/N ratios. The brightest rest-frame optical emission lines ([O ii] 3726,3728, [O iii] 4959,5007, and ) are clearly detected and measured in these spectra, as well as in the spectrum of the giant blue arc (, hereafter Cl2244-gA) located behind the lensing cluster Cl 2244-02 (). emission-line is not seen in these spectra as it falls at the blue edge of the band. The [N ii] 6584 is detected only in the spectrum of A2; an upper limit for the flux of this line has been derived for A2 and Cl2244-gA. Measuring this nitrogen line is very important to break the degeneracy between the oxygen abundance O/H and the strong emission-line intensity in order to get an accurate value of the metallicity. The analysis of rest-frame optical emission lines is fully described in Lemoine-Busserolle et al. (2003). We have been able to derive accurate measurements of the oxygen abundance O/H (as indicator of metallicity), the nitrogen-to-oxygen abundance ratio N/O, the SFR from luminosities, and the virial masses from the FWHM of the brightest emission lines ([O iii] 4959,5007, and ). Moreover, thanks to the gravitational amplification, the line profiles of S2 are spatially resolved, leading to a velocity gradient of km s-1, which yields a dynamical mass for this galaxy of M⊙ within the inner 1 kpc radius (Lemoine-Busserolle et al. 2003).
The rest-frame UV spectra of two lensed galaxies are shown in Leborgne et al. (2004) for S2 and Lemoine-Busserolle et al. (2004) for Cl2244-gA. These spectra have been mainly used to constrain i) the age od the star-forming events by a detailed model fit of the C iv 1550 and Si iv 1527,1533 lines, ii) the overall dust extinction using the observed SED (rest-frame UV-to-optical range) and the latest version of the Bruzual & Charlot (2003) population synthesis models, and iii) an independant estimate of the (stellar) metallicity using both the UV continuum slope and the strength of the interstellar absorption lines.
All the relevant physical parameters of the three lensed galaxies, derived from both the rest-frame UV and optical spectra, are summarized in Table 1.
9 Galaxy E(B-V) Age [mag] [Myr] [km s-1] [ M⊙] AC114-S2 1.87 0.2 AC114-A2 1.87 0.4 \nodata Cl2244-gA 2.24 0.0 ()
0.3 The nature of high-z galaxies
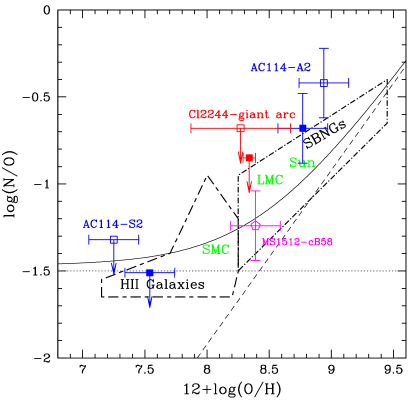
In Figure 2, we examine the location of high-redshift galaxies in the N/O versus O/H relationship. The behavior of N/O with increasing metallicity offers clues about the history of chemical evolution of galaxies and the stellar populations responsible for producing oxygen and nitrogen. The sample of high-redshift () galaxies with measured N/O abundances is still very small: the three galaxies from this paper, and MS 1512-cB58 at (Teplitz et al. 2000). Surprisingly, these four galaxies have very different locations in the N/O vs. O/H diagram. S2 is a low-metallicity object (Z Z⊙) with a low N/O ratio, similar to those derived in the most metal-poor nearby Hii galaxies. In contrast, A2 is a metal-rich galaxy (Z Z⊙) with a high N/O abundance ratio, similar to those derived in the most metal-rich massive SBNGs. The position of MS 1512-cB58 and CL2244-gA is intermediate between these two extremes showing abundance ratios typical of low-mass SBNGs and intermediate-redshift galaxies (see also Lemoine-Busserolle et al. 2003, 2004). A natural explanation for the variation of N/O at constant metallicity is the time delay between the release of oxygen and that of nitrogen into the ISM (e.g. Contini et al. 2002, and references therein), while maintaining a universal IMF and standard stellar nucleosynthesis. The “delayed-release” model assumes that star formation is an intermittent process in galaxies and predicts that the dispersion in N/O is due to the delayed release of nitrogen produced in low-mass longer-lived stars, compared to oxygen produced in massive, short-lived stars. Following this hypothesis and new chemical evolution models (Mouhcine & Contini 2002), we might interpret the location of S2 and A2 in the N/O versus O/H diagram in terms of star formation history and evolutionary stage of these galaxies. The low O/H and N/O abundance ratios found in S2 might indicate a relatively young age for this object which experienced two or three bursts of star formation at most in the recent past. A2 seems on the contrary much more evolved. The location of this galaxy in the N/O versus O/H diagram indicates a relatively long star formation history with numerous powerful and extended starbursts.
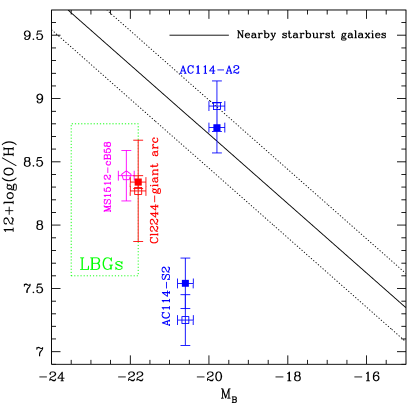
We can study the evolution with redshift of the fundamental scaling relation between galaxy luminosity and metallicity. For nearby galaxies, this relation extends over magnitudes in luminosity and dex in metallicity (Lamareille et al. 2004 and references therein). From Figure 3, it is immediately obvious that high-redshift galaxies do not conform to today’s luminosity–metallicity relation. Even allowing for the uncertainties in the determination of O/H, high-redshift galaxies have much lower oxygen abundances than one would expect from their luminosities. This result, already revealed by previous studies (e.g. Pettini et al. 2001; Contini et al. 2002), is secured with the addition of the low-luminosity and low-metallicity galaxy S2. One interpretation of this result is that high-redshift galaxies are undergoing strong bursts of star formation which raise their luminosities above those of nearby galaxies with similar chemical composition. Another possibility is that the whole metallicity–luminosity relation is displaced to lower abundances at high redshifts, when the Universe was younger and the time available for the accumulation of the products of stellar nucleosynthesis was shorter. It should be possible to quantify this effect by measuring metallicities in samples of galaxies at different redshifts. Unfortunately, to date there is no sample of galaxies with known chemical abundances to fill the gap between and . The location of A2 is more surprising. It does not follow the trend of high-redshift objects. Instead, it lies on the luminosity–metallicity relation of nearby objects and has the highest metallicity of any high-redshift () galaxy.
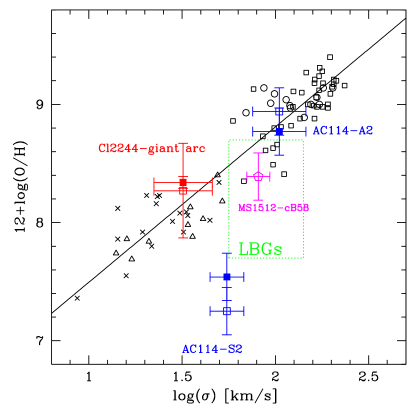
In Figure 4 we plot the oxygen abundance against the line-of-sight velocity dispersion () for high-redshift galaxies and other relevant samples of nearby galaxies. This diagram corresponds to a crude mass–metallicity sequence. The location of AC114-A2 is fully compatible with that of low-redshift galaxies. However, the oxygen abundance of AC114-S2 is much smaller than the corresponding value for low- galaxies of similar velocity dispersions. The situation is even more dramatic if we consider the velocity gradient derived under the disk-like rotation curve hypothesis (see previous section). Taken at face value, it would appear that the slope of the mass–metallicity relation for galaxies with is different from that of low- galaxies. The behavior of Cl2244-gA in this diagram is peculiar; it seems that we are observing a nearly face-on “disky” galaxy as supported by its extinction close to zero and the very low value of , which would, in this case, not be a good tracer of its dynamics.
0.4 Implications for EMIR/GOYA project
We have presented in this paper the firsts results of our optical/NIR spectroscopic survey of highly magnified high-redshift galaxies in the core of lensing clusters, magnitudes fainter than the LBGs in the field. The results obtained on the physical properties of these galaxies suggest that high- objects of different luminosities could have quite different star formation histories and hence different evolutionary status. However, the number of well observed high- objects is currently very small and larger samples in both redshift (1.5 z 6) and luminosity are required. This will be achieved with the new generation of multi-object NIR spectrographs for the 10m-class telescopes, such as EMIR on the GTC. One of the main objectives of the GOYA survey is indeed to statistically study the physical properties of galaxies.
References
- Bruzual & Charlot (2003) Bruzual, G. & Charlot, S. 2003, MNRAS, 344, 1000
- Colless et al. (2001) Colless, M., et al. 2001, MNRAS, 328, 1039
- (3) Contini, T., Treyer, M. A., Sullivan, M., Ellis, R. S., 2002, MNRAS, 330, 75
- (4) Ebbels, T. M. D., Le Borgne, J.-F., Pelló, R., et al., 1996, MNRAS, 281, L75
- Erb et al. (2003) Erb, D. K., Shapley, A. E., Steidel, C. C., Pettini, M., Adelberger, K. L., Hunt, M. P., Moorwood, A. F. M., & Cuby, J. 2003, ApJ, 591, 101
- (6) Kneib, J-P., Ellis, R.S., Santos, M.R., Richard, J., 2004, ApJ in press (astro-ph/0402319)
- (7) Lamareille, F., Mouhcine, M., Contini, T., Lewis, I., Maddox, S. 2004, MNRAS, in press (astro-ph/0401615)
- (8) Le Borgne et al., 2004, A&A, submitted
- Lemoine-Busserolle et al. (2003) Lemoine-Busserolle, M., Contini, T., Pelló, R., Le Borgne, J.-F., Kneib, J.-P., & Lidman, C. 2003, A&A, 397, 839
- (10) Lemoine-Busserolle, M., Contini, T., Pelló, R., Le Borgne, J.-F., Kneib, J.-P., & Richard, J. 2004, A&A, submitted
- Lilly et al. (1995) Lilly, S. J., Le Fevre, O., Crampton, D., Hammer, F., & Tresse, L. 1995, ApJ, 455, 50
- (12) Mehlert, D., Seitz, S., Saglia, R.P., et al., 2001, A&A, 379, 96
- Mouhcine & Contini (2002) Mouhcine, M. & Contini, T. 2002, A&A, 389, 106
- (14) Pelló, R., Kneib, J.-P., Le Borgne J.-F., et al., 1999, A&A, 346, 359
- (15) Pellóls, R., Contini, T., Lemoine-Busserolle, M., Richard, J., et al., 2003, in “Gravitational Lensing: a unique tool for cosmology” (astro-ph/0305229)
- Pelló et al. (2004) Pelló, R., Schaerer, D., Richard, J., Le Borgne, J.-F., & Kneib, J.-P. 2004, A&A, 416, L35
- (17) Pettini, M., Kellogg, M., Steidel, C. C., Dickinson, M., Adelberger, K. L., Giavalisco, M., 1998, ApJ, 508, 539
- (18) Pettini, M., Steidel, C. C., Adelberger, K. L., Dickinson, M., Giavalisco, M., 2000, ApJ, 528, 96
- (19) Pettini, M., Shapley, A. E., Steidel, C. C., et al., 2001, ApJ, 554, 981
- Schneider et al. (2003) Schneider, D. P., et al. 2003, AJ, 126, 2579
- (21) Steidel, C. C., Giavalisco, M., Dickinson, M., Adelberger, K. L., 1996, AJ, 112, 352
- (22) Steidel, C. C., Adelberger, K. L., Giavalisco, M., Dickinson, M., Pettini, M., 1999, ApJ, 519, 1
- Steidel et al. (2004) Steidel, C. C., Shapley, A. E., Pettini, M., Adelberger, K. L., Erb, D. K., Reddy, N. A., & Hunt, M. P. 2004, ApJ, 604, 534
- (24) Teplitz, H. I., Mc Lean, I. S., Becklin, E. E., et al., 2000, ApJ, 533, L65