Simultaneous X-ray and Ultraviolet spectroscopy of the Seyfert galaxy NGC 5548. III. X-ray time variability
The Seyfert 1 galaxy NGC 5548 was observed for a week by Chandra using both the HETGS and LETGS spectrometers. In this paper we study the time variability of the continuum radiation. During our observation, the source showed a gradual increase in flux over four days, followed by a rapid decrease and flattening of the light curve afterwards. Superimposed upon these relatively slow variations several short duration bursts or quasi-periodic oscillations occured with a typical duration of several hours and separation between 0.6–0.9 days. The bursts show a delay of the hard X-rays with respect to the soft X-rays of a few hours. We interprete these bursts as due to a rotating, fluctuating hot spot at approximately 10 gravitational radii; the time delay of the hard X-rays from the bursts agree with the canonical picture of Inverse Compton scattering of the soft accretion disk photons on a hot medium that is relatively close to the central black hole.
Key Words.:
Galaxies: active – Galaxies: Seyfert – Galaxies: individual: NGC 5548 – X-rays: individual: NGC 5548 X-rays: Galaxies1 Introduction
Active Galactic Nuclei (AGN) are well known for their violent environment. Gas is being swallowed by the black hole, fed by a continuous supply of fresh material through an accretion disk. This process becomes visible as intense high-energy radiation from the disk and its immediate surroundings, in particular close to the black hole. This radiation field may drive outflows from the nucleus. The detection of these outflows gives us a way to probe into the inner nuclear regions.
Recent high-resolution X-ray spectra, starting with the first observation of the Seyfert 1 galaxy NGC~5548 (Kaastra et al. kaastra00 (2000)) and high-resolution UV spectra (Crenshaw & Kraemer crenshaw99 (1999); Kriss et al. kriss00 (2000)), allowed for an unprecedented study of the ionization and dynamical structure of the outflowing photoionized winds. In the framework of a study of these winds, we proposed to re-observe NGC 5548 in order to obtain simultaneous high-resolution, high signal-to-noise X-ray and UV spectra.
NGC 5548 was observed for a full week with Chandra in January 2002 using both the High Energy Transmission Grating Spectrometer (HETGS) and Low Energy Transmission Grating Spectrometer (LETGS), with simultaneous UV observations taken by the Space Telescope Imaging Spectrograph (STIS). The analysis of the warm absorber is presented elsewhere (UV spectra: paper I, Crenshaw et al. crenshaw03 (2003); X-ray spectra: paper II, Steenbrugge et al. steenbrugge04 (2004)). Limits to the spatial extent of the X-ray source were discussed by Kaastra et al. (kaastra03 (2003)). In this paper we discuss the continuum time variability of the source during this observation.
2 Observations and data extraction
The present observation of NGC 5548 was obtained in January 2002. The observation was split over three orbits of the Chandra satellite. In the first orbit (151 ks exposure time, start January 16, 2002) the HETG/ACIS-S configuration was used, in the second (170 ks exposure, start January 18) and third (171 ks exposure, start January 21) the LETG/HRC-S configuration was used. The HETGS data were reduced using the standard CIAO software version 2.0b. The LETGS data were reduced using dedicated software as described in Kaastra et al.(kaastra02 (2002)). The combined observation spans a time interval of a full week. All times reported in this paper are given in seconds relative to MJD 52290 (Jan 16, 2002, time 00:00:00).
3 Time variability
3.1 Light curve
We constructed the LETGS zeroth order light curve of NGC 5548 by extracting all events within a radius of 100 pixels from the location of the source. The background, estimated from a nearby region, is negligible as compared to the flux of the source, and shows no significant time variations. Note that due to the use of the HRC-S detector, pile-up in the zeroth order can be neglected.
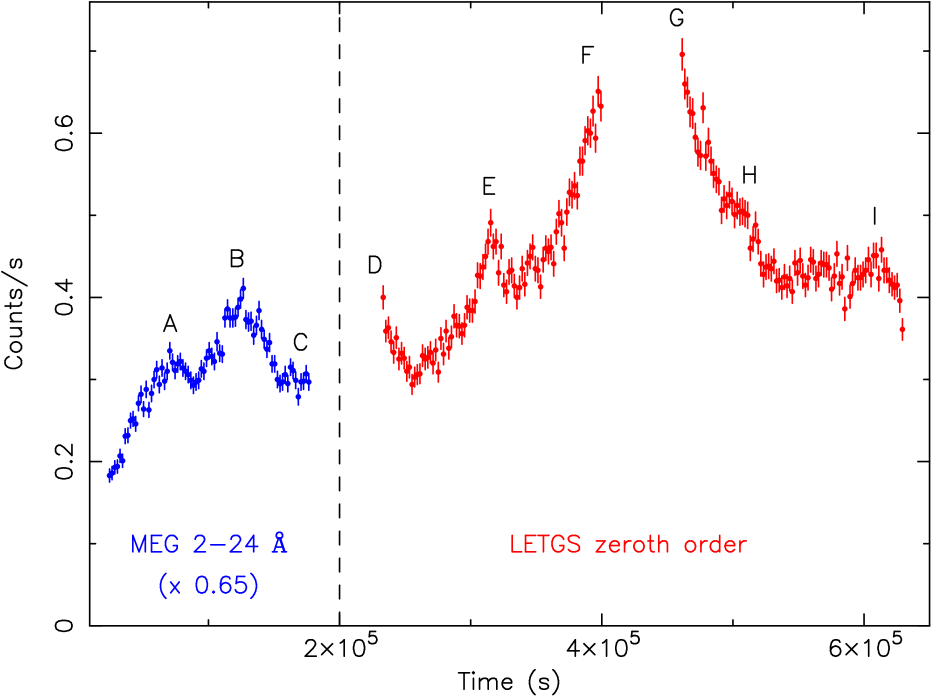
Fig. 1 shows the light curve extracted from the zeroth order of the LETGS, combined with the first order MEG count rate, scaled to approximately the corresponding LETGS level. We estimate the uncertainty in this scaling factor to be %, taking into account the absolute calibration uncertainties of both instruments (in particular the zeroth order effective area of the LETGS). The light curve is characterized by a rise during four days from 0.2 to 0.7 c/s, with superimposed short duration (few hours) fluctuations. The characteristic exponential rise time toward the peak at ks is a few days followed by a decay with a similar time scale up to ks. After that time, the light curve remains approximately constant for a day till the end of the observation.
The light curve also exhibits a few peaks, which we call here ”bursts”, and which are labeled with the letters A through I in Fig.1. The clearest example is the burst which reaches its maximum at ks and lasts for about 20 ks (labeled ”E” in Fig. 1). Its peak amplitude is about c/s above the underlying rising flux of 0.369 c/s, i.e. an increase of 25 % of this steadily rising flux level.
We note that bursts A, B and C are not only present in the MEG data, but are also visible in the HEG data as well as the zeroth-order light curve of the HETGS. This zeroth-order light curve, due to the use of the ACIS detector, has strong pile-up effects which makes it less useful for quantitative analysis. Therefore we concentrate here on the MEG first order data. The combined light curves also show evidence for two very prominent short-lived bursts at either side of burst B.
While bursts A, B and E are clearly recognized in Fig. 1, the others are less obvious. Here we present our arguments why we think these other bursts are significant. It is evident that the light curve has a local maximum between burst C and D. Instead of two or more separate bursts the data would also be consistent with a single peak during this interval. However, the spectral variability (see Sect. 3.2) indicates a similar behavior at point C as at the start of the better observed bursts: a maximum in the soft flux while the hard flux is still rising (Fig. 3). Therefore we tentatively assume that there are two bursts, C and D bracketing the perigee passage (the instrumental background is small so this is not an artifact induced by the Chandra orbit). Also, D is similar to the start of E (see Fig. 2 and Fig. 4). This last figure shows the same type of ”hysteresis” for burst D (sequence 1–6 in the lower left of the figure) as for burst E (the next sequence 1–6).
A similar situation holds for bursts F and G, which also bracket a perigee passage and where in particular peak F shows again the characteristic spectral behavior for the onset of all other bursts: a flattening of the soft X-ray flux while the hard X-ray flux is still rising.
Evidence for burst H is most clearly seen as the shoulder in the light curve (Fig. 1); however, its amplitude is small. Also burst I at the end of the observation has a small amplitude; this burst is weak and does not show much evidence for delays between soft and hard bands.
In summary, there is evidence for at least 7 bursts (A–G), some of them with relatively large amplitude, during the gradual rise in the first 400 ks of the observation; there may be two other bursts after the peak maximum (H and I) but they are less clear and weaker.
We estimated the arrival times of the burst peaks by fitting Gaussians superimposed on a linear rise (Table 1). There is no evidence for true periodicity in the occurrence time of the bursts. However, the interval between the bursts has a characteristic time scale between 55–80 ks, with a slight tendency to increase starting from burst A to the maximum (around burst F and G). The duration of the bursts (as measured by the FWHM from the Gaussian fits) is , and ks for A, B and E, respectively.
Burst (ks) (ks) A 652 58 B 123.01.3 47 C 170 61 D 2317 83 E 314.21.1 80 F 3945 66 G 460 49 H 5093 105 I 6144 -
3.2 Continuum spectral variability
The spectrum of NGC 5548 is analyzed in detail by Steenbrugge et al. (steenbrugge04 (2004)). Here we summarize their results relevant for the present paper. The continuum is well approximated by the sum of a power law component and a modified blackbody spectrum, a similar model as used by Kaastra & Barr (kaastra89 (1989)) in their analysis of the EXOSAT data of NGC 5548. In addition, there is a warm absorber that produces both line and continuum absorption. It appeared that while the continuum of NGC 5548 is changing, there is no evidence for a significant change in the warm absorber, neither between the HETGS and LETGS observation, nor between the present LETGS observation and the first LETGS observation of December 1999, with the exception of O v. This simplifies our analysis of the continuum variability significantly. The presence of a few narrow or broadened emission lines (for example the O vii forbidden line) does not affect our present broad-band analysis.
The zeroth order light curve of the LETGS contains no spectral information. However, taking our best-fit spectral model for the LETGS spectrum we estimate that 90 % of the zeroth order counts originate from photons between 2–50 Å, with a median photon wavelength of 18 Å. We can get variability information from the first order spectral data, but due to the enhanced background of the HRC-S detector the signal is noisier. Therefore we need to take larger time bins than the 2000 s bins that we used in Fig. 1. We have divided the spectral data of both the HETGS and LETGS in intervals of 12 ks. Utilizing the high spectral resolution of the gratings, we then constructed broad-band light curves which were corrected for the effective area of the instruments and for Galactic absorption ( m-2). Since the MEG effective area drops rapidly at long wavelengths, we restricted the MEG wavelength band to Å.
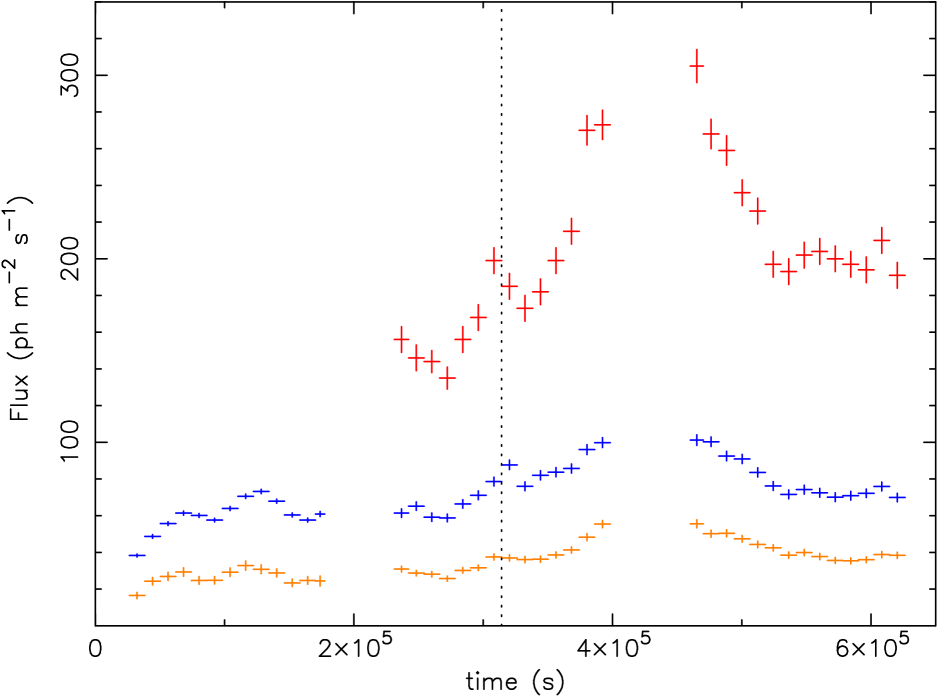
Fig. 2 shows the absorption-corrected light curves for three bands. Our spectral modeling (Steenbrugge et al. steenbrugge04 (2004)) shows that the hard band (2–12 Å) is entirely dominated by the power law component, while the soft band (18–50 Å) is a mixture of power law and modified blackbody emission. The figure shows that the variability is stronger in the soft band: see for example the sharp rise in soft flux shortly before the maximum at ks. It is also evident that burst E at (indicated by the dotted line) is delayed in the hard band as compared to the soft band, by about 1 bin (12 ks).
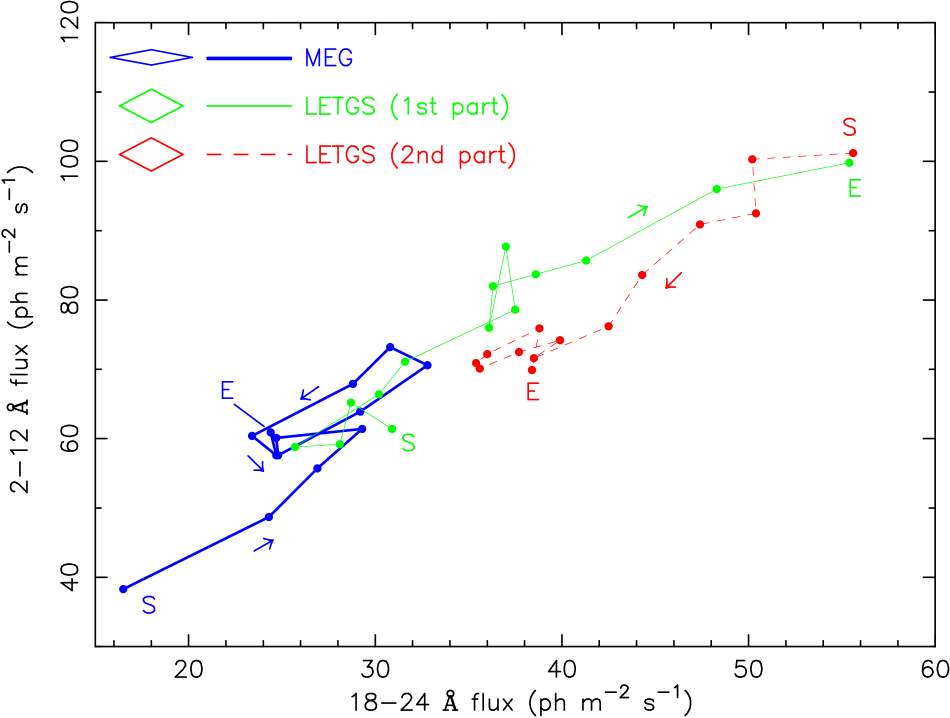
In Fig. 3 we show the relation between soft and hard flux, where for the soft flux we took the 18–24 Å band in order to make use of the MEG data. It is evident that during the HETGS observation and the first LETGS observation the flux in both bands is almost continuously rising, with at least four intermissions in the rise (at approximately the middle and end of the HETGS observation, and at the start and middle of the first LETGS observation). For each of these intermissions first the soft X-ray flux starts decreasing, followed about 1 bin (12 000 s) later by the hard X-ray flux.
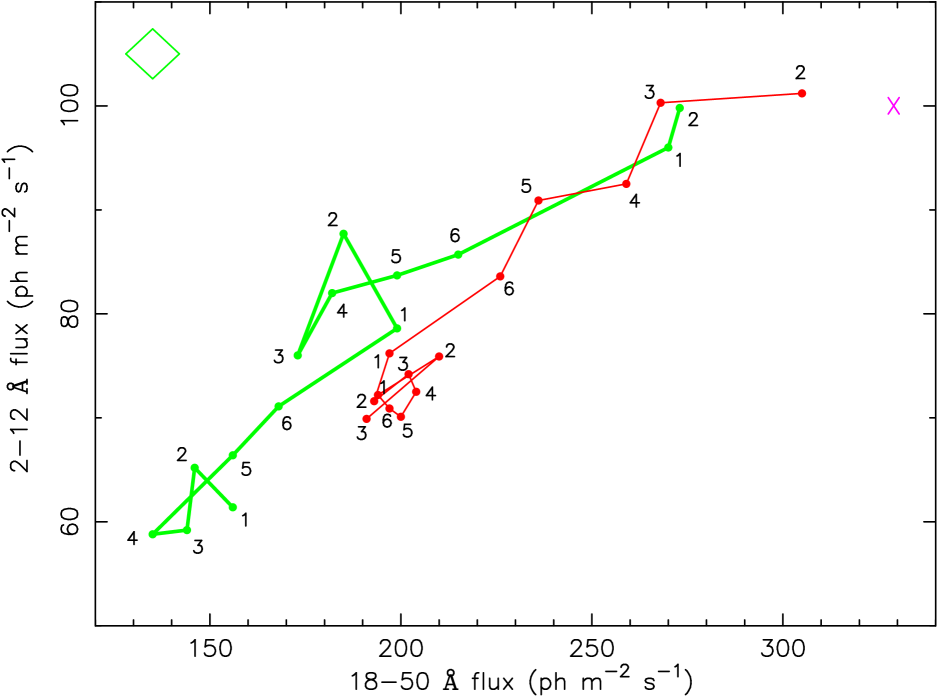
This behaviour is even more evident from Fig. 4, where only LETGS data are plotted, so as to replace the 18–24 Å flux by the 18–50 Å flux. The flux in this latter band is on average 5.170.05 times larger than in the more restricted band 18–24 Å; the LETGS band shows an almost strictly proportional relation between the flux in both soft bands. Due to the limited statistics it is difficult to estimate the exact delay of the hard band relative to the soft band; however by fitting locally Gaussians superimposed on a linear rise for each band, using a higher time resolution version of our light curves we find hard flux delays of , , and ks for bursts A, B, D and E, respectively. The weighted average is ks.
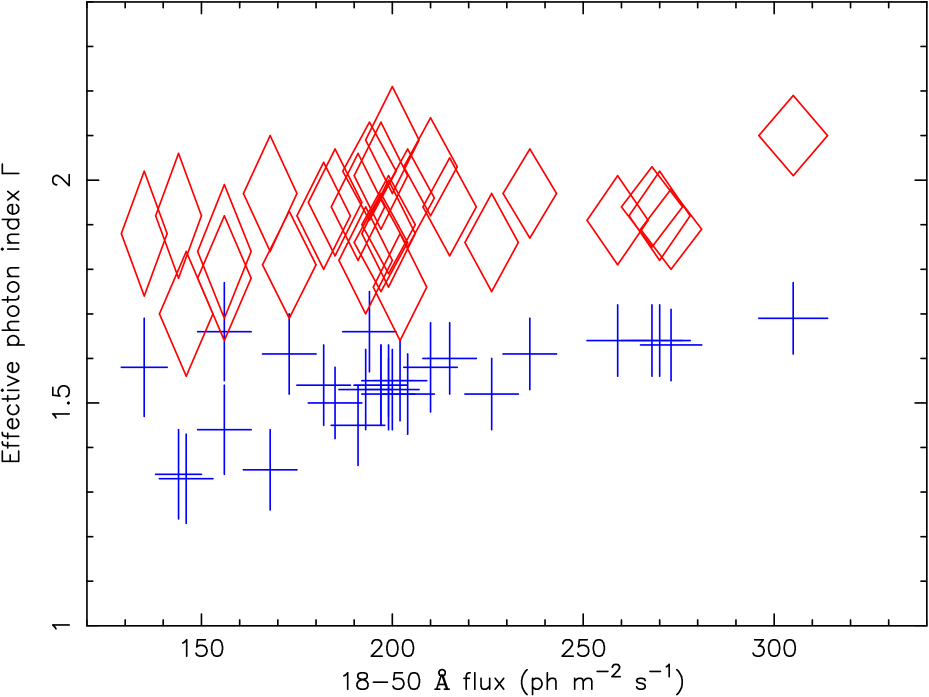
Further we note that our data show the well-known behaviour of the power law component: when the flux increases, the spectrum softens. We have fitted a simple power law to the fluxed, Galactic absorption corrected spectrum in the 2–12 Å band. This ”effective” photon index () is not the true photon index since that is affected by the warm absorber, but given the lack of spectral variability of the warm absorber (see Steenbrugge et al. steenbrugge04 (2004)), it correlates well with the true photon index. This true photon index of the power law component as deduced from the full spectral fit to the total LETGS spectrum is 1.88 (Steenbrugge et al. steenbrugge04 (2004)); the time-averaged value of is 1.55. Given the lack of variability of the warm absorber, one may add 0.33 to in Fig. 5 to get the true photon index. Since in the soft band the continuum has a different nature (modified blackbody plus contributions from the hard X-ray power law) the 18–50 Å effective photon index in Fig. reffig:plvar cannot be transformed easily into a meaningfull physical photon index; it should be merely considered as a convenient parameterisation of the effective spectral slope over this band.
Taking the observed, Galactic absorption corrected flux in the 18–50 Å band (in units of photons m-2 s-1), we find a correlation between and (Fig. 5). The best fit parameters for a functional relation are and . The relatively low significance of the correlation is mainly due to the size of the errors on the photon index, caused by the relatively small effective area of LETGS at the highest energies. Contrary, the effective photon index determined the same way but for the 18–50 Å band does not show a strong correlation with the soft X-ray flux (Fig. 5). In this case the best fit parameters for are and . As is well known for NGC 5548 and other Seyfert galaxies, our data do show the well known correlation between photon index and flux for the power law component alone: the photon index increases from 1.33 at to 1.66 for photons m-2 s-1.
Thus, the spectral shape in the soft band is less variable than in the hard band, despite the large flux variations in the soft band.
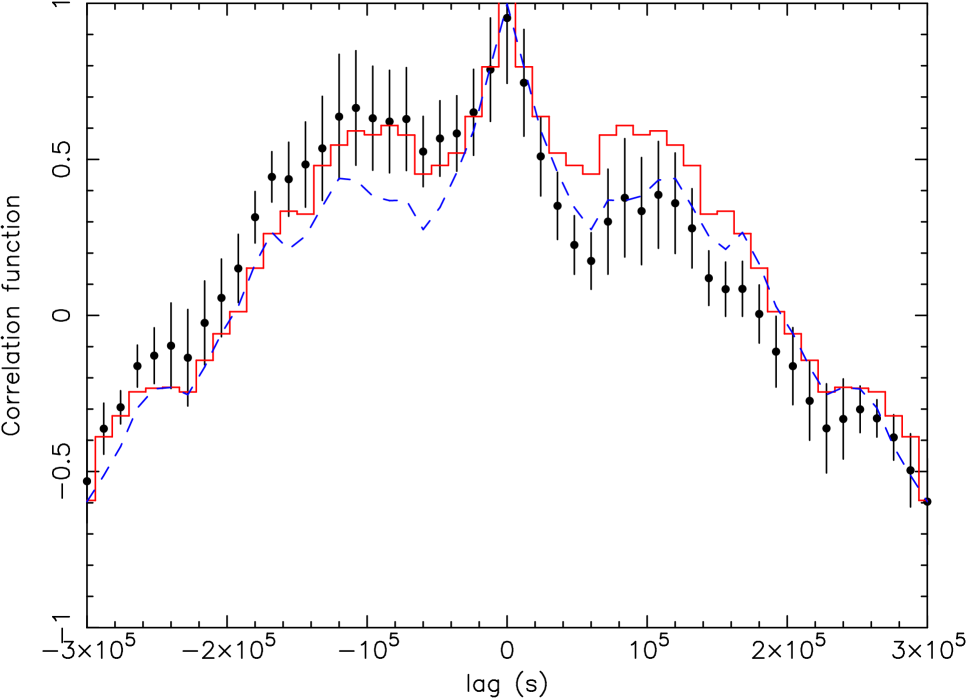
Finally, we investigated the (cross)correlation of our data using the discrete correlation function technique (Edelson & Krolik edelson88 (1988)). In Fig. 6 we show our results. The figure shows a narrow peak with a half-width of about 20–40 ks centered at zero lag. This corresponds to the bursts in the light curve. Despite the fact that for individual bursts the hard X-rays are delayed with respect to the soft X-rays (as can be seen in Fig. 3), Fig. 6 shows that on longer time scales the hard X-rays tend to lead the soft X-rays. This can be seen from the stronger correlation at a lag of ks as compared to the correlation at a lag of ks. Note that due to the bin size of 12 000 s used in Fig. 6 delays of individual bursts are invisible in that plot; but also in a higher time resolution correlation plot they remain invisible due to the addition of noise from the non-burst parts of the lightcurve. Only our hysteresis curves (Fig. 3–4) are able to demonstrate the presence of these delays.
4 Discussion
The lightcurve of NGC 5548 shows several bursts (Fig. 1 and Table 1) with typical intervals between 55–80 ks. There is a slight tendency of longer intervals around the maximum near burst F and G. The spectra of these bursts show an average delay of the hard X-rays with respect to the soft X-rays of 5.42.3 ks.
Such a delay has been seen before in NGC 5548. Kaastra & Barr (kaastra89 (1989)) found a delay of 4.61.2 ks in their correlation analysis of the EXOSAT LE versus ME count rates from two long observations in 1986. Chiang et al. (chiang00 (2003)) find a delay of 136 ks in their correlation analysis of the 0.5–1 keV ASCA versus the 0.14–0.18 keV EUVE Deep Survey (DS) count rates, for their coordinated observations in 1998. The delay of the 2–20 keV RXTE PCA versus EUVE count rate was larger, 3411 ks, but there is less overlap between both light curves as compared to the ASCA and EUVE data sets.
Interestingly, Dietrich et al. (dietrich01 (2001)) report an optical flare in NGC 5548 on June 22, 1998 with a rise time of 1.8 ks and decay time less than 3.6 ks. This flare was visible in the U, B, V, R and I bands and had an ampliude of 20 %. However, no flare is visible in the simultaneous ASCA and RXTE light curves published by Chiang et al. (chiang00 (2003), see their Fig 1; the peak of the optical flare (JD 2 450 987.37) is 197.2 ks after their reference epoch). Unfortunately the optical flare occurred during a data gap of the simultaneous EUVE observation. It is therefore hard to say if this optical flare has a similar physical origin as the bursts that we observe.
Finally, we note that Haba et al.(haba03 (2003)) found 40 % fluctuations in the DS light curve of NGC 5548 in 1996, without simultaneous variations in either the ASCA count rate or spectrum. They conclude that if there is any delay of hard X-rays with respect to soft X-rays, the delay time must be larger than 60 ks. These soft X-ray fluctuations occur at the beginning of their observation during a peak in the X-ray flux, and the DS light curve is remarkably similar to our light curve starting near the maximum (bursts F and G).
We propose the following model for the bursts. We assume that the inner parts of the accretion disk are affected by a thermal instability. This gives rise to the gradual flux increase from the start of our observation to the maximum around 400 ks after the start of our observation. We assume that there is a rotating hot spot at a distance from the black hole. This spot may fluctuate in intensity and extend during its orbiting of the black hole. Since the maximum emissivity of an accretion disk occurs near , we assume that is of this order of magnitude.
Numerical simulations of accretion disks (for example Armitage & Reynolds armitage03 (2003)) indicate that hot spots can survive for a few orbital periods.
The rotating hot spot produces soft X-rays by the same processes as the surrounding parts of the disk emit soft X-rays. The details of this process are not important for our present discussion, but it is clear that some form of reprocessing or Comptonization must occur in the emitting regions, as the shape of the soft X-ray spectrum changes little while its flux is increasing significantly. In our model we assume that the hard X-rays are produced in a different region, by Inverse Compton scattering of the seed photons from the disk and hot spot.
Analytical models for a rotating spot around a black hole were produced by Karas (karas96 (1996)). At distances of , the light curve that would be sinusoidal in the non-relativistic case is distorted by Doppler boosting and general relativistic effects. The maximum is boosted while the minimum is flattened in such a way that as a function of orbital phase the light curve is almost flat during half an orbit, and has a broad peak during the second half. The maximum occurs at phase 0.6–0.7, when the hot spot is approaching the observer (phase 0.5 is defined as the instant when the spot is behind the black hole). The FWHM of the burst is about 30 % of the orbital period. The above holds for disk inclination angle . For larger angles the light curve is dominated by a narrower peak at phase 0.5, caused by focusing of the light by the black hole. However, here we assume that . From the presence of weak relativistic O viii and N vii line, Kaastra et al. (kaastra02 (2002)) derived an inclination angle between 43–54∘, in reasonable agreement with the results of Yaqoob et al. (yaqoob01 (2001)) in their re-analysis of ASCA data (). In Fig. 7 we show an example of the predicted lightcurve for a non-rotating black hole. The results for a Kerr black hole are very similar.

The observed interval between bursts of 55–80 ks then corresponds to the orbital period of the hot spot. Irregularities are caused by fluctuations in the emission from the other parts of the disk, as well as fluctuations in brightness and extend of the spot. The expected FWHM of the bursts is 30 % of the orbital period, or between 15–25 ks. The observed duration of the bursts is in agreement with this estimate, in particular for burst E. A somewhat longer duration of bursts A and B near the onset of the instability may be related to the initial formation of the spot over a larger area of the disk.
Peterson & Wandel (peterson00 (2000)) estimated the mass of the central black hole in NGC 5548 to be M⊙, based upon reverberation mapping of the broad emission lines. Using this mass range, an orbital period of 55–80 ks corresponds to 8–18 gravitational radii. In our further estimates, we adopt and M⊙.
Although the peak luminosity of the bursts reaches some 25 % of the underlying rising flux, it should be noted that the burst peaks are highly boosted by Doppler and general relativistic effects. We estimate that the time-averaged power of the bursts is only 5–10 % of the total flux. This then implies a typical size of a few gravitational radii for the hot spot.
The expected delay of the hard X-rays with respect to the soft X-rays depends upon the geometry of the emitting regions. There are two factors that may cause a delay. If the Inverse Compton scattering of soft X-ray seed photons occurs much further inward as compared to the location of the hot spot, a delay of order or 3000 s may occur. The precise delay depends upon subtileties like inclination angle, distance and geometry of the scattering region and general relativistic effects. The details of such a model are beyond the scope of this paper, however we note that the expected time delay is of the observed order of magnitude.
The second possible origin of a delay is retardation due to the random walk of the soft X-ray seed photons in the scattering region, as they are being up-scattered to hard X-rays. For typical photon indices and temperatures, optical depths of the order of 2–3 are expected. This produces typical delays of the order of 2–3 times the light travel time through the scattering region. The probable size of the scattering region is less than , the radius of the soft X-ray emitting region, hence this may give an effect of the same order of magnitude as the time delays due to the separation between hard and soft X-ray emitting regions. Again, the details are very model-dependent. If this scenario holds, then the hard X-ray source has an electron density of order cm-3.
Finally, we propose that around the maximum of the thermal instability, in the middle of our LETGS observation, the hot spot may disappear, as we do not see evidence for strong bursts after this maximum. From the hysteresis plots (Figs. 3 and 4) we see that at the end of the observation the continuum spectral properties differ significantly from the spectral properties during the rise toward the peak, as is evident from the different hard to soft X-ray flux ratio. A similar two state situation has been found in NGC~3783 by Netzer et al.(netzer03 (2003)).
ACKNOWLEDGMENTS
SRON is supported financially by NWO, the Netherlands Organization for Scientific Research.
References
- (1) Armitage, P.J., & Reynolds, C.S., 2003, MNRAS, 341, 1041
- (2) Chiang, J., Reynolds, C. S., Blaes, O., M., et al., 2000, ApJ, 528, 292
- (3) Crenshaw, D.M., & Kraemer, S.B., 1999, ApJ, 521, 572
- (4) Crenshaw, D.M., Kraemer, S.B., Gabel, J.R., et al., 2003, ApJ, 594, 116
- (5) Dietrich, M., Bender, C.F., Bergmann, D.J., et al., 2001, A&A, 371, 79
- (6) Edelson, R.A., & Krolik, J.H., 1988, ApJ, 333, 646
- (7) Haba, Y., Kunieda, H., Misaki, K., et al. 2003, ApJ, 599, 949
- (8) Kaastra, J. S. & Barr, P., 1989, A&A, 226, 59
- (9) Kaastra, J. S., Mewe, R., Liedahl, D. A., Komossa, S., Brinkman, A. C., 2000, A&A, 354, L83
- (10) Kaastra, J. S., Steenbrugge, K. C., Raassen, A. J. J., et al., 2002a, A&A, 386, 427
- (11) Kaastra, J.S., Steenbrugge, K.C., Brinkman, A.C., et al., 2003, in Active Galactic Nuclei: from central engine to host galaxy, PASP Conf. Ser. 290, 101
- (12) Karas, V., 1996, ApJ, 470, 743
- (13) Kriss, G.A., Green, R.F., Brotherton, M., et al., 2000, ApJ, 538, L17
- (14) Netzer, H., Kaspi, S., Behar, E., et al., 2003, ApJ, 599, 933
- (15) Peterson, B.M., & Wandel, A. 2000, ApJ, 540, L13
- (16) Steenbrugge, K.C., Kaastra, J.S., Crenshaw, D.M., et al., 2004, A&A, submitted
- (17) Yaqoob, T., George, I. M., Nandra, K., et al., 2001, ApJ, 546, 759