KECK SPECTROSCOPY OF TWO YOUNG GLOBULAR CLUSTERS IN THE MERGER REMNANT NGC 3921
Abstract
Low-resolution, ultraviolet-to-visual spectra of two candidate globular clusters in the merger remnant NGC 3921 ( km s-1) are presented. These two clusters of apparent magnitude () lie at projected distances of about 5 kpc (0.9) from the center and move with halo-type radial velocities relative to the local galaxy background. Their spectra show strong Balmer absorption lines [EW(H – H) = 11 – 13 Å] indicative of main-sequence turnoffs dominated by A-type stars. Comparisons with model-cluster spectra computed by Bruzual & Charlot and others yield cluster ages in the range of 200 – 530 Myr, and metallicities about solar to within a factor of three. Given their small half-light radii ( pc) and ages corresponding to 102 core-crossing times, these clusters are gravitationally bound and, hence, indeed young globulars. Assuming that they had Chabrier-type initial mass functions, their estimated current masses are and , respectively, or roughly half the mass of Cen. Since NGC 3921 itself shows many signs of being a Gyr old protoelliptical, these two young globulars of roughly solar metallicity and their many counterparts observed with the Hubble Space Telescope provide supporting evidence that, in the process of forming elliptical-like remnants, major mergers of gas-rich disks can also increase the number of metal-rich globular clusters.
1 INTRODUCTION
During the past decade it has become increasingly apparent that galactic mergers, bulge building, and the formation of large numbers of star clusters are closely intertwined subjects. Evidence for systems of luminous blue clusters newly formed in mergers has accumulated both before and especially since the launch of the Hubble Space Telescope (HST). It now appears that of the thousands of clusters formed in ongoing mergers of gas-rich galaxies (e.g., NGC 4038/39: Whitmore & Schweizer 1995, Whitmore et al. 1999; NGC 3256: Zepf et al. 1999) only the densest and more massive will survive for 500 Myr (Fall & Zhang, 2001) and become the young globular clusters seen in merger remnants of recent vintage.
Observations of globular cluster (GC) systems in recent remnants such as NGC 1275 (Holtzman et al., 1992; Carlson et al., 1998), NGC 3597 (Holtzman et al., 1996; Carlson et al., 1999), NGC 3921 (Schweizer et al. 1996, hereafter SMWF96), and NGC 7252 (Whitmore et al., 1993; Miller et al., 1997) are especially valuable because in these remnants the starbursts have subsided, the dense gas and dust obscuring the view have diminished, and most of the freshly minted clusters have evolved sufficiently to reveal their true nature. Over the several 100 Myr a major disk–disk merger takes to complete, loose star clusters and associations tend to disperse, while gravitationally-bound dense clusters survive as a fossil record of the merger’s star-formation history. Hence, determining the ages and metallicities of these surviving clusters is an important first step in trying to reconstruct that history.
This goal has taken added importance since the discovery of bimodal color and metallicity distributions in the GC systems of many giant ellipticals, predicted by Ashman & Zepf (1992) from merger models of E formation. Since in such ellipticals the red globulars typically have metallicities of – 2 (e.g., Forbes et al. 2001; Peng, Ford, & Freeman 2004), a question of interest is just how metal-rich the second-generation GCs formed during major mergers are. There is growing evidence that such clusters have roughly solar metallicities, as measured to date for two young globulars in NGC 7252 (Schweizer & Seitzer, 1993, 1998), one such cluster in NGC 1275 (Zepf et al., 1995; Brodie et al., 1998), three intermediate-age globulars in NGC 1316 (Goudfrooij et al., 2001), and two in NGC 3610 (Strader et al., 2003; Strader, Brodie, & Forbes, 2004).
The present paper describes exploratory spectroscopic observations aimed at verifying the nature of two candidate young globular clusters in NGC 3921, and at determining their ages and metallicities. Similar to, but slightly younger than the more well-known NGC 7252, NGC 3921 is a very recent remnant of two merged disk galaxies (Toomre & Toomre, 1972) and shows many signs of being a Gyr old protoelliptical (Schweizer 1996, hereafter S96). Predicted to fade by only 1.5 mag from its present over the next 12 Gyr, this remnant is likely to remain a luminous field elliptical. Its young candidate GCs and looser associations were first discovered from the ground (S96) and then in larger numbers with HST (SMWF96). Our spectroscopic observations pertain to two of its brightest candidate globulars.
NGC 3921 itself is located at , (SMWF96) and has a recession velocity relative to the Local Group of km s-1 (S96), which places it at a distance of 86 Mpc for km s-1 Mpc-1. At that distance, adopted throughout the present paper, pc. The corresponding distance modulus is . The Milky Way foreground extinction is small, with values in the literature ranging between (de Vaucouleurs et al. 1991) and 0.047 (Schlegel, Finkbeiner, & Davis, 1998). We adopt the mean value of , with which the absolute visual magnitude of NGC 3921 becomes .
In the following, §2 describes the observations and reductions, §3 presents results concerning the kinematics, ages, and mean metallicity of the two young clusters, and §4 discusses issues concerning the clusters’ physical nature and origin. Finally, §5 summarizes our main conclusions.
2 OBSERVATIONS AND REDUCTIONS
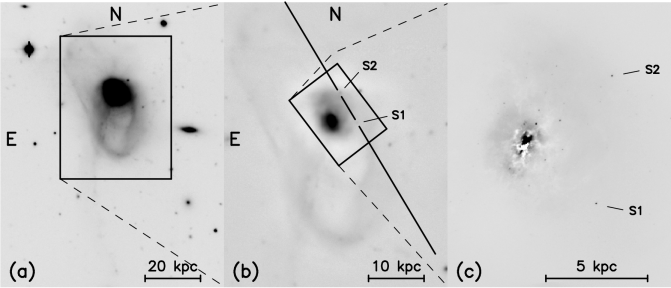
Two candidate GCs in NGC 3921 were observed with the Low-Resolution Imaging Spectrograph (LRIS, Oke et al. 1995) of the Keck I telescope on Mauna Kea on 2000 February 29. During a three-hour window of opportunity beginning shortly after midnight, we realigned the mirror optics of the telescope and placed the long slit of LRIS () at position angle P.A. = across the two candidate clusters via measured offsets from the nucleus. Figure 1 identifies the clusters, S1 and S2, and shows the position of the LRIS slit across them.
Table 1 presents basic data about these two clusters, including their offsets and distances from the nucleus, effective radii, magnitudes and colors, and the radial velocities measured in the present study. Clusters S1 and S2 were the two brightest candidate globulars discovered from ground-based observations (S96) and are the third and fourth brightest candidate GCs cataloged from observations obtained with HST and WFPC2 (SMWF96).
Figure 2 shows the locations of S1 and S2 in a color–magnitude diagram of the 102 candidate GCs found with HST . The two objects lie right on the ‘main’ sequence of candidate young clusters and are, with absolute magnitudes of , very luminous. Of the two still brighter objects, one (#54 in SMWF96) lies only from the exceedingly bright nucleus of the galaxy, too close for spectroscopic observation with LRIS. The other (#2 in SMWF96) lies at (corresponding to kpc) from the nucleus and may, despite its young-cluster-like color, be a foreground star (S96).
After aligning the spectrograph slit across clusters S1 and S2, we obtained four consecutive 30-min exposures of these objects, followed by a short calibration exposure with a Ne-Kr-Xe-Hg emission-line source. The exposures were centered approximately on meridian transit, with the airmass varying only between 1.23 and 1.26. The seeing remained in the range – all night. Two standard stars plus several velocity standards were observed as well. During our observations, LRIS was equipped with a 600 g mm-1 grating blazed at 5000 Å and a Tektronix 2K2K chip as detector. This combination provided a mean reciprocal dispersion of 1.24 Å pixel-1, a spectral resolution of about 5.5 Å, and a wavelength coverage of 3750 – 6280 Å. The scale perpendicular to the dispersion was pixel-1.
All reductions were performed with IRAF111 The Image Reduction and Analysis Facility (IRAF) is distributed by the National Optical Astronomy Observatories (NOAO), which are operated by the Association of Universities for Research in Astronomy (AURA), Inc., under a cooperative agreement with the National Science Foundation. and its spectral-extraction tasks. First the data frames were debiased, flat-fielded, cleaned of cosmic-ray defects, wavelength calibrated, and rectified. Then the spectra of the two clusters were traced on each frame and extracted in a (= 6 pixel) wide band with simultaneous subtraction of sky and galaxy background. Because the cluster counts contribute only 5 – 10% of the total signal at each wavelength and the galaxy background is uneven, the background subtraction had to be done with extreme care.
For Cluster S1, a judicious choice of background-extraction bands on either side allowed us to use parabolic fits to the galaxy-plus-sky background at each wavelength. Cluster S2, however, sits precariously on an edge of the galaxy light distribution, where the gradient changes abruptly. Again using background-extraction bands on either side of the cluster, we had to use 4th-order polynomials to achieve proper background subtraction. The background fits were monitored by visual inspection at several wavelengths, and linear background fits with two narrow background strips closely flanking the cluster were performed as a check. The cluster spectra extracted with linear background subtraction closely resemble those with 4th-order background subtraction, but are more noisy because of the poorer background statistics. Hence, only the spectra with 4th-order background subtraction were used for the subsequent analysis.
As a second check on the success of our background subtractions we also extracted a (= 23 pixel) wide strip of galaxy background lying midway between the two clusters, at 4 kpc () from the nucleus. The night-sky portion of the background spectrum was removed by subtracting scaled night-sky spectra extracted near both ends of the long slit. As we show below, the spectrum of the galaxy background differs strongly from the two cluster spectra and yields a significantly lower radial velocity, indicating that contamination of the cluster spectra by galaxy background—if present—is insignificant.
For each cluster and the galaxy background we produced a final spectrum by coadding the spectra extracted from three of the four half-hour exposures. The omitted frame, corresponding to the first exposure, suffered from poor image quality, likely due to intermittent mirror-alignment problems, and would have contributed more noise than signal to the final cluster spectra. Before coadding them, the individual spectra were corrected for minor shifts ( Å) due to flexure, as determined from night-sky emission lines. Finally, the sum spectra were corrected for atmospheric extinction at Mauna Kea and flux calibrated via the two observed standard stars, PG 0823+546 and PG 0939+262 (Massey et al., 1988).
Figure 3 displays the flux-calibrated spectra of S1, S2, and the galaxy background in between, plotted versus rest wavelength. In the spectra of the two clusters, note the strong Balmer absorption lines indicative of A-type main-sequence stars; on expanded plots, these lines are visible up to H13. Except for the Ca II K-line, the metal lines appear weak. In contrast, the spectrum of the galaxy background shows weaker Balmer lines, much stronger metal lines, and a continuum indicative of more composite and older stellar populations.
3 RESULTS
3.1 Cluster Velocities
Table 1 gives the heliocentric radial velocities measured for clusters S1 and S2. These velocities represent averages of velocities measured by two different methods. First, we determined a mean velocity from five Balmer lines (H–H, H9) measured individually in each cluster spectrum. And second, we determined a mean velocity for each cluster via cross-correlation. Since none of the velocity standards observed during the run were of sufficiently early spectral type to yield a good match to the spectra of S1 and S2, we used as a template the spectrum of the cluster NGC 7252: W3 obtained years earlier with the Blanco 4-m telescope at similar resolution (Schweizer & Seitzer, 1998). This cluster has a very similar age and spectrum, and its radial velocity is known with high accuracy, = km s-1 (Maraston et al. 2004; cf. with km s-1 by Schweizer & Seitzer 1998). Results from the two methods agreed within the combined errors, and the velocities in Table 1 are the straight averages.
Also given in Table 1 are the cluster velocities relative to the nucleus of NGC 3921. These relative line-of-sight velocities were computed from
where the denominator is a relativistic correction and the systemic velocity of NGC 3921 is km s-1 (S96). The values of km s-1 for S1 and km s-1 for S2 clearly indicate that these clusters are physically associated with NGC 3921.
For comparison, the patch of galaxy background extracted between the two clusters (Fig. 3) has a line-of-sight velocity of km s-1 relative to the nucleus. Given the relatively large velocity differences between the two clusters and the local galaxy background, the clusters are likely to belong to a halo population and show halo kinematics. Observations of at least six to eight more clusters are needed to test this hypothesis and determine a reliable halo velocity dispersion.
3.2 Cluster Ages from Balmer and H + K Lines
The spectra of clusters S1 and S2 have relatively low signal-to-noise ratios (Table 1), making it difficult to measure metal lines with the accuracy required for the determination of metallicities. Fortunately, the Balmer absorption lines, which contain most of the age information, are strong and easily measurable. Therefore, we follow the same two-step procedure as used by Schweizer & Seitzer (1998). First, we assume that the clusters have approximately solar metallicities and determine their ages from the Balmer and H + K lines via comparison with high-resolution model spectra for = . Then, in §3.3 we estimate metallicities and ages via Lick indices and check that—indeed—the assumption of solar metallicity appears to be good to within a factor of about three.
To determine the cluster ages, we measured equivalent widths of Balmer
and other strong absorption lines from the observed spectra and compared
them directly with equivalent widths measured in the same manner from
high-resolution model spectra by Bruzual & Charlot (1996, hereafter BC96;
see also Bruzual & Charlot 1993, 2003). Table 2 gives equivalent widths of
the Balmer and Ca II H + K lines measured from the observed
spectra. The
adopted passbands were 62 Å wide for H, 55 Å for H,
52 Å for H, 48 Å for H + H, 17 Å for K, and
40 Å for H8. Continuum passbands were chosen on either side of the
line features, and the measurements were carried out with the task
SPINDEX of the software package VISTA (González, 1993). In addition to
the equivalent widths of the measured six features, Table 2 also gives
the mean equivalent width of H – H
[EW(H) +EW(H) + EW(H)] ,
the line ratio
K/(H + H8) EW(K)/[EW(H + H) + EW(H8)] ,
and the derived logarithmic cluster ages.
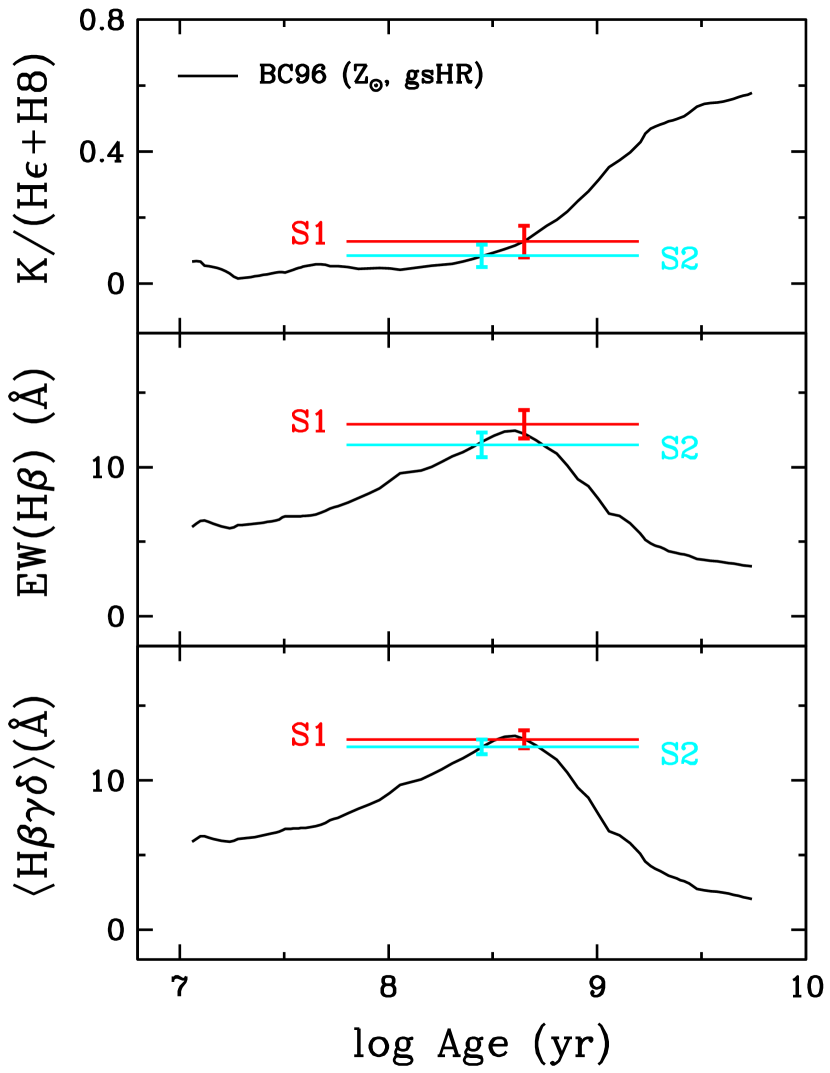
Figure 4 illustrates the derivation of cluster ages from the measured equivalent widths and line ratios. The plotted curves represent the evolution of K/(H + H8), EW(H), and as functions of logarithmic age, as measured from the BC96 high-resolution model-cluster spectra of solar metallicity (named “gsHR”). To compare the observations with the models, the figure also shows the line ratios and equivalent widths measured for clusters S1 and S2 as horizontal lines. The ages of S1 and S2 were then determined from this figure as follows. Logarithmic ages were read off at the intersections between the horizontal lines marking the measurements and the curves representing the model line ratio or equivalent widths. Since in three out of four cases the Balmer equivalent widths yield two possible values for the age, the ratio K/(H + H8) was used to select the more likely of the two values. A weighted mean was then formed of the logarithmic ages obtained from K/(H + H8), EW(H), and . This weighted mean is the logarithmic cluster age listed in the last column of Table 2. From these logarithmic ages follows that, for an assumed solar metallicity, the linear ages of clusters S1 and S2 are Myr and Myr, respectively.
3.3 Cluster Metallicities
To estimate the metallicities of the two clusters, we measured Lick line-strength indices (Faber et al., 1985; González, 1993; Trager et al., 1998) from appropriately smoothed versions of the observed cluster spectra and compared them to indices computed for model clusters by Bressan, Chiosi, & Tantalo (1996) and Bruzual & Charlot (2003, hereafter BC03). Specifically, we used the H – [MgFe] diagram introduced by González (1993) to estimate cluster ages and metallicities simultaneously from the measured indices. The metallicity index [MgFe] is defined through [MgFe] , where Mg , Fe5270, and Fe5335 are Lick indices expressed in angstroms. This index is nearly insensitive to variations in /Fe, the ratio of -elements to iron (Thomas et al., 2003).
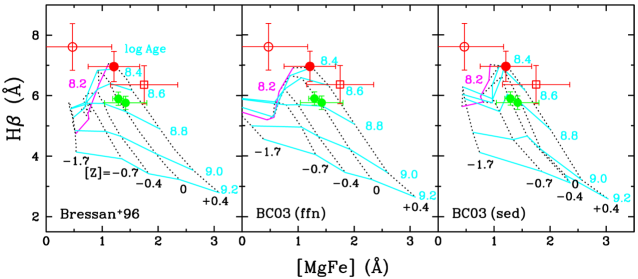
Figure 5 shows three versions of the H – [MgFe] diagram, with isochrones and isometallicity lines based on Bressan et al. (1996) and BC03 models. Data points in each diagram mark the positions of S1, S2, a fictitious cluster with the mean spectrum of S1 and S2, and two bright young globulars in NGC 7252 for comparison. Taken at face value, the positions of clusters S1 and S2 in these diagrams might seem to suggest that S1 is both younger and more metal poor than S2, thus contradicting our earlier result—based on assumed solar metallicity—that S1 probably is the older cluster (§3.2). However, notice that the error bars are large and that both clusters appear outside the area covered by the isochrone–isometallicity grids. Cluster S2 would have to have a true metallicity of to fit into extended such grids, while Cluster S1 lies outside the area covered by any grids, even those covering younger ages. Hence, it appears that the errors in the measured Lick indices of S1 and S2 are too large to draw any firm conclusions about age and metallicity differences.
For this reason, and to improve the available signal-to-noise ratio, we averaged the spectra of clusters S1 and S2, measured Lick indices from the mean spectrum, and plotted the resulting position of a fictitious mean cluster S1+S2 on the H – [MgFe] diagrams of Fig. 5. This position suggests, with still uncomfortably large error bars, that on average the two clusters are about yr = Myr old and have solar to twice solar metallicity (depending on which model grid one uses) to within a factor of about 2 – 3.
Within the large error bars, these independent estimates of age and metallicity based on the H – [MgFe] diagram agree with the cluster ages estimated in §3.2 and with our former assumption that the clusters have roughly solar metallicities. However, given the large errors especially in metallicity, we regard the ages derived in §3.2 and listed in Table 2 as more reliable than those derived from the H – [MgFe] diagram. The former ages depend on three Balmer-line equivalent widths plus the ratio K/(H + H8), while the latter ages depend mainly on the one Lick H index and, in the first two of the three H – [MgFe] diagrams, on fitting functions extrapolated to ages younger than 1 Gyr.
We conclude that the metallicity is for both clusters, and that new, significantly higher- spectra with Keck or larger telescopes will be needed to determine more precise metallicities and possible metallicity differences between young globular clusters in NGC 3921.
4 DISCUSSION
The present discussion addresses some issues concerning the ages, metallicity, nature, and origin of the two young clusters in NGC 3921. The single most interesting question is whether these clusters truly are young globulars.
4.1 Cluster Ages
Given the ages derived in §3.2 and their error bars, it seems likely that clusters S1 and S2 both have ages falling in the range 200 – 530 Myr. Over the next 13 Gyr, solar-metallicity clusters in this age range will fade by – 3.2 mag from stellar evolution alone (BC03, for Chabrier 2003 initial mass function), and possibly more if loss of stars due to evaporation is significant (Fall & Zhang 2001). Hence, when S1 and S2 will reach an age comparable to that of most present-day old globulars, they should have absolute magnitudes well within the range typical for such globulars. Specifically, at age 13.5 Gyr and if evaporation is negligible, Cluster S1 will shine with and S2 with .
How secure are the spectroscopically determined cluster ages, and could—by any chance—the real ages lie well outside the above quoted range of 200 – 530 Myr? To address these questions, we have performed three checks.
First, a visual comparison of the cluster spectra shown in Fig. 3 with sequences of Magellanic-Cloud cluster spectra arranged by age (Bica & Alloin, 1986; Leonardi, 2000; Leonardi & Rose, 2003) suggests immediately that clusters S1 and S2 do, indeed, have ages within about the quoted range. The spectra of younger Magellanic-Cloud clusters (– 100 Myr) differ significantly from those of S1 and S2 by having much stronger UV continua and weaker K lines, while those of clusters older than 600 Myr have stronger K lines, weaker Balmer lines, and redder continua.
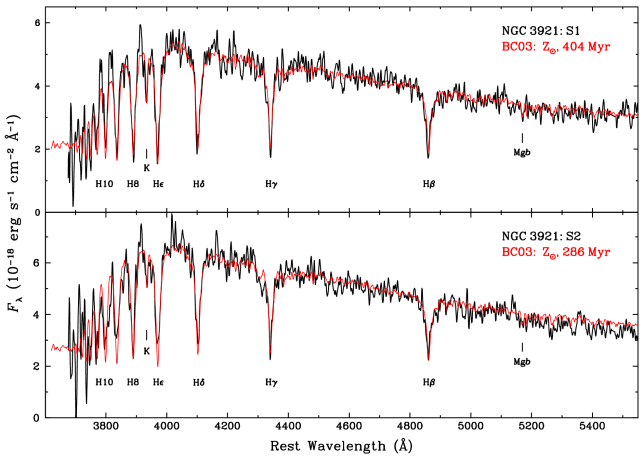
Second, a more detailed comparison with an age sequence of model-cluster spectra of solar metallicity (BC03) strengthens this conclusion. Figure 6 shows the observed spectra of S1 and S2 with BC03 model spectra superposed. In each case, we have simply selected from the age sequence the model spectrum nearest in time to the cluster age and overplotted it. Even without interpolating the model spectra in time or smoothing them, the matches between observed and model spectra are impressive. These matches deteriorate rapidly when one superposes spectra of model clusters half or twice as old as those shown. In addition, we have specifically checked that during the much earlier, red-supergiant phase of cluster evolution (– 20 Myr) the model spectra remain significantly different from the observed ones, with both the Balmer and Ca II K lines weaker and He lines showing up that are not seen in S1 or S2.
Hence, these two spectroscopic checks appear to confirm that the true ages of S1 and S2 do, most likely, lie within the quoted range of 200 – 530 Myr.
Yet, a third, photometric check is less successful. From the cluster colors given in Table 1 and the same BC03 (or BC96) models used for the spectroscopic analysis above, we derive photometric ages about 1.5 – 2 times as large as the spectroscopic ages based on Balmer-line equivalent widths: Myr for Cluster S1, and Myr for S2 (BC03 models, , Chabrier IMF). At least four different factors could cause this discrepancy: reddening, non-solar metallicity, an abnormal initial mass function (IMF), and problems with the models.
We briefly consider these four factors in turn: (1) To bring the photometric ages into agreement with the spectroscopic ages, reddening within NGC 3921 would have to be significant, for S1 and 0.09 for S2 (corresponding to and 0.21, respectively), which seems possible given the apparent scatter in cluster colors seen in Fig. 2. (2) To achieve the same agreement through non-solar metallicity, the clusters would have to have , an unusually high value, but still on the edge of the range permitted by our observations (§3.3). (3) A top-heavy IMF might yield abnormally strong Balmer absorption lines, as suspected for young clusters in NGC 1275 (Brodie et al., 1998), thus falsifying the spectroscopic ages. And (4), there is always the possibility that the models used do not reproduce the cluster colors well during the Asymptotic-Giant-Branch (AGB) phase of evolution ( – yr, see Maraston et al. 2001), when for clusters of mass stochastic noise in the colors is significant (BC03, esp. Fig. 8). Although we cannot adjudicate between these various possibilities at present, we suspect that a combination of reddening and stochastic color noise may be responsible for most of the discrepancy between the photometric and spectroscopic ages of S1 and S2.
How significant is the age difference between the two clusters, and could they both have the same age? The formal age difference derived from the cluster ages given in §3.2 is Myr, which implies that this difference is significant only at the 1.3 level. Hence, equal or very similar ages for clusters S1 and S2 cannot be excluded with any certainty. Yet, there is no reason to prefer a near-zero age difference over the most likely 170 Myr age difference, since in major disk mergers the period of enhanced star and cluster formation lasts typically about 200 – 500 Myr (e.g., Mihos, Bothun, & Richstone 1993, esp. Figs. 10, 13, and 24; Barnes 2004, esp. Fig. 5). Hence, even with an age difference of Myr clusters S1 and S2 are likely to have formed during the same starburst period of the merger.
How do the newly determined spectroscopic ages of S1 and S2 compare with what is known about the merger history of NGC 3921? This remnant of a likely S0–Sc or Sa–Sc merger (Hibbard & van Gorkom, 1996) is a Gyr old protoelliptical (S96). Its “E + A” spectrum near the center suggests that a major starburst occurred at some time during a period 0.5 – 1.0 Gyr ago, whereas the central morphological disequilibrium hints at a somewhat more recent coalescence. Taken literally, the above starburst period and the spectroscopic ages of S1 and S2 would imply that the two clusters formed near the end or even in the aftermath of the main starburst. However, the uncertainties are large enough that S1 and S2 may well have formed during the main starburst. What seems certain is that S1 and S2 are unlikely to have formed before the main starburst, in agreement with the evidence from 102 candidate GCs observed with HST (SMWF96).
4.2 Metallicity
The metallicities of clusters S1 and S2 are about solar to within a factor of three (§3.3). This is not unexpected, given that the clusters formed from molecular gas within the past 0.5 Gyr and the two galaxies that merged in NGC 3921 were major disks.
The clusters’ near-solar metallicities are also consistent with evidence that (1) NGC 3921 itself is a protoelliptical (Toomre & Toomre 1972; S96) and (2) giant ellipticals tend to have globular-cluster systems with bimodal metallicity distributions, one peak of which contains “metal-rich” clusters of (e.g., Ashman & Zepf 1998; Kundu & Whitmore 2001; Larsen et al. 2001). Observations with HST indicate that the recent merger in NGC 3921 produced 100 new globular clusters, increasing the total number of GCs by at least 40% (SMWF96). If most of these young GCs are as metal-rich as S1 and S2 are, then the ratio of metal-rich to metal-poor GCs must be 0.4, in rough agreement with the average ratio and 1-range of observed in normal elliptical galaxies (Forbes, Brodie, & Grillmair, 1997; Larsen et al., 2001). Therefore, within a few gigayears NGC 3921 may possess a GC system not unlike that of a giant field elliptical. The metallicity distribution will likely be bimodal, with a population of metal-poor clusters consisting of the GCs formerly belonging to the halos of the now-merged disk galaxies and a population of metal-rich clusters both stemming from these disks and formed during the merger itself.
If so, NGC 3921 may be related to elliptical galaxies like NGC 1316 (Goudfrooij et al., 2001), NGC 3610 (Whitmore et al., 1997; Strader et al., 2003; Strader, Brodie, & Forbes, 2004), and NGC 5128 (Peng, Ford, & Freeman, 2004), which all appear to be descendants of more ancient mergers involving disk galaxies. Their common trait is the presence of both fine structure indicative of past mergers and some metal-rich globular clusters of intermediate age (2 – 8 Gyr). Though not showing any obvious signs of tidal perturbation, the Virgo Cluster elliptical NGC 4365 may belong to this category of merger descendants as well. It, too, features metal-rich globular clusters of intermediate age (Larsen et al., 2003) and a kinematically decoupled, slightly bluish central disk that may stem from a past merger (Surma & Bender, 1995; Carollo et al., 1997).
4.3 Nature and Origin of Clusters
What is the nature of clusters S1 and S2, and how did they form?
The spectroscopic observations presented above support the view that many of the bluish point sources observed in NGC 3921 (S96; SMWF96) indeed are young globular clusters. In essence, any dense cluster with 104 stars, an effective (= half-light) radius of the order of 10 pc or less, and an age exceeding 10 – 20 core-crossing times has to be gravitationally bound and is a globular cluster.
Assuming that S1 and S2 have Chabrier (2003) IMFs, their luminosities and ages indicate present-day masses of and , respectively (BC03), whence they must contain well over 106 stars each. Both clusters have measured effective radii of pc, implying that—like Milky-Way globulars—they have core-crossing times of a few Myr (Meylan & Heggie, 1997). Hence, each is of order 100 old and clearly a gravitationally bound young globular cluster.
According to the BC03 models, the two clusters have so far lost about 35% of their original mass due to stellar evolution and will loose another 15% over the coming 13 Gyr due to the same cause. At an age of 13.5 Gyr and if stellar evolution were the only source of mass loss, S1 and S2 would be 45% and 28% as massive as Cen is at present (, Meylan 2002). Hence, these are both dense and massive GCs by any measure. Although their dynamical evolution and evaporative mass loss will depend on their unknown orbital characteristics, it seems likely that both clusters will survive for a long time, of the order of a Hubble time or longer.
How did S1, S2, and the many other candidate young GCs in NGC 3921 form? There is growing evidence that massive young clusters in present-day mergers form from Giant Molecular Clouds (GMC; e.g., Schweizer 2003; Whitmore 2003). As Jog & Solomon (1992) first pointed out and Elmegreen & Efremov (1997) reasoned in more detail, the rapidly mounting pressure of interstellar gas heated in starbursts provides a natural mechanism for triggering the collapse of the embedded GMCs, which are cold and only marginally stable. In support of this hypothesis, the luminosity functions of young globular-cluster systems are remarkably similar to the mass functions of GMCs in present-day spiral galaxies (Harris & Pudritz, 1994). Both kinds of functions are power laws with similar exponents and upper-end cutoffs. Specifically, the luminosity function of young clusters in NGC 3921 has the form , where (SMWF96), in accord with the luminosity functions of many other systems of young clusters and GMCs.
A further piece of evidence in favor of the young globulars of NGC 3921 having formed from GMCs in the merging disk galaxies is provided by the clusters’ radial distribution. This distribution closely follows the -law of NGC 3921’s light distribution. The agreement indicates that the progenitors of the young GCs experienced the same violent relaxation as did the disk stars, which in turn suggests that these progenitors were compact and reacted to the merger like point masses (SMWF96). The GMCs of the input galaxies are the only known gas-rich objects to be both compact and massive enough to fit the bill. Hence, the radial cluster distribution in NGC 3921 strongly points to GMCs having been the progenitors of the young globulars. The fact that S1 and S2 have approximately solar metallicities (§3.3) is consistent with this hypothesis.
5 SUMMARY
We have described exploratory Keck-LRIS spectroscopy of two candidate globular clusters of apparent magnitude in the merger remnant NGC 3921. The main results are as follows:
(1) Both objects are confirmed to be young star clusters of visual absolute magnitude within NGC 3921. They lie at 5 kpc (0.9) projected distance from the center and show halo kinematics. Their line-of-sight velocities relative to the nucleus are km s-1 and km s-1, respectively, while that of the local galaxy background is km s-1.
(2) The clusters’ spectra feature strong Balmer absorption lines up to H13, indicating that A-type stars dominate the main-sequence turnoffs. Comparisons with models by Bruzual & Charlot (1996, 2003) and Bressan et al. (1996) yield ages of Myr for Cluster S1 and Myr for S2, and a mean metallicity that is roughly solar (to within dex). As judged by their half-light radii of 5 pc and their ages corresponding to 102 core-crossing times, both clusters are gravitationally bound and, hence, young globulars.
(3) These two young globulars appear to be massive and dense. Estimates based on their luminosities and BC03 models with Chabrier (2003) initial mass functions yield cluster masses of and for S1 and S2, respectively, or roughly half the mass of Cen. With such masses and normal effective radii, both clusters are likely to survive for a period of the order of a Hubble time or longer.
(4) If most of the newly-formed GCs in NGC 3921 have metallicities comparable to those of S1 and S2, then the recent merger of two disk galaxies has not only formed a protoelliptical, but also enhanced the metal-rich component of the cluster population. This enhancement is significant, since the ratio of young to old GCs in NGC 3921 is 0.4 (SMWF96), while the average ratio of metal-rich to metal-poor GCs in normal elliptical galaxies is ( range). Therefore, NGC 3921 and its GC system provide evidence in support of the hypothesis that giant ellipticals, and especially those with bimodal GC systems, can form through major mergers involving gas-rich disk galaxies.
We conclude by noting that integrated-light spectroscopy of old globular clusters in host galaxies at km s-1 remains beyond the reach of 8-m to 10-m telescopes. It is the 2 – 6 mag gain in cluster luminosity due to youth that has made the present work in NGC 3921, as well as earlier cluster spectroscopy in NGC 7252 (Schweizer & Seitzer, 1993, 1998) and NGC 1275 (Zepf et al., 1995; Brodie et al., 1998), possible.
References
- Ashman & Zepf (1992) Ashman, K. M., & Zepf, S. E. 1992, ApJ, 384, 50
- Ashman & Zepf (1998) Ashman, K. M., & Zepf, S. E. 1998, Globular Cluster Systems (Cambridge: Cambridge Univ. Press)
- Barnes (2004) Barnes, J. E. 2004, MNRAS, in press (= astro-ph/0402248)
- Bica & Alloin (1986) Bica, E., & Alloin, D. 1986, A&AS, 66, 171
- Bressan et al. (1996) Bressan, A., Chiosi, C., & Tantalo, R. 1996, A&A, 311, 425
- Brodie et al. (1998) Brodie, J. P., Schroder, L. L., Huchra, J. P., Phillips, A. C., Kissler-Patig, M., & Forbes, D. A. 1998, AJ, 116, 691
- Bruzual & Charlot (1993) Bruzual A., G., & Charlot, S. 1993, ApJ, 405, 538 (BC93)
- Bruzual & Charlot (1996) Bruzual A., G., & Charlot, S. 1996, electronic tables, updated from BC93 (BC96)
- Bruzual & Charlot (2003) Bruzual A., G., & Charlot, S. 2003, MNRAS, 344, 1000 (BC03)
- Carlson et al. (1998) Carlson, M. N., et al. 1998, AJ, 115, 1778
- Carlson et al. (1999) Carlson, M. N., et al. 1999, AJ, 117, 1700
- Carollo et al. (1997) Carollo, C. M., Franx, M., Illingworth, G. D., & Forbes, D. A. 1997, ApJ, 481, 710
- Chabrier (2003) Chabrier, G. 2003, PASP, 115, 763
- de Vaucouleurs et al. (1991) de Vaucouleurs, G., de Vaucouleurs, A., Corwin, H. G., Buta, R. J., Paturel, G., & Fouqué, P. 1991, Third Reference Catalogue of Bright Galaxies (Berlin: Springer)
- Elmegreen & Efremov (1997) Elmegreen, B. G., & Efremov, Y. N. 1997, ApJ, 480, 235
- Faber et al. (1985) Faber, S. M., Friel, E. D., Burstein, D., & Gaskell, C. M. 1985, ApJS, 57, 711
- Fall & Zhang (2001) Fall, S. M., & Zhang, Q. 2001, ApJ, 561, 751
- Forbes, Brodie, & Grillmair (1997) Forbes, D. A., Brodie, J. P., & Grillmair, C. J. 1997, AJ, 113, 1652
- Forbes et al. (2001) Forbes, D. A., Beasley, M. A., Brodie, J. P., & Kissler-Patig, M. 2001, ApJ, 563, L143
- González (1993) González, J. J. 1993, Ph. D. thesis, UC Santa Cruz
- Goudfrooij et al. (2001) Goudfrooij, P., Mack, J., Kissler-Patig, M., Meylan, G., & Minniti, D. 2001, MNRAS, 322, 643
- Harris & Pudritz (1994) Harris, W. E., & Pudritz, R. E. 1994, ApJ, 429, 177
- Hibbard & van Gorkom (1996) Hibbard, J. E., & van Gorkom, J. H. 1996, AJ, 111, 655
- Holtzman et al. (1992) Holtzman, J. A., et al. 1992, AJ, 103, 691
- Holtzman et al. (1996) Holtzman, J. A., et al. 1996, AJ, 112, 416
- Jog & Solomon (1992) Jog, C.J., & Solomon, P.M. 1992, ApJ, 387, 152
- Kundu & Whitmore (2001) Kundu, A., & Whitmore, B. C. 2001, AJ, 121, 2950
- Larsen et al. (2001) Larsen, S. S., Brodie, J. P., Huchra, J. P., Forbes, D. A., & Grillmair, C. J. 2001, AJ, 121, 2974
- Larsen et al. (2003) Larsen, S. S., Brodie, J. P., Beasley M. A., Forbes, D. A., Kissler-Patig, M., Kuntschner, H., & Puzia, T. H. 2003, ApJ, 585, 767
- Leonardi (2000) Leonardi, A. J. 2000, Ph.D. thesis, Univ. North Carolina
- Leonardi & Rose (2003) Leonardi, A. J., & Rose, J. A. 2003, AJ, 126, 1811
- Maraston et al. (2001) Maraston, C., Kissler-Patig, M., Brodie, J. P., Barmby, P., & Huchra, J. P. 2001, A&A, 370, 176
- Maraston et al. (2004) Maraston, C., Bastian, N., Saglia, R. P., Kissler-Patig, M., Schweizer, F., & Goudfrooij, P. 2004, A&A, 416, 467
- Massey et al. (1988) Massey, P., Strobel, K., Barnes, J.V., & Anderson, E. 1988, ApJ, 328, 315
- Meylan (2002) Meylan, G. 2002, in IAU Symp. 207, Extragalactic Star Clusters, ed. D. Geisler, E. K. Grebel, & D. Minniti (San Francisco: ASP), 555
- Meylan & Heggie (1997) Meylan, G., & Heggie, D. C. 1997, A&A Rev., 8, 1
- Mihos, Bothun, & Richstone (1993) Mihos, J. C., Bothun, G. D., & Richstone, D. O. 1993, ApJ, 418, 82
- Miller et al. (1997) Miller, B. W., Whitmore, B. C., Schweizer, F., & Fall, M. 1997, AJ, 114, 2381
- Oke et al. (1995) Oke, J. B., et al. 1995, PASP, 107, 375
- Peng, Ford, & Freeman (2004) Peng, E. W., Ford, H. C., & Freeman, K. C. 2004, ApJ, 602, 705
- Schlegel, Finkbeiner, & Davis (1998) Schlegel, D. J., Finkbeiner, D. P., & Davis, M. 1998, ApJ, 500, 525
- Schweizer (1996) Schweizer, F. 1996, AJ, 111, 109 (S96)
- Schweizer (2003) Schweizer, F. 2003, in ASP Conf. Ser. 296, New Horizons in Globular Cluster Astronomy, ed. G. Piotti et al. (San Francisco: ASP), 467
- Schweizer et al. (1996) Schweizer, F., Miller, B. W., Whitmore, B. C., & Fall, S. M. 1996, AJ, 112, 1839 (SMWF96)
- Schweizer & Seitzer (1993) Schweizer, F., & Seitzer, P. 1993, ApJ, 417, L29
- Schweizer & Seitzer (1998) Schweizer, F., & Seitzer, P. 1998, AJ, 116, 2206
- Strader et al. (2003) Strader, J., Brodie, J. P., Schweizer, F., Larsen, S. S., & Seitzer, P. 2003, AJ, 125, 626
- Strader, Brodie, & Forbes (2004) Strader, J., Brodie, J. P., & Forbes, D. A. 2004, AJ, 127, 295
- Surma & Bender (1995) Surma, P., & Bender, R. 1995, A&A, 298, 405
- Thomas et al. (2003) Thomas, D., Maraston, C., & Bender, R. 2003, MNRAS, 339, 897
- Toomre & Toomre (1972) Toomre, A., & Toomre, J. 1972, ApJ, 178, 623
- Trager et al. (1998) Trager, S. C., Worthey, G., Faber, S. M., Burstein, D., & González, J. J. 1998, ApJS, 116, 1
- Whitmore (2003) Whitmore, B. C. 2003, in Extragalactic Globular Cluster Systems, ed. M. Kissler-Patig (Berlin: Springer), 336
- Whitmore & Schweizer (1995) Whitmore, B. C., & Schweizer, F. 1995, AJ, 109, 960
- Whitmore et al. (1993) Whitmore, B. C., Schweizer, F., Leitherer, C., Borne, K., & Robert, C. 1993, AJ, 106, 1354
- Whitmore et al. (1997) Whitmore, B. C., Miller, B. W., Schweizer, F., & Fall, S. M. 1997, AJ, 114, 1797
- Whitmore et al. (1999) Whitmore, B. C., Zhang, Q., Leitherer, C., Fall, S. M., Schweizer, F., & Miller, B. W. 1999, AJ, 118, 1551
- Zepf et al. (1995) Zepf, S. E., Carter, D., Sharples, R. M., & Ashman, K. M. 1995, ApJ, 445, L19
- Zepf et al. (1999) Zepf, S. E., Ashman, K. M., English, J., Freeman, K. C., & Sharples, R. M. 1999, AJ, 118, 752
| Other | bbRelative to NGC 3921 nucleus at = 11:51:06.97, = +55:04:43.0 . | bbRelative to NGC 3921 nucleus at = 11:51:06.97, = +55:04:43.0 . | ccFrom SMWF96, converted to km s-1 Mpc-1. | ccFrom SMWF96, converted to km s-1 Mpc-1. | ddFrom SMWF96, corrected for . | ddFrom SMWF96, corrected for . | eeHeliocentric radial velocity determined in this work. | ff; see text. | Expos. | |||
|---|---|---|---|---|---|---|---|---|---|---|---|---|
| Name | IDaaSMWF96. | (arcsec) | (arcsec) | (kpc) | (pc) | (mag) | (mag) | (mag) | (km s-1) | (km s-1) | (s) | ggAverage signal-to-noise ratio of continuum per resolution element (5.5 Å), measured in interval – 5900 Å and corresponding to Å-1. |
| S1 | #27 | 10.91 | 0.61 | 4.6 | 5 | 22.15 | 0.74 | 12.52 | 6042 30 | +114 34 | 5400 | 22.5 |
| S2 | #44 | 3.43 | +12.51 | 5.4 | 5 | 22.29 | 0.63 | 12.38 | 5978 20 | +51 25 | 5400 | 22.0 |
| H | H | H | H + H | K | H8 | ||||
|---|---|---|---|---|---|---|---|---|---|
| Object | (Å) | (Å) | (Å) | (Å) | (Å) | (Å) | (Å) | K/(H + H8) | AgeaaAge expressed in years. |
| S1 | |||||||||
| S2 | |||||||||
| GalaxybbPatch of NGC 3921 galaxy light between clusters S1 and S2, for comparison (see §2). |