An INTEGRAL Observation of the Black Hole Transient 4U 1630–47 and the Norma Region of the Galaxy
Abstract
We report on results from a 2003 February INTEGRAL observation of the black hole candidate (BHC) 4U 1630–47 and the high energy sources in the Norma Region of the Galaxy and on RXTE and radio observations of 4U 1630–47. To date, there have been 38 new or previously poorly studied sources found by INTEGRAL (the “IGR” sources), and 15 of the IGR sources are in the field of view of our observation. We detect 12 of the 15 sources, and we speculate that a subset of the IGR sources may be part of a new population of persistent, hard, intermediate luminosity X-ray sources. During our observations, 4U 1630–47 was in an intermediate state with strong soft and hard components, a power-law index of -2.18, a 4% rms level of timing noise (0.1-10 Hz), and the source was not detected in the radio band. We discuss the evolution of the energy spectrum during the 293 ks INTEGRAL observation, and we report on rapid, high amplitude flaring behavior that has been seen for much of the 2002-2004 outburst.
keywords:
accretion, accretion disks — black hole physics: general — stars: individual (4U 1630–47) — stars: black holes — X-rays: stars1 Introduction
The X-ray flux observed from transient X-ray binaries changes by several orders of magnitude between quiescence and outburst, providing an opportunity to learn about black hole candidates (BHCs), accretion onto compact objects, and the processes responsible for high energy emission. Although these objects are known to emit hard X-rays and gamma-rays, the origin of this emission is not well-understood. The high energy emission provides a probe of the regions of space close to the compact object, allowing us to study strong gravity and jet formation processes. 4U 1630–47 is among the most active of the BHC X-ray transients and has produced strong hard X-ray emission during its 17 detected outbursts (Tomsick & Kaaret, 2000; Oosterbroek et al., 1998; Kuulkers et al., 1997; Parmar et al., 1997) as well as highly polarized radio emission (Hjellming et al., 1999), indicating the presence of jets. The current outburst from 4U 1630–47, which began in 2002 September, is one of the brightest and longest recorded outbursts from this system, and we had the opportunity to observe 4U 1630–47 with INTEGRAL in 2003 February.
Due to the large INTEGRAL field of view, we also detect many other hard X-ray sources in the vicinity of 4U 1630–47. Several of the sources were unknown or poorly studied prior to INTEGRAL and have “IGR” designations. Although we are just beginning to understand the nature of the IGR sources, many of these appear to be highly absorbed ( cm-2), and some of them are bright IR sources (e.g., Matt & Guainazzi, 2003; Walter et al., 2004; Patel et al., 2004, and papers by Foschini, Walter, and others in these proceedings). The concentration of IGR sources near 4U 1630–47 is almost certainly due to the location of the source in the Galactic plane (, ). This is in the Norma region of the Galaxy, and the line of sight to 4U 1630–47 is tangent to the Norma-Scutum Galactic arm. Below, we present our results on: The hard X-ray sources detected by INTEGRAL in the Norma region; and X-ray and radio observations of 4U 1630–47.
2 Observations
We obtained the following observations of 4U 1630–47 for this
project:
INTEGRAL: Our observations with INTEGRAL
lasted from UT 2003 February 1, 5.7 h to UT 2003 February 5,
7.9 h, with a total of 293 ks on source.
RXTE: 4U 1630–47 has been monitored throughout
the current outburst with the Rossi X-ray Timing Explorer
(RXTE). Five RXTE observations occurred during or
within a day of the INTEGRAL observation, yielding 43 ks
with the Proportional Counter Array (PCA) and 28 ks with the
High Energy X-ray Timing Experiment (HEXTE).
Radio: We observed 4U 1630–47 on 2003 January 26
and 27 at 4.8 and 8.6 GHz. The target was not detected with
an rms level of 0.1 mJy.
3 Results
3.1 The Norma Region Sources
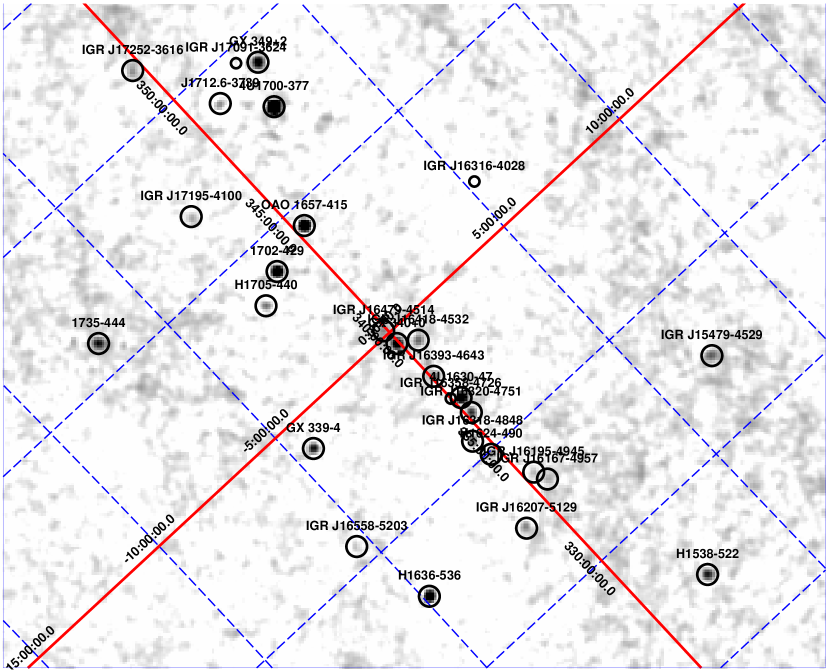
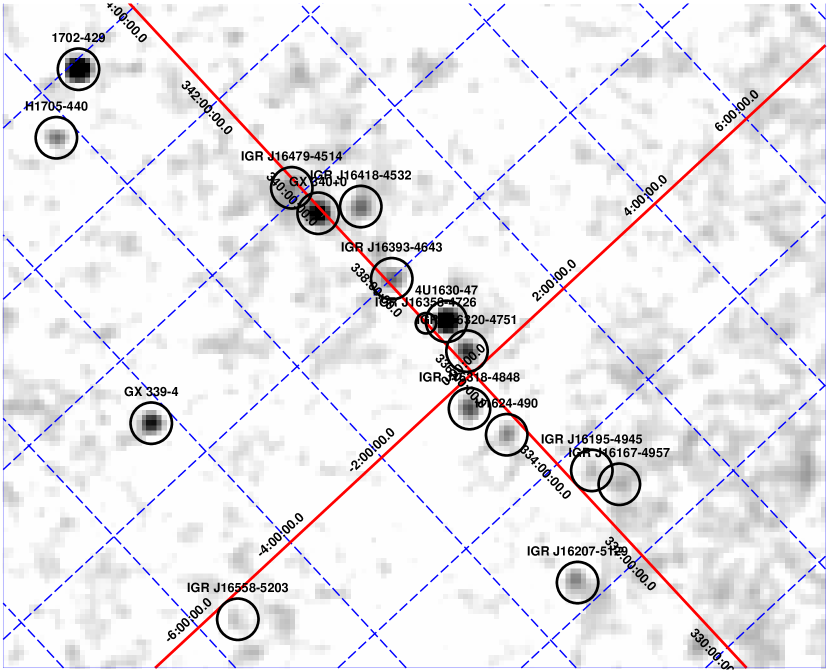
Figure 1 shows the 20-40 keV IBIS image from our 2003 February observation of 4U 1630–47. The field of view covered by IBIS includes 15 of the 38 IGR sources that have been found to date (as of 2004 March). Thus, this relatively long single exposure provides a useful study of a significant subset of the IGR sources. Table 1 lists the 15 IGR sources along with detection significances (SNR = signal-to-noise ratio) and ISGRI count rates or upper limits. We detect 12 out of 15 of the IGR sources, and we note that we used these data to report the discovery of three of the sources (Tomsick et al., 2003, 2004). In addition, the table gives information about identifications or possible identifications with other high energy sources or with sources at other wavelengths. In many cases, this information is in the discovery references (also given in the table), and we also searched the SIMBAD database to look for likely or possible identifications. The density of sources within about of 4U 1630–47 is especially high, and Figure 2 shows a close-up of this region.
| Name | SNR | ISGRI Ratea | Identification or Comment | Reference |
|---|---|---|---|---|
| 4U 1630–47 | 123.0 | 3.75 | 4U 1630–47 | – |
| IGR J15479–4529 | 17.4 | 0.69 | 1RXS J154814.5–452845 | Tomsick et al. (2004) |
| IGR J16167–4957 | 6.9 | 0.24 | – | Walter et al. (2004) |
| IGR J16195–4945 | 5.8 | 0.20 | AX J1619.4–4945, BIa star? | Walter et al. (2004) |
| IGR J16207–5129 | 11.5 | 0.42 | A1IVe star? | Walter et al. (2004) |
| IGR J16316–4028 | 4 | 0.2 | 3EG 1631–4033 (?) | Rodriguez & Goldwurm (2003) |
| IGR J16318–4848 | 24.4 | 0.77 | sgB[e] starb | Courvoisier et al. (2003) |
| IGR J16320–4751 | 32.7 | 1.01 | AX J1631.9–4752 | Tomsick et al. (2003) |
| IGR J16358–4726 | 4 | 0.2 | Ks=12.6, sc | Revnivtsev et al. (2003) |
| IGR J16393–4643 | 16.8 | 0.54 | AX J1639.0–4642 (3EG?) | Malizia et al. (2004) |
| IGR J16418–4532 | 16.8 | 0.54 | – | Tomsick et al. (2004) |
| IGR J16479–4514 | 11.6 | 0.39 | – | Molkov et al. (2003) |
| IGR J16558–5203 | 4.3 | 0.17 | – | Walter et al. (2004) |
| IGR J17091–3624 | 4 | 0.3 | 1SAX J1709–36, radio | Kuulkers et al. (2003) |
| IGR J17195–4100 | 7.1 | 0.36 | – | Walter et al. (2004) |
| IGR J17252–3616 | 10.8 | 0.82 | – | Walter et al. (2004) |
-
a
Here, we give the ISGRI count rate in the 20-40 keV band. The RXTE and INTEGRAL observations of 4U 1630–47 reported below can be used to obtain an approximate flux calibration. For 4U 1630–47, the 20-40 keV flux measured by HEXTE is erg cm-2 s-1, and the ISGRI count rate is 3.75 c/s. Thus, 1.0 ISGRI c/s erg cm-2 s-1 (20-40 keV) 6.5 mCrab.
-
b
See Chaty & Filliatre in these proceedings.
-
c
Pulsations reported in Patel et al. (2004).
3.2 4U 1630–47
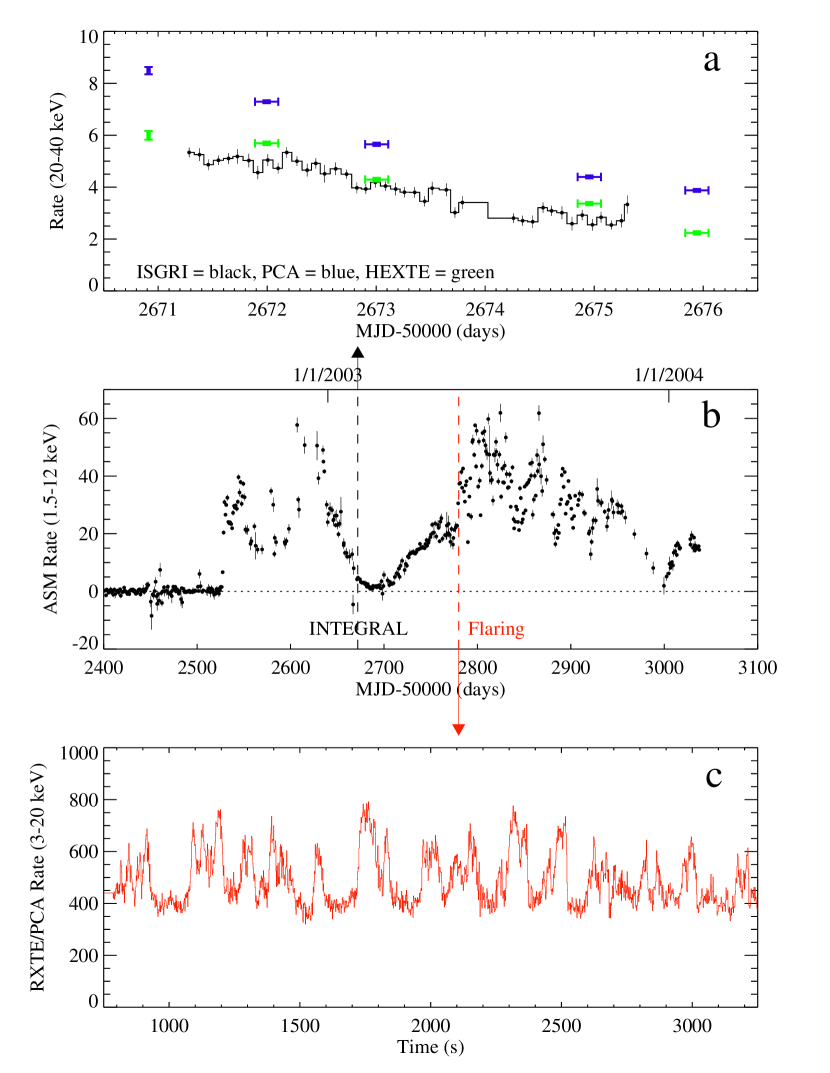
Figure 3b shows the RXTE All-Sky Monitor (ASM) 1.5-12 keV light curve for 4U 1630–47 for the current outburst (which is still in progress as of 2004 March). The peak flux of about 60 ASM is about 50% higher than the peak of the previous four outbursts occurring during the RXTE era. The 2003 February INTEGRAL observation (marked on Figure 3b) occurred during a time when the soft X-ray flux was decaying, but the hard X-ray flux was still relatively strong. Although strong, Figure 3a shows that the 20-40 keV flux declined during the observation. The nearly continuous ISGRI light curve indicates that the decline proceeded in a relatively gradual manner, and this figure also shows the 20-40 keV count rates for the PCA and HEXTE for the five RXTE pointings.
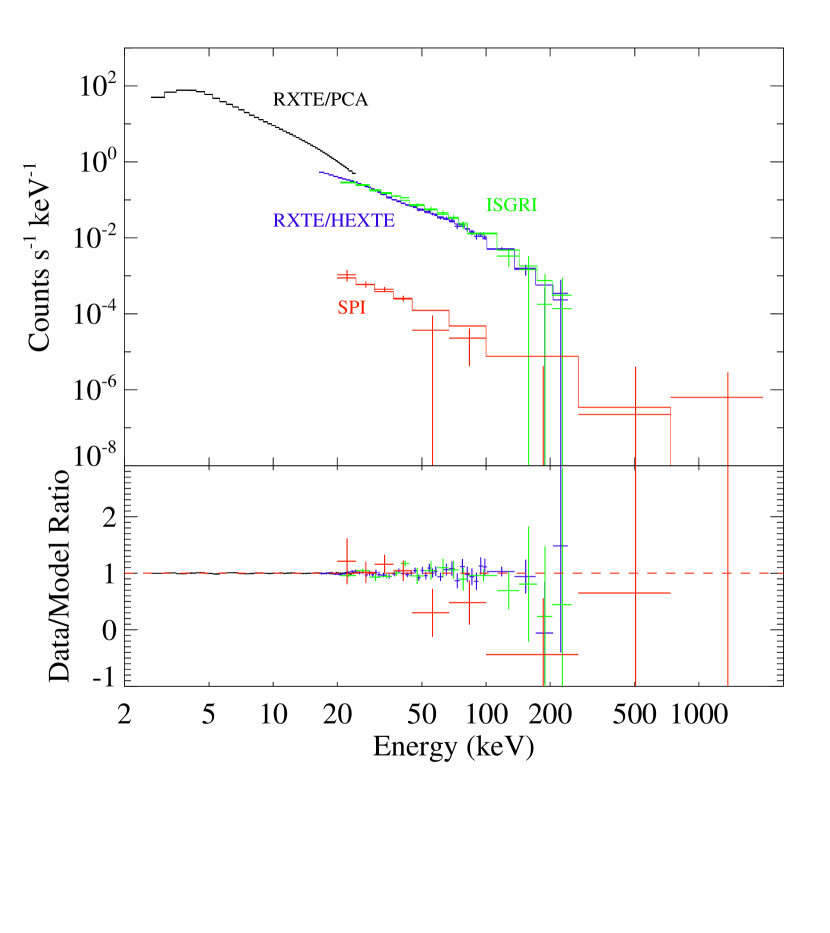
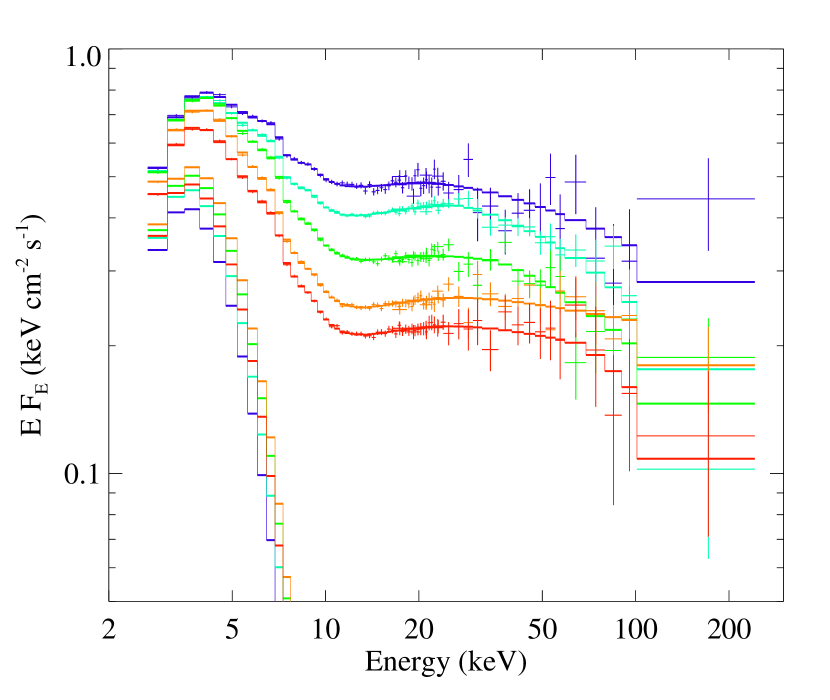
We extracted energy spectra for the ISGRI and SPI instruments on-board INTEGRAL and for the RXTE instruments PCA and HEXTE, and the fitted spectrum is shown in Figure 4. The spectrum is fitted with a model that has been used for previous outbursts (e.g., Tomsick & Kaaret, 2000) consisting of a disk-blackbody with keV plus a power-law with a photon index of . The model also includes interstellar absorption, a smeared iron edge, an iron emission line, and a high energy cutoff with a cutoff energy of keV and an exponential folding energy of keV. The PCA normalization is fixed to 1.0 and the other instrument normalization are left free, giving for HEXTE, for ISGRI, and for SPI. Thus, the normalizations are not consistent between instruments. We have extracted power spectra using the PCA data. The power spectrum is well-described by a band-limited noise component plus a power-law at low frequencies, and the 0.1-10 Hz fractional rms amplitude is 4%. The moderate level of timing noise and the strong power-law component in the energy spectrum indicate that the source was in an intermediate state between the canonical Soft and Hard states (See McClintock & Remillard, 2003, for a recent review of black hole spectral states.).
For the five RXTE observations, and range from 0.74-0.82 keV and 2.11-2.18, respectively, but neither parameter correlates with the overall flux. Also, it is notable that the total disk-blackbody flux does not correlate with the total flux. The change in the total flux is driven by the change in the power-law normalization. The other quantity that is significantly different between observations is the high energy cutoff. A cutoff is only required at high significance for the second spectrum from the top, and the cutoff is not as sharp for the bottom two spectra. Often BHCs pass quickly through intermediate states, and these observations represent a useful study of the spectral evolution during intermediate states.
For much of the current 2002-2004 outburst, 4U 1630–47 has shown dramatic X-ray flaring behavior that is uncommon, although rapid, high amplitude flux changes have been reported for at least one previous outburst (Dieters et al., 2000). Figure 3c shows an example of this behavior from a 2003 May RXTE observation. Although not shown in this work, we made a hardness-intensity diagram for this light curve, indicating that there is a tight correlation between hardness and intensity.
4 Summary and Conclusions
Fifteen of the 38 IGR sources are in the 4U 1630–47 field.
Only three of the sources are not detected, indicating that as many
as 12 of the sources are persistent. It is possible that a subset
of the IGR sources are part of a new population of persistent, hard,
intermediate luminosity X-ray sources.
For much of its current outburst, 4U 1630–47 has shown
dramatic flaring that is reminiscent of the flaring seen from
GRS 1915+105. For 4U 1630–47, the hardness and intensity are
correlated during the flares, indicating that these are hard
flares that are related accretion (and possibly ejection)
mechanisms rather than being due to, e.g., absoption from the
outer edge of the disk.
The ISGRI light curve (Figure 3a) and the
spectra shown in Figure 5 show that 4U 1630–47
spectrum gradually changed, and the main change is in the
normalization of the power-law component.
The RXTE spectra indicate that the high energy
cutoff also changes during the observations, and this sort of
evolution must be kept in mind when combining INTEGRAL
data from long observations.
Acknowledgments
JAT would like to thank Jerome Rodriguez, Luigi Foschini, and Katja Pottschmidt for help with the INTEGRAL data analysis. We also would like to thank Arvind Parmar for his help in getting this INTEGRAL Target of Opportunity observation done. JAT acknowledges partial support from NASA grant NAG5-12703. This research has made use of the SIMBAD database, operated at CDS, Strasbourg, France
References
- Courvoisier et al. (2003) Courvoisier, T. J.-L., Walter, R., Rodriguez, J., Bouchet, L., & Lutovinov, A. A., 2003, in International Astronomical Union Circular, 3
- Dieters et al. (2000) Dieters, S. W., et al., 2000, ApJ, 538, 307
- Hjellming et al. (1999) Hjellming, R. M., et al., 1999, ApJ, 514, 383
- Kuulkers et al. (2003) Kuulkers, E., Lutovinov, A., Parmar, A., Capitanio, F., Mowlavi, N., & Hermsen, W., 2003, The Astronomer’s Telegram, 149
- Kuulkers et al. (1997) Kuulkers, E., Parmar, A. N., Kitamoto, S., Cominsky, L. R., & Sood, R. K., 1997, MNRAS, 291, 81
- Malizia et al. (2004) Malizia, A., Bassani, L., DiCocco, G., Stephen, J., Walter, R., Bodaghee, A., & Bazzano, A., 2004, The Astronomer’s Telegram, 227
- Matt & Guainazzi (2003) Matt, G., & Guainazzi, M., 2003, MNRAS, 341, L13
- McClintock & Remillard (2003) McClintock, J., & Remillard, R., 2003, Review Article, astro-ph/0306213
- Molkov et al. (2003) Molkov, S., et al., 2003, The Astronomer’s Telegram, 176
- Oosterbroek et al. (1998) Oosterbroek, T., Parmar, A. N., Kuulkers, E., Belloni, T., van der Klis, M., Frontera, F., & Santangelo, A., 1998, A&A, 340, 431
- Parmar et al. (1997) Parmar, A. N., Williams, O. R., Kuulkers, E., Angelini, L., & White, N. E., 1997, A&A, 319, 855
- Patel et al. (2004) Patel, S. K., et al., 2004, ApJ, 602, L45
- Revnivtsev et al. (2003) Revnivtsev, M., Chernyakova, M., Capitanio, F., Westergaard, N. J., Shoenfelder, V., Gehrels, N., & Winkler, C., 2003, The Astronomer’s Telegram, 132
- Rodriguez & Goldwurm (2003) Rodriguez, J., & Goldwurm, A., 2003, The Astronomer’s Telegram, 201
- Tomsick & Kaaret (2000) Tomsick, J. A., & Kaaret, P., 2000, ApJ, 537, 448
- Tomsick et al. (2004) Tomsick, J. A., Lingenfelter, R., Corbel, S., Goldwurm, A., & Kaaret, P., 2004, The Astronomer’s Telegram, 224
- Tomsick et al. (2003) Tomsick, J. A., Lingenfelter, R., Walter, R., Rodriguez, J., Goldwurm, A., Corbel, S., & Kaaret, P., 2003, IAU Circular, 8076
- Walter et al. (2004) Walter, R., et al., 2004, The Astronomer’s Telegram, 229