2 Departament de Fisica Aplicada, Universitat Politecnica de Catalunya, Av. del Canal Olimpic s/n, 08860, Castelldefels, Spain.
Mass distribution of DA white dwarfs in the First Data Release of the Sloan Digital Sky Survey
We investigate the sample of 1175 new nonmagnetic DA white dwarfs with the effective temperatures K, which were extracted from the Data Release 1 of the Sloan Digital Sky Survey. We determined masses, radii, and bolometric luminosities of stars in the sample. The above parameters were derived from the effective temperatures and surface gravities published in the DR1, and the new theoretical relations for carbon – core and oxygen – core white dwarfs. Mass distribution of white dwarfs in this sample exhibits the peak at (carbon core stars), and the tail towards higher masses. Both the shape of the mass distribution function and the empirical mass – radius relation are practically identical for white dwarfs with either pure carbon or pure oxygen cores.
Key Words.:
Catalogs – Stars: fundamental parameters – Stars: white dwarfs1 Introduction
The Sloan Digital Sky Survey is the very extensive and ambitious ground–based research project, aimed at the determination of positions, brightnesses, and acquiring of the optical spectra of millions of various celestial bodies. The SDSS was described in detail on their web page, http://www.sdss.org/, and in York et al. (2000). While this project was essentially designed to study galaxies, quasars, and large-scale structures in the Universe, its secondary targets are stars of various spectral types. We take advantage of the SDSS data on white dwarf stars of various classes, which recently were made publicly available as the subset of the Data Release 1.
Comprehensive analysis of the photometric and spectral data on white dwarfs, which are available in the DR1, was presented in Kleinman et al. (2004). They have found 2935 white dwarfs of various types and related stars, and only few of them were spectroscopically identified previously. The number of well identified white dwarfs in their sample approaches the number of white dwarf stars known previously, see McCook & Sion (1999), and the newest version of their catalogue available at http://www.astronomy.villanova.edu/WDCatalog/index.html/.
Kleinman et al. (2004) performed fitting of the observed spectra of 1833 nonmagnetic DA white dwarfs to the widely used theoretical grid of pure hydrogen model atmospheres by Detlev Koester (see Finley, Koester & Basri 1997). They have obtained effective temperatures in the range K. Surface gravities of stars in the sample range from low values corresponding to subdwarfs to the most massive white dwarfs of the highest .
The referee pointed out, that the SDSS DR1 values of determined for stars with K are systematically larger than for hotter stars, and are larger than expected for white dwarfs, cf. Fig. 9 in Kleinman et al. (2004). The explanation of this effect was not found, however, they favor the possibility that cooler model atmospheres exhibit systematic errors in the parametrisation of convection, or in the fitting procedure. As the result, they do not claim that the high values of are real. To avoid distortion of the high-mass tail presented in Fig. 1 we analyse a subset of the original SDSS DR1 sample which includes 1175 DA white dwarfs with K.
The Koester’s grid does not include spectra of models with high gravities, . Therefore, available determinations of also do not exceed 9.0, and this is an artificial bias which influences the determination of for over 20 most massive DA white dwarfs in the whole SDSS DR1 sample.
One can note, that white dwarfs of the highest gravity exceeding 9.0 appear among previously known nonmagnetic DA stars. Compilation of the existing mass determinations by Należyty & Madej (2004) lists 6 such white dwarfs, with the maximum . Also the most recent paper by Dahn et al. (2004) reports the measurement of in the apparently most massive star LHS 4033. Inferred mass of this nonmagnetic DA star is , and the corresponding small radius , place this star close to the limiting Chandrasekhar mass.
2 Mass distribution of DA white dwarfs
Masses and radii of the 1833 DA white dwarfs in the whole SDSS DR1 sample were directly determined from the corresponding values of and . This method was introduced by Bergeron, Saffer & Liebert (1992), and is recommended for the analysis of large samples of stars. Resulting spectroscopic masses and radii, and their errors, strongly depend on the accuracy and reliability of the stellar atmosphere and the hydrogen line formation theory.
Given and of a star, the mass and radius were computed from the combination of the relations:
1. Definition of the surface gravity
| (1) |
2. Theoretical mass – radius relation
| (2) |
We have used here relations by Panei et al. (2000), which are briefly discussed in the following Section. The reference set of spectroscopic and values was obtained assuming relations for pure carbon core and hydrogen envelope of all white dwarfs. Assumed mass of the envelope, .
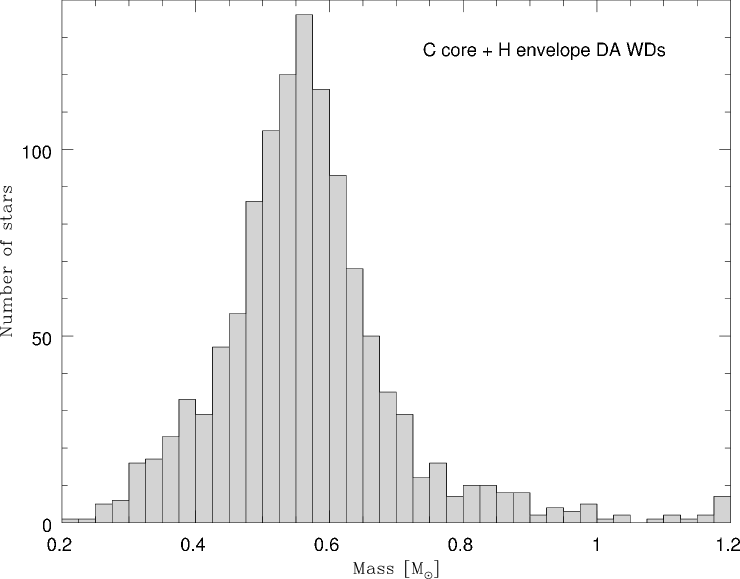
Computational results of our research are displayed in Figs. 12. Fig. 1 presents the mass distribution of 1175 DA white dwarfs with K. Stars are grouped in relatively narrow bins of 0.025 width. Masses of investigated stars range from up to . The mass distribution exhibit both the peak at and the high mass tail. Distinct asymmetry of the mass distribution and the apparent excess of stars just below the maximum mass of seems a real feature, due to the very high number of white dwarfs in Fig. 1.
The secondary peak at obviously is not a real feature. Due to limitations in Koester’s grid of model atmospheres, Kleinman et al. (2004) have arbitrarily assigned the maximum to all white dwarfs, which probably have even higher surface gravities. Stars with clump at in the relations for carbon – core white dwarfs (Panei et al. 2000).
Fig. 2 presents the empirical mass-radius relation for the same set of 1175 hot DA stars in the SDSS DR1 sample. The relation does not extend to masses higher than , or rather gravities . For the lowest masses we note a scatter of the points. This is because here the surface gravities are much lower than in the high mass tail of white dwarfs, hence the thickness of atmospheres (contributing to ) is much larger, and is strongly dependent on the of a star.

3 Theoretical M-R relations
The mass – radius relations used in this work are those described in Panei et al. (2000). These authors have presented detailed finite temperature mass – radius relations for white dwarfs with helium, carbon, oxygen, silicon, and iron cores based on a complete and updated treatment of the white dwarf evolution. Constitutive physics of the stellar models includes the equation of state for the low-density regime from Saumon et al. (1995) for hydrogen and helium plasmas, and ionic, coulomb interactions, partially degenerate electrons, electron exchange, and Thomas–Fermi contributions at finite temperature for the high density regime. Radiative opacities are from OPAL (Iglesias & Rogers 1993) for zero metallicity and conductive opacities and neutrino emission rates for helium, carbon, oxygen, silicon, and iron composition from Itoh and collaborators (see Althaus & Benvenuto 1997).
The set of evolutionary sequences presented in Panei et al. (2000) are particularly appropriate for our purpose because they constitute a homogeneous sequence of mass-radius relations. In particular, such relations have been constructed for white dwarf masses ranging from 0.15 M⊙ to 0.5 M⊙ at intervals of 5 % for helium core composition; from 0.45 M⊙ to 1.2 M⊙ at intervals of 0.01 M⊙ for carbon, oxygen and silicon cores; and from 0.45 M⊙ to 1.0 M⊙ at intervals of 0.01 M⊙ for the case of an iron core.
In particular, for very low mass white dwarfs we have assumed a helium core composition because their progenitors never attain high enough central temperatures for helium to be ignited at their cores. The evolutionary sequences were computed down to log L, and cover the effective temperature range from 145000 K to 4000 K. In addition, two cases for the hydrogen envelope have been considered: ( for the helium core models), and . The mass of the pure helium layer above the core amounts to 1 % of the stellar mass.
4 Mass and radius errors
The SDSS DR1 tables list errors of their and values for each star, which we denote here as and . We transform them to mass and radius errors, and , in the following way.
Eqs. 12 imply, that small increments of all 4 parameters can be expressed as
| (3) |
| (4) |
Eqs. 34 form the system of two algebraic equations for two unknown numbers, and . Errors and are known from the input catalogue by Kleinman et al. (2004), and all the coefficients (including both partial derivatives) can easily be computed at the points (), and the latter were determined already.
| (6) |
Finally, we accepted absolute values of the above expressions as the real and errors.
The average mass and radius errors resulting from our analysis of the SDSS DR1 catalogue of DA white dwarfs are: , and km, respectively.
5 Core composition of white dwarf stars
White dwarfs are thought to have a carbon/oxygen core, the exact proportions of which are uncertain and fixed by the mixing processes occurred prior to the formation of a white dwarf. Unfortunately, theoretical relations for white dwarfs having cores with mixtures of carbon and oxygen were not available at the time when our research was performed. However, we believe that the pure carbon and pure oxygen core compositions of Panei et al. (2000) would bracket the real one. Also, for stellar masses larger than 1.05 solar masses, the core composition is probably a mixture of oxygen and neon, being oxygen the dominant one, and for lower than a pure helium core is expected.
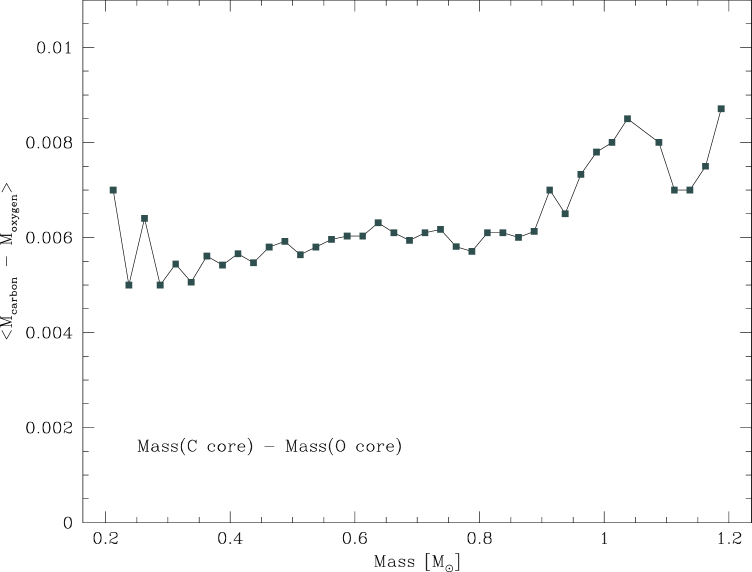
We have determined a similar set of white dwarf masses and radii assuming relations corresponding to the pure oxygen core plus H envelope of the same mass as for the pure carbon core, . Resulting differences between both grids of masses are very small. The mass of a carbon core DA white dwarf was always higher than the oxygen core mass of the same star in the whole range of . The average difference between masses of both types is equal to in our sample of 1175 stars, see Fig. 3.
All the stars in our sample were grouped in bins of the width , similarly as in Fig. 1. Dots in Fig. 3 correspond to the average difference in each bin. One can note, that there is little evidence of a systematic trend in the run of the difference vs. mass . The above difference increases with a white dwarf mass only insignificantly.
Similar comparison was also performed for DA white dwarfs with carbon masses . We have found 71 such stars in our sample of 1175, and computed the differences between masses derived either from the corresponding either to pure helium, or pure carbon cores , respectively. Spectroscopic mass of a helium core white dwarf was always higher than the mass of a carbon core star, and the average difference amounts to .
6 Concluding remarks
1. We have determined the distribution of DA white dwarf masses for the magnitude limited sample of 1175 stars in the SDSS DR1 table. Our mass distribution exhibits the peak at , and slight asymmetry towards both higher and lower masses.
The peak mass of this paper is in excellent agreement with earlier studies, which used much less numerous samples and various methods of white dwarf mass determination. We present here a brief listing of previously determined peak masses of DA white dwarfs. Unfortunately, the early paper by Shipman (1979) does not provide data corresponding to data of other papers, which are collected in Table 1.
There exists a striking consistency of all peak mass determinations, in spite of relatively nonnumerous samples in the above listing. Our research adds the peak mass to the list (carbon core stars), which perfectly confirms the value of by Bergeron, Saffer & Liebert (1992). Moreover, we claim that have reliably determined the shape of mass distribution of DA white dwarfs, except for the single bin in Fig. 1, corresponding to the most massive stars.
2. We note, that spectroscopic masses and radii in the present and earlier papers can still exhibit systematic errors due to uncertainties in the present theories of plasma physics. Theoretical profiles of the Balmer lines in spectra of DA white dwarfs are very strongly broadened, and the dominant contributor is the pressure broadening of line wings. The correct description of the pressure broadening in dense plasma of high gravity white dwarf atmospheres is a very difficult problem.
Recently Wujec et al. (2002) proposed the new method of Stark broadening calculations based on simulation techniques. Their theory is able to compute the broadening, shift, and asymmetry parameters of Stark broadened hydrogen line opacity profile. Previous Stark broadening calculations were not able to include all the three plasma effects simultaneously. However, no grids of theoretical Balmer line profiles in white dwarf spectra by Wujec et al. (2002) are currently available.
3. Catalogues of masses, radii, resulting bolometric luminosities for both C – core and O – core white dwarfs, and all the input parameters are available from authors on request. Bolometric luminosities and their errors are given by the following expressions
| (7) |
| (8) |
| – | Koester, Schulz & Weidemann (1979), average | |
| mass of 122 DA white dwarfs | ||
| – | Weidemann & Koester (1984), 70 DA WD stars | |
| – | McMahan (1989), 53 DA white dwarfs | |
| – | Weidemann (1990) | |
| – | Bergeron, Saffer & Liebert (1992), 129 DA white | |
| dwarfs | ||
| – | Liebert & Bergeron (1995), 200 white dwarfs from | |
| the Palomar Green survey (Green et al. 1986) | ||
| – | Finley, Koester & Basri (1997), 174 DA white | |
| dwarfs, some with cool companions | ||
| – | Marsh et al. (1997a,b), 89 stars of the ROSAT | |
| All-Sky X-ray and EUV Surveys | ||
| – | Vennes et al. (1997), 110 EUV selected DA WDs | |
| – | Vennes (1999), 141 EUV/X-ray selected WDs |
Acknowledgements.
JM and MN acknowledge support by grant No. 1 P03D 001 26 from the Polish Committee for Scientific Research. LGA acknowledges the Spanish MCYT for a Ramón y Cajal Fellowship. We are grateful to the referee for his remarks on the original version of our paper. Funding for the creation and distribution of the SDSS Archive has been provided by the Alfred P. Sloan Foundation, the Participating Institutions, the National Aeronautics and Space Administration, the National Science Foundation, the U.S. Department of Energy, the Japanese Monbukagakusho, and the Max Planck Society. The SDSS Web site is http://www.sdss.org/. The SDSS is managed by the Astrophysical Research Consortium (ARC) for the Participating Institutions. The Participating Institutions are The University of Chicago, Fermilab, the Institute for Advanced Study, the Japan Participation Group, The Johns Hopkins University, Los Alamos National Laboratory, the Max-Planck-Institute for Astronomy (MPIA), the Max-Planck-Institute for Astrophysics (MPA), New Mexico State University, University of Pittsburgh, Princeton University, the United States Naval Observatory, and the University of Washington.References
- (1) Althaus, L.G., Benvenuto, O.G. 1997, ApJ, 477, 313
- (2) Bergeron, P., Saffer, R.A., Liebert, J. 1992, ApJ, 394, 228
- (3) Dahn, C.C., Bergeron, P., Liebert, J., Harris, H.C., Leggett, S.K. 2004, ApJ accepted, astro-ph/0312588
- (4) Finley, D.S, Koester, D., Basri, G. 1997, ApJ, 488, 375
- (5) Green, R.F., Schmidt, M., Liebert, J. 1986, ApJS, 61, 305
- (6) Iglesias, C.A., Rogers, F.R. 1993, ApJ, 412, 752
- (7) Kleinman, S.J., Harris, H.C., Eisenstein, D.J., et al. 2004, ApJ, 20 May 2004, astro-ph/0402209
- (8) Koester, D., Schulz, H., Weidemann, V. 1979, A&A, 76, 262
- (9) Liebert, J., Bergeron, P. 1995, In ’White Dwarfs’, eds. D. Koester & K. Werner, Lecture Notes in Physics, Springer, 12
- (10) Marsh M.C., Barstow M.A., Buckley D.A., Burleigh M.R., Holberg J.B., Koester D., O’Donoghue D., Penny A.J., Sansom A.E. 1997a, MNRAS, 286, 369
- (11) Marsh M.C., Barstow M.A., Buckley D.A., Burleigh M.R., Holberg J.B., Koester D., O’Donoghue D., Penny A.J., Sansom A.E. 1997b, MNRAS, 287, 705
- (12) McCook G.P., Sion E.M. 1999, ApJS, 121, 1
- (13) McMahan R.K. 1989, ApJ, 336, 409
- (14) Należyty, M., Madej, J. 2004, A&A, in print
- (15) Panei J.A., Althaus L.G., Benvenuto O.G. 2000, A&A, 353, 970
- (16) Saumon, D., Chabrier, G., Van Horn, H.M. 1995, ApJS, 99, 713
- (17) Shipman H.L., 1979, ApJ, 228, 240
- (18) Vennes S., 1999, ApJ, 525, 995
- (19) Vennes S., Thejll P.A., Galvan R.G., Dupuis J. 1997, ApJ, 480, 714
- (20) Weidemann V. 1990, ARA&A, 28, 103
- (21) Weidemann V., Koester D. 1984, A&A, 132, 195
- (22) Wujec, T., Olchawa, W., Halenka, J., Musielok, J. 2002, Phys. Rev. E, 66, 066403
- (23) York, D.G., Adelman, J., Anderson, J.E., Jr., et al. 2000, AJ, 120, 1579