Orbital Parameters for the Black Hole Binary XTE J1650-5001
Abstract
We present -band photometry of the X-ray transient and candidate black hole binary XTE J1650-500 obtained between 2003 May and August with the 6.5m Clay Telescope. A timing analysis of these data reveals a photometric period of days (i.e. 7.63 hr) with a possible alias at 0.3785 days (9.12 hr). Our photometry completely rules out the previously published spectroscopic period of 0.212 days (5.09 hr). Consequently, we reanalyzed the 15 archival ESO/VLT spectra (obtained 2002 June by Sanchez-Fernandez et al.) that were the basis of the previously published spectroscopic period. We used a “restframe search” technique that is well suited for cases when the signal-to-noise ratio of individual spectra is low. For each of roughly 1.1 million binary ephemerides, we summed all of the spectra in a trial restframe of the secondary star, and each restframe spectrum was cross-correlated against a template spectrum. We then searched for the set of orbital parameters that produced the strongest cross-correlation value. The results confirmed the photometric period of 0.3205 days, and rule out the alias period near 0.38 days. The best value for the velocity semiamplitude of the companion star is km s-1, and the corresponding optical mass function is . The spectral type of the companion star is not well constrained because we only have six template spectra available to us. The K4V template provides the best match; next best matches are provided by the G5V and K2III templates. We also find that the accretion disk dominates the light in the -band where the disk fraction is 80% or higher, although this value should be treated with caution owing to the poor signal-noise-ratio and the limited number of templates. The amplitude of the phased -band light curve is 0.2 magnitudes, which gives a lower limit to the inclination of in the limiting case of no contribution to the -band light curve from the accretion disk. If the mass ratio of XTE J1650-500 is similar to the mass ratios of other black hole binaries like A0620-00 or GRS 1124-683 (e.g. ), then our lower limit to the inclination gives an upper limit to the mass of the black hole in XTE J1650-500 of . However, the mass can be considerably lower if the -band flux is dominated by the accretion disk. For example, if the accretion disk does contribute 80% of the flux, as our preliminary results suggest, then the black hole mass would be only about .
1 Introduction
X-ray novae (XN) provide the strongest evidence for the existence of stellar mass black holes. XN are interacting binaries where a neutron star or a black hole accretes matter from a companion (usually a dwarf-like K or M star). The accretion rate on to the black hole increases substantially during the outburst phase, and hence the X-ray luminosity can vary by large amounts (e.g. factors of or more). The majority of XN spend most of their time in a “quiescent” state where the X-ray luminosity is on the order of the optical luminosity of the companion star. It is in quiescence where the companion star can be best studied in the optical, where the observed radial velocity and light curves of the companion lead to dynamical mass measurements for the compact primary. There are 18 X-ray binaries (15 of them XN) where the mass of the primary has been shown to exceed the maximum mass of a stable neutron star (, Kalogera & Baym 1996), confirming the presence of black holes in these systems: GRO J0422+32 (Orosz & Bailyn 1995, Filippenko, Matheson, & Ho 1995); A0620-00 (McClintock & Remillard 1986); GRS 1009-45 (Filippenko et al. 1999); XTE J1118+480 (McClintock et al. 2001, Wagner et al. 2001); GS 1124-683 (Remillard, McClintock, & Bailyn 1992); 4U 1543-47 (Orosz et al. 1998); XTE J1550-564 (Orosz et al. 2002); GRO J1655-40 (Bailyn et al. 1995); GX 339-4 (Hynes et al. 2003); H1705-250 (Remillard et al. 1996); SAX J1819.3-2525 (Orosz et al. 2001); XTE J1859+226 (Filippenko & Chornock 2001); GRS 1915+105 (Greiner, Cuby, & McCaughrean 2001); GS 2000+25 (Casares, Charles, & Marsh 1995); GS 2023+338 (Casares, Charles, & Naylor 1992); Cyg X-1 (Gies & Bolton 1986); LMC X-3 (Cowley et al. 1983); LMC X-1 (Hutchings et al. 1987). These sources open up the possibility of studying general relativity in the strong field regime. For example, the study of high frequency quasiperiodic oscillations in the X-ray light curves of certain XN may lead to a measurement of black hole spin (e.g. McClintock & Remillard 2004 and cited references). We must press hard to obtain further observations of black hole masses in order to fully pursue these opportunities.
XTE J1650-500 (hereafter J1650) was discovered by RXTE on 2001 September 5 (Remillard 2001) and subsequently reached a peak X-ray intensity of 0.5 Crab. Based on subsequent observations, J1650 was established as a strong black hole candidate based on its X-ray spectrum and variability in the X-ray light curve (Markwardt, Swank, & Smith 2001; Revnivtsev & Sunyaev 2001; Wijnands, Miller, & Lewin 2001). The radio counterpart was discovered with the Australia Telescope Compact Array (ATCA) by Groot et al. (2001). Further radio observations sampled the behavior of XTE J1650-500 along all its X-ray states (Corbel et al. in preparation). We highlight two key results obtained during its outburst phase. First, RXTE observations during the third and fourth weeks of the outburst yielded a strong X-ray QPO with an rms amplitude of at a frequency of Hz (Homan et al. 2003b). Second, XMM-Newton observed a broad, skewed emission line due to Fe K (Miller et al. 2002). Those authors argue that their results imply the primary is a nearly maximal Kerr black hole that is delivering its spin-down energy to the accretion flow.
The first significant observational program in the optical was that of Sanchez-Fernandez et al. (2002, hereafter SF2002). They observed J1650 on the night of 2002 June 10 with the fourth 8.2m telescope at the European Southern Observatory, Paranal, and reported the following orbital elements: an orbital period of days and a velocity semiamplitude of km s-1, resulting in an optical mass function of . The results in this paper contradict these findings.
In this paper we report the results of our photometric study of J1650. A time series analysis of our photometry rules out the orbital period reported by SF2002. Consequently we also report herein our reanalysis of the SF2002 data obtained from the ESO archives. We show that the spectroscopic period we derive from these data is consistent with our photometric period days, and we go on to determine the orbital elements of the system. We outline below our observations and reductions, and our analysis techniques. We end with a brief discussion of the implications of our results regarding the fast QPO observed for J1650.
2 Observations
2.1 Optical Photometry
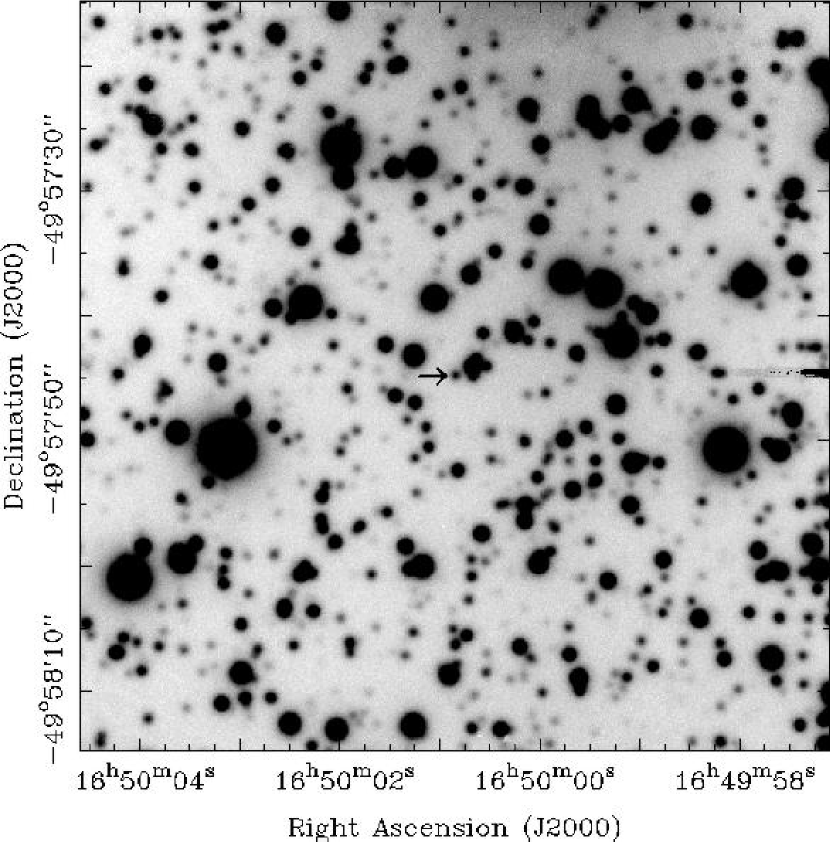
We observed J1650 with the 6.5m Clay telescope at Las Campanas Observatory of the Carnegie Institution 2003 May 31 and June 1 using the Magellan Instant Camera (MagIC) and an -band filter. A total of 47 -band images with typical exposure times between 500 and 600 seconds were obtained over the two nights in good conditions: the average seeing was arcsec and it was photometric about 75% of the time. M. Holman and P. Schechter kindly provided an additional 65 images obtained 2003 August 1 and 2 using the same instrumentation, and the observing conditions were comparable to those just described. In order to minimize readout time, the MagIC camera is read out simultaneously using four amplifiers. Thus, bias and flat-fielding is done separately for each quadrant of the detector. These calibrations and the merging of the quadrant images into a single image were performed using the publicly-available MagIC reduction pipeline. Stetson’s programs DAOPHOT IIe, ALLSTAR, and DAOMASTER (Stetson, 1987, 1990; Stetson, Davis, & Crabtree, 1991; Stetson, 1992a, b) were used to extract the stellar intensities and derive the light curve for J1650 (see Orosz & Wade 1999 for a detailed discussion of the overall procedure used). This suite of codes gives robust instrumental magnitudes. DAOPHOT fits the point spread function (PSF) for each image using several relatively isolated bright stars, and ALLSTAR uses the PSF and finds instrumental magnitudes for all of the stars on an image simultaneously (local background subtraction is included). Finally DAOMASTER iteratively solves for zero-point shifts in the magnitude scales from image to image by essentially using all of the stable stars as “comparison” stars. Thus the final results are insensitive to changes in the seeing and to changes in the sky transparency. Fig. 1 shows a finding chart for J1650 made from the MagIC data.
2.2 Optical Spectroscopy
SF2002 observed J1650 on the night of 2002 June 10 with the fourth 8.2m telescope at the European Southern Observatory, Paranal, using the FORS2 imaging spectrograph with an MIT CCD mosaic, the 1200R grism, the GG435 blocking filter, and a fixed slit width of 0.7 arcsecond. This instrumental configuration yields a wavelength range of 5750-7310 Å with a resolution of about 0.76 Å FWHM. SF2002 obtained a total of 15 spectra of J1650 in somewhat marginal seeing (typically between 1.0 and 1.5 arcseconds). They also obtained the spectra of six bright G- and K-type dwarfs using the same instrumental configuration. We obtained these data from the ESO archive, and used tasks in IRAF111IRAF is distributed by the National Optical Astronomy Observatories, which are operated by the Association of Universities for Research in Astronomy, Inc., under cooperative agreement with the National Science Foundation. to perform the CCD reductions and to extract the spectra. Since the flat field and wavelength calibration images were obtained exclusively during the daytime hours at Paranal, it was necessary to correct for flexure in the spectrograph by applying small corrections (Å) to the wavelength scales of the extracted spectra using bright night-sky emission lines.
3 Analysis
The Magellan light curve of J1650 showed considerable variability, so we phased the data on the period reported by SF2002 ( days). To our surprise, the light curve phased on that period showed considerable scatter. Consequently, we searched the Magellan light curve for periodicities using the ELC code with its genetic fitting algorithm (Orosz & Hauschildt 2000; Orosz et al. 2002). About 1,106,000 ellipsoidal models were generated and compared with the data using the absolute deviation as the merit function:
where denotes the model value computed at , is the observed quantity at the same , and is the uncertainty in . This merit function is more robust than the function because it is less sensitive to a few outlying points. Models were computed using a period range of 0.15 to 0.50 days. After all of the fits were performed, the merit function hypersurface was projected onto the trial period axis (see Orosz et al. 2002 for a more in-depth discussion of this error estimation technique); the resulting periodogram is shown in the top of Fig. 2. The absolute deviation has a minimum value at a trial period of 0.3205 days, and a secondary minimum at a trial period of 0.3785 days.
Fig. 3 (top) shows the Magellan light curve phased on a period of days. There is no dip in the absolute deviation near the period reported by SF2002 ( days), and the light curve phased on that period is essentially a scatter plot (bottom of Fig. 3). As a check on our results, we used the ‘pdm’ task in IRAF, which is an implementation of the phase dispersion technique of Stellingwerf (1978). A similar periodogram was obtained. To estimate the error on our photometric measurement of the orbital period, we did additional fits using ELC’s genetic algorithm and the normal as the merit function. We find a uncertainty of about 0.0007 day, so we adopt day.
We then analyzed the VLT spectra in an attempt to understand the disagreement of our photometric period with the spectroscopic period reported by SF2002. We tried to extract radial velocities using the standard cross-correlation technique of Tonry & Davis (1979, implemented in the IRAF ‘fxcor’ task). However, we found that the spectra were very noisy and yielded only a few marginal measurements of velocity. We therefore used the “restframe” analysis that we developed for H1705-250 (Remillard et al. 1996). This technique is similar to the “skew mapping” technique sometimes used for cataclysmic variables (Smith, Cameron, & Tucknott 1993; Vande Putte et al. 2003), and is quite simple to employ. Suppose one has a time series of spectroscopic observations. If the spectra are Doppler shifted to zero velocity and coadded using the correct orbital elements (e.g. the period , the semiamplitude and the time of maximum velocity ), then the absorption features of the companion star will appear at the same wavelengths in all of the individual spectra. Consequently, the lines in the summed spectrum will have a higher signal-to-noise ratio than in the individual spectra. If, on the other hand, one uses the incorrect orbital elements, then the absorption lines from the companion will be at different wavelengths in different individual spectra, and hence will be “averaged out” in the resulting summed spectrum.
In our implementation of the restframe analysis, we used a FORTRAN program that writes IRAF scripts to do the Doppler shifting and the spectrum summation. The fxcor task was used to provide a measure of how well a restframe spectrum matched the template spectrum. In particular, we used the peak cross-correlation value as the measure of the goodness-of-fit of the template spectrum to the restframe spectrum. The wavelength region used for the cross-correlation analysis was 5907-6261Å, 6304-6513Å, 6610-6800Å, and 7000-7239Å. This region excludes telluric lines, and the H emission line.
We are interested in three orbital elements: the period , the semiamplitude and the time of maximum velocity . This three dimensional parameter space was searched by making two dimensional grids of restframe spectra in the plane at several different values of the period . Specifically, we used periods in the range 0.1500 to 0.5000 days in steps of 0.0020 days. The restframe spectra for each trial period were stored in a separate subdirectory on disk. For each period, we constructed a grid of restframe spectra in the plane as follows. The range considered for was 300–600 km s-1 in steps of 2 km s-1. For the range was centered on HJD 2,452,436.6 and the step size was 0.005 days. The extent of the range for was adapted to accommodate the trial value of the period. An individual restframe spectrum was generated for each set of orbital elements. In total we generated 1,166,146 restframe spectra using this same number of scripts stored as separate files.
Next, we did a cross-correlation analysis on the restframe spectra. It was therefore necessary to find a good template spectrum. To do this, we adopted a period of 0.320 days found from the photometry and considered the restframe spectra in the plane at this period. We then cross-correlated these restframe spectra against all six of the template spectra in turn and determined that the K4V star BS5568 provided the best match since it gave the strongest cross-correlation peaks. Next, all of the restframe spectra at all periods were cross-correlated in batch mode against the K4V template. We made a periodogram by parsing the fxcor log files to get the peak cross-correlation value for each restframe spectrum. The maximum peak cross-correlation value within each period subdirectory was saved, resulting in the periodogram shown at the bottom of Fig. 2. The maximum cross-correlation value occurs for a trial period of days, in agreement with the photometric results, which thereby establishes the orbital period. Thus, we rule out the alias photometric period near 0.38 days and again rule out the 0.212 day spectroscopic period reported by SF2002 (Fig. 2). We also made a periodogram using a template with spectral type G5V. Overall, the cross-correlation values were much lower and the periodogram was much noisier. However, there still was a peak near days, and we conclude our adopted spectroscopic period is not sensitive to the choice of the template.
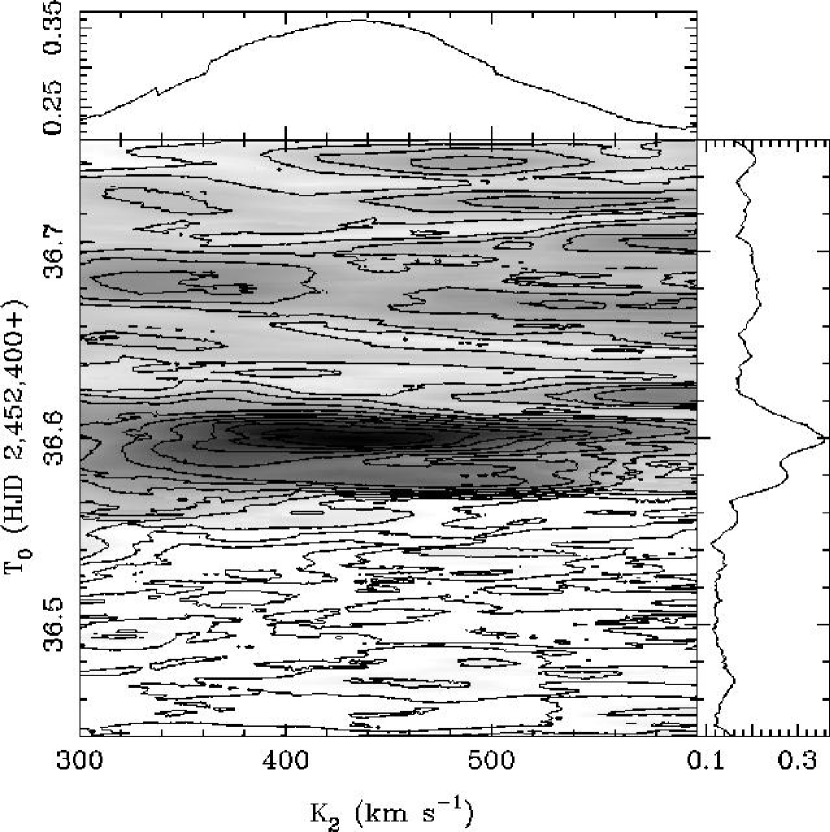
Adopting a period of days, we performed a finer search of the plane, with step sizes of 1 km s-1 in and 0.001 days in . The results are shown in Fig. 4. The cross-correlation values have a fairly well-defined peak value along the axis, where the maximum cross-correlation is for (HJD). On the other hand, the peak along the axis is broad with a maximum that occurs in the range km s-1. Judging from the width of the peak and on our experience with H1705-250 (Remillard et al. 1996), we adopt km s-1. The optical mass function is then
The best restframe spectrum found for the finer grid is shown in Fig. 5. Although few obvious K-star absorption features are apparent, the cross-correlation of this restframe spectrum using the K4V star BS 5568 as a template does yield a significant peak near zero velocity (Fig. 5).
Since the spectroscopic period agrees with the photometric period, our initial determination that the K4V template provides the best match needs no refinement. In order to be more quantitative, we cross-correlated the best restframe spectrum from the fine grid against all six template spectra. Table 2 gives the cross-correlation value at the peak and the Tonry & Davis ‘’ value (which is a measure of the significance of the peak) for each template. As noted earlier, the K4V template has the best cross-correlation, so we adopt a spectral type of K4V for the companion star. However, one should note that the GV5 star BS 7330 provides the second-best match, and as such our assignment of a spectral type of K4V should be treated with caution. We attempted to decompose the restframe into its stellar and accretion disk components using the technique outlined in Marsh, Robinson, & Wood (1994). Using the K4V template BS 5568, we found that the accretion disk dominates in the -band, where its contribution is . However, owing to the limited number of templates and the poor signal-to-noise, this result should also be treated with caution.
Our measurement of the optical mass function sets a lower limit on the mass of the compact primary. To find the actual mass we need to find the mass ratio of the two components and inclination of the orbital plane. If the companion star fills its Roche lobe and is in synchronous rotation, the mass ratio can be computed if one can measure and the projected rotational velocity of the companion star (e.g. Wade & Horne 1988). One can also get an estimate of the mass ratio if the radial velocities of the H emission line can be reliably measured (e.g. Orosz et al. 1994). However, in the case of J1650, the poor quality of the spectroscopic data prevents us from making either measurement. We can use our Magellan light curve to place some constraints on the inclination. However, the results are sensitive to the amount of light the accretion disk contributes in the -band, and our estimate of the disk contamination outlined above is quite uncertain. Nevertheless, if we assume the limiting case of no light from the disk in the -band, then we find an inclination of (see Fig. 3 for a representative model for this case). If we add a substantial contribution from the disk in the -band (), then the inclination is or higher (a representative ellipsoidal model for this case is also shown in Fig. 3). Owing to the lack of X-ray eclipses, the inclination is less than about (the exact limit depends on the mass ratio). If, for the sake of discussion, we assume the mass ratio of J1650 is similar to that of A0620-00 or GRS 1124-683 (), then an inclination of combined with our measured value of the optical mass function yields a black hole mass of . Likewise, an assumed inclination of yields a black hole mass of .
4 Discussion
Is general relativity (GR) the correct theory of gravity in the strong fields found near a black hole? One promising approach to answering this fundamental question is offered by the key discovery of the Rossi X-ray Timing Explorer (RXTE) that seven Galactic black holes (including J1650) display quasiperiodic (QPO) X-ray oscillations in the range of Hz (McClintock & Remillard 2004 and cited references). These fast QPOs must be produced near the event horizon since the X-rays originate there and since such high frequencies are comparable to the Kepler frequency of the innermost stable circular orbit around a black hole ( depending on the dimensionless spin parameter , where the full range of is 0 to 1 e.g. Kato, Fukue, & Mineshige 1998).
RXTE has made a further important discovery: four of these seven black holes produce pairs of stationary, fast QPOs that have frequencies in a 3:2 ratio (McClintock & Remillard 2004; Homan et al. 2003a). Such commensurate frequencies are a hallmark of non-linear resonance phenomena. Thus, this discovery has promoted a “resonance model” that invokes enhanced emissivity at the radius in the accretion disk where two of the three spatial coordinate frequencies (e.g. Keplerian and radial) are commensurate (Abramowicz & Kluzniak 2001; Abramowicz et al. 2003). For the three black holes with the QPO pairs and measured masses (e.g. GRO J1655-40, XTE J1550-564, and GRS 1915+105), the QPO frequency is correlated with the black hole mass, where (e.g. McClintock & Remillard 2004). This scaling is expected for GR oscillations, but different sources can lie on the same curve only if they have similar values of the dimensionless spin parameter .
Schnittman & Bertschinger (2004) performed ray tracing calculations in the Kerr metric for emitting blobs orbiting a black hole at a radius where there is a 3:1 resonance between the azimuthal () and radial coordinate frequencies. It was shown that general relativistic effects may impart a QPO at and a beat oscillation at with a relative strength that depends on the angular width of the emitting blob of material. This interpretation, when combined with accurate mass measurements, yields values for the dimensionless spin parameter: for GRO J1655-40 and for XTE J1550-564 (Remillard et al. 2002). This illustrates the potential diagnostic power of fast QPOs, if we can specify the correct oscillation mechanism. Furthermore, measurements of black hole mass and QPO frequency allow model-independent comparisons of spin differences between black hole subclasses as distinguished, for example, by relativistic jets or binary period.
With our measurement of the orbital period and optical mass function of J1650, we have taken the first steps need to fully exploit the potential of this system. If the QPO at Hz observed by Homan et al. (2003b) represents the oscillation, then the predicted mass of the black hole would be about , if J1650 lies on the same curve on which GRO J1655-40, XTE J1550-564, and GRS 1915+105 lie (i.e. if the black holes all have similar values of the dimensionless spin parameter ). Although there are substantial uncertainties in both our measured value for the optical mass function and in our inclination estimate, it appears that the black hole mass might be less than , which in the context of the orbital resonance model would imply that the value in J1650 is much smaller than it is for the other three sources (e.g. Abramowicz et al. 2004). On the other hand, on the basis of X-ray spectroscopy, Miller et al. (2002) have argued that J1650 contains a maximal Kerr black hole. Thus J1650 may be a challenging case for the orbital resonance model of the high frequency QPOs, although we again point out that our mass estimate has large uncertainties.
Recent models for black hole formation (e.g. Fryer & Kalogera 2001) predict a continuous and roughly exponential distribution of masses for black holes in binary systems, where the number of black holes formed falls off as the mass increases. Depending on their model assumptions, these authors predict the number of black holes with masses in the range should be roughly two to three times the number of black holes with masses in the range . Bailyn et al. (1998) performed a statistical analysis of seven black holes with dynamical mass estimates and found strong evidence for a peak in the mass distribution centered near and a “gap” in the distribution between the neutron star masses and the peak near . Since that time, the sample of objects has more than doubled, and it now appears that the evidence for a peak in the distribution near is weak (see the references cited in §1 and Orosz 2003). However, black holes with masses in the range still seem to be rare, with GRO J0422+32 being the only good candidate (Gelino & Harrison 2003). In this regard, J1650 is an interesting system because of its probable low mass.
Clearly additional data will be required to make more definitive statements about the mass of the compact object in J1650. It should not be unduly difficult to obtain higher quality spectra. In hindsight, we now know that the companion star is a K-star, and as such it should have relatively strong absorption features near 5170Å. This region was not included in the VLT spectra owing to the relatively high resolving power of the 1200R grism. It should be easier to measure radial velocities in spectra with more wavelength coverage (at the expense of resolving power). Also, spectral observations obtained in good to excellent seeing conditions ( arcseconds) obviously will have better signal-to-noise than the current spectra do (the seeing varied between 1 and about 1.4 arcseconds). Additional photometry should be obtained, and it would be helpful if two or more bandpasses could be used, since the amount of contaminating light from the disk should vary with color.
5 Summary
Using -band photometry of XTE J1650-500 obtained with the 6.5m Clay telescope, we have measured a photometric period of days. This value is confirmed by our reanalysis of archival spectroscopic data. Our reanalysis of the spectroscopy also yields a velocity semiamplitude for the companion star of km s-1, which when combined with the orbital period, gives an optical mass function of . The spectral type of the companion star is not well constrained because we only have six template spectra available to us. A template spectrum with a spectral type of K4V provides the best match; next best matches are provided by template spectra with spectral types of G5V and K2III, respectively. The summed spectrum suggests that the accretion disk may contribute a substantial amount of light in ( or more). Using the -band light curve, we find a lower limit to the inclination of , which gives an upper limit to the mass of the black hole of , assuming a mass ratio of . If we assume that the accretion disk contributes 80% of the light in , then the inclination would be about or more, and the black hole mass would be about (again assuming a mass ratio of ).
References
- Abramowicz & Kluzniak (2001) Abramowicz, M. A., & Kluzniak, W. 2001, A&A, 374, L19
- Abramowicz et al. (2003) Abramowicz, M. A., Karas, V., Kluzniak, W., Lee, W. H., & Rebusco, P. 2003, PASJ, 55, 467
- Abramowicz et al. (2004) Abramowicz, M. A., Kluźniak, W., Stuchlík, Z., & Török, G. 2004, A&A, in press (astro-ph/0401464)
- Bailyn et al. (1995) Bailyn, C. D., Orosz, J. A., McClintock, J. E., & Remillard, R. A. 1995, Nature, 378, 157
- Bailyn et al. (1998) Bailyn, C. D., Jain, R. K., Coppi, P., & Orosz, J. A. 1998, ApJ, 499, 367
- Casares, Charles, & Naylor (1992) Casares, J., Charles, P. A., & Naylor, T. 1992, Nature, 355, 614
- Casares, Charles, & Marsh (1995) Casares, J., Charles, P. A., & Marsh, T. R. 1995, MNRAS, 277, L45
- Cowley et al. (1983) Cowley, A. P., Crampton, D., Hutchings, J. B., Remillard, R., & Penfold, J. E. 1983, ApJ, 272, 118
- Filippenko, Matheson, & Barth (1995) Filippenko, A. V., Matheson, T., & Barth, A. J. 1995, ApJ, 455, L139
- Filippenko et al. (1999) Filippenko, A. V., Leonard, D. C., Matheson, T., Li, W., Moran, E. C., & Riess, A. G. 1999, PASP, 111, 696
- Filippenko & Chornock (2001) Filippenko, A. V., & Chornock, R. 2001, IAU Circ. #7644
- Fryer & Kalogera (2001) Fryer, C. L., & Kalogera, V. 2001, ApJ, 554, 548
- Gies & Bolton (1986) Gies, D. R., & Bolton, C. T. 1986, ApJ, 304, 371
- Gelino & Harrison (2003) Gelino, D. M., & Harrison, T. E. 2003, ApJ, 599, 1254
- Greiner et al. (2001) Greiner, J., Cuby, J. G., & McCaughrean, M. J. 2001, Nature, 414, 522
- Groot et al. (2001) Groot, P., Tingay, S., Udalski, A., & Miller, J. 2001, IAU Circ. #7708
- Homan et al. (2003a) Homan, J., Miller, J. M., Wijnands, R., Steeghs, D., Belloni, T., van der Klis, M., & Lewin, W. H. G. 2003a, ATel #162
- Homan et al. (2003b) Homan, J. Klein-Wolt, M., Rossi, S., Miller, J. M., Wijnands, R., Belloni, T., van der Klis, M., & Lewin, W. H. G. 2003b, ApJ, 586, 1262
- Hutchings et al. (1987) Hutchings, J. B., Crampton, D., Cowley, A. P., Bianchi, L., & Thompson, I. B. 1987, AJ, 94, 340
- Hynes et al. (2003) Hynes, R. I., Steeghs, D., Casares, J., Charles, P. A., & O’Brien, K. 2003, ApJ, 583, L95
- Kalogera & Baym (1996) Kalogera, V., & Baym, G. 1996, ApJ, 470, L61
- Kato, Fukue, & Mineshige (1998) Kato, S., Fukue, J., & Mineshige, S. 1998, Black Hole Accretion Disks (Kyoto: Kyoto University Press)
- Markwardt, Swank,& Smith (2001) Markwardt, C., Swank, J., & Smith, E. 2001, IAU Circ., 7707, 2
- Marsh, Robinson, & Wood (1994) Marsh, T. R., Robinson, E. L., & Wood, J. H. 1994, MNRAS, 266, 137
- McClintock & Remillard (1986) McClintock, J. E., & Remillard, R. A. 1986, ApJ, 308, 110
- McClintock et al. (2001) McClintock, J. E., Garcia, M. R., Caldwell, N., Falco, E. E., Garnavich, P. M., & Zhao, P. 2001, ApJ, 511, L147
- McClintock & Remillard (2004) McClintock, J. E., & Remillard, R. A. 2004, in Compact Stellar X-ray Sources, eds. W. H. G. Lewin & M. van der Klis, (Cambridge: Cambridge University Press), in press (astro-ph/0306213)
- Miller et al. (2002) Miller, J. M., Fabian, A. C., Wijnands, R., Reynolds, C. S., Ehle, M., Freyberg, M. J., van der Klis, M., Lewin, W. H. G., Sanchez-Fernandez, C., & Castro-Tirado, A. J. 2002, ApJ, 570, L69
- Orosz (2003) Orosz, J. A. 2003, in IAU Symp. 212, A Massive Star Odyssey: From Main Sequence to Supernova, ed. K. A. van der Hucht, A. Herraro, & C. Esteban (San Francisco: ASP), 365
- Orosz et al. (1994) Orosz, J. A., Bailyn, C. D., Remillard, R. A., McClintock, J. E., & Foltz, C. B. 1994, ApJ, 436, 848
- Orosz & Bailyn (1995) Orosz, J. A., & Bailyn, C. D. 1995, ApJ, 446, L59
- Orosz et al. (1998) Orosz, J. A., Jain, R. K., Bailyn, C. D., McClintock, J. E., & Remillard, R. A. 1998, ApJ, 499, 375
- Orosz & Hauschildt (2000) Orosz, J. A., & Hauschildt, P. H. 2000, A&A, 364, 265
- Orosz et al. (2001a) Orosz, J. A., Kuulkers, E., van der Klis, M., McClintock, J. E., Garcia, M. R., Callanan, P. C., Bailyn, C. D., Jain, R. K., & Remillard, R. A. 2001, ApJ, 555, 489
- Orosz et al. (2002) Orosz, J. A., Groot, P. J., van der Klis, M., McClintock, J. E., Garcia, M. R., Zhao, P., Jain, R. K., Bailyn, C. D., & Remillard, R. A. 2002, ApJ, 568, 845
- Orosz & Wade (1999) Orosz, J. A., & wade, R. A. 1999, MNRAS, 310, 773
- Remillard, McClintock, & Bailyn (1992) Remillard, R. A., McClintock, J. E., & Bailyn, C. D. 1992, ApJ, 399, L145
- Remillard et al. (1996) Remillard, R. A., Orosz, J. A., McClintock, J. E., Bailyn, C. D. 1996, ApJ, 459, 226
- Remillard (2001) Remillard, R. A. 2001, IAU Circ., 7707, 1
- Remillard et al. (2002) Remillard, R. A., Muno, M. P., McClintock, J. E., & Orosz, J. A. 2002, ApJ, 580, 1030
- Revnivtsev & Sunyaev (2001) Revnivtsev, M., & Sunyaev, R. 2001, IAU Circ., 7715, 1
- Sanchez-Fernandez et al. (2002) Sanchez-Fernandez, C., Zurita, C., Casares, J., Castro-Tirado, A. J., Bond, I., Brandt, S., & Lund, N. 2002, IAU Circ., 7989, 1 (SF2002)
- Schnittman & Bertschinger (2004) Schnittman, J. D., & Bertschinger, E. 2004, ApJ, in press (astro-ph/0309458)
- Smith et al (1993) Smith, R. C., Cameron, A. C., & Tucknott, D. S. 1993, in Cataclysmic Variables and Related Physics, eds. O. Regev & G. Shaviv, G., (Bristol: IOP Publishing), p. 70
- Stellingwerf (1978) Stellingwerf, R. F. 1978, ApJ, 224, 953
- Stetson (1987) Stetson, P. B., 1987, PASP, 99, 191
- Stetson (1990) Stetson, P. B., 1990, PASP, 102, 932
- Stetson, Davis, & Crabtree (1991) Stetson, P. B., Davis, L. E., Crabtree, D. R., 1991, in “CCDs in Astronomy,” ed. G. Jacoby, ASP Conference Series, Volume 8, page 282
- Stetson (1992a) Stetson P. B., 1992a, in “Astronomical Data Analysis Software and Systems I,” eds. D. M. Worrall, C. Biemesderfer, & J. Barnes, ASP Conference Series, Volume 25, page 297
- Stetson (1992b) Stetson, P. B., 1992b, in “Stellar Photometry–Current Techniques and Future Developments,” IAU Coll. 136, eds. C. J. Butler, & I. Elliot, Cambridge University Press, Cambridge, England, page 291
- Tonry & Davis (1979) Tonry, J., & Davis, M. 1979, AJ, 84, 1511
- Vande Putte et al. (2003) Vande Putte, D., Smith, R. C., Hawkins, N. A., & Martin, J. S. 2003, MNRAS, 342, 151
- Wade & Horne (1988) Wade, R. A., & Horne, K. 1988, ApJ, 324, 411
- Wagner et al. (2001) Wagner, R. M., Foltz, C. B., Shahbaz, T., Casares, J., Charles, P. A., Starrfield, S. G., & Hewett, P. 2001, ApJ, 556, 42
- Wijnands, Miller, & Lewin (2001) Wijnands, R., Miller, J. M., & Lewin W. H. G. 2001, IAU Circ., 7715, 2


| ParameteraaSee Orosz & Hauschildt (2000) for a full discussion of the parameters and their use in the ELC code. | Model A | Model B |
|---|---|---|
| (deg) | 79.0 | 51.7 |
| 20.7 | 1.1 | |
| (K) | 4500 | 4500 |
| 0.099 | 0.099 | |
| (K) | 15000 | |
| 0.01 | ||
| 0.99 | ||
| -0.3 | ||
| (deg) | 2.0 |
| Star | Spectral type | Cross-Correlation | Tonry & Davis |
|---|---|---|---|
| Peak Value | |||
| BS 5568 | K4V | 0.36 | 7.69 |
| BS 7330 | G5V | 0.27 | 6.84 |
| HD 11301 | K2III | 0.26 | 3.91 |
| BS 2668 | K0V | 0.18 | 1.88 |
| BS 8042 | G3 IV | 0.10 | 1.22 |
| HD 209290 | M0V | 0.06 | 0.70 |