Molecular hydrogen formation on dust grains in the high redshift universe.
Abstract
We study the formation of molecular hydrogen on dust grain surfaces and apply our results to the high redshift universe. We find that a range of physical parameters, in particular dust temperature and gas temperature, but not so much dust surface composition, influence the formation rate of H2. The H2 formation rate is found to be suppressed above gas kinetic temperatures of a few hundred K and for dust temperatures above 200-300 K and below 10 K. We highlight the differences between our treatment of the H2 formation process and other descriptions in the literature. We also study the relative importance of H2 formation on dust grains with respect to molecular hydrogen formation in the gas phase, through the H- route. The ratio of formation rates of these two routes depends to a large part on the dust abundance, on the electron abundance, and also on the relative strength of the FUV (extra-)galactic radiation field. We find that for a cosmological evolution of the star formation rate and dust density consistent with the Madau plot, a positive feedback effect on the abundance of H2 due to the presence of dust grains can occur at redshifts . This effect occurs for a dust-to-gas mass ratio as small as 10-3 of the galactic value.
1 Introduction
H2 formation in the universe is a process which has been studied extensively in the past decades, but which is still not well understood. In the interstellar medium, H2 formation occurs on grain surfaces, permitting three-body reactions that are much more efficient than gas phase reactions (Gould & Salpeter 1963). Many studies have been performed over the years and focussed on explaining the mechanisms involved in the H2 formation process on grain surfaces. It is clear that this process is governed by the mobility of the H atoms on the grain, as well as the energies binding the H atoms to the surface. The mobility of an adatom (the atom that is bound to the surface) is the combination of two processes: thermal diffusion and quantum tunneling. Therefore, an adatom can move on the surface of the grain, from site to site, through these two processes according to the temperature of the grain and the characteristics of the surface (Barlow & Silk 1976; Leitch-Devlin & Williams 1984; Tielens & Alamandola 1987). On astrophysically relevant surfaces (olivine and amorphous carbon), an adatom can bind in two energetically different sites: physisorbed sites and chemisorbed sites. Physisorbed atoms are weakly bound to the surface and are mobile for low grain temperatures (around 10 K), whereas chemisorbed atoms are bound stronger to the surface and become mobile for a grain temperature of a few hundred K (Barlow & Silk 1976; Aronowitch & Chang 1980; Klose 1992; Fromherz et al. 1993; Cazaux & Tielens 2002, 2004). Therefore, H2 formation strongly depends on the metallicity of the system (i.e., the dust abundance), the considered grains (olivine or amorphous carbon), the temperature of the grains and the atomic hydrogen abundance.
Studies of H2 formation in low metallicity systems – e.g., the high redshift universe – have already been performed (c.f. Tegmark et al. 1997; Glover 2003). H2 at high redshift is of prime importance since it is considered to be the only coolant below K. Therefore, as discussed by many authors, H2 plays a crucial role in the formation of the first stars (Haiman, Rees, & Loeb 1996; Haiman, Thoul, & Loeb 1996; Tegmark et al. 1997), and thus determines the end of the dark ages (Haiman, Abel, & Rees 2000). Other authors discussed the possibility of HD as a more efficient coolant because this molecule possesses a nonzero dipole moment, even though its abundance is much lower (Galli & Palla 1998; Nakamura & Umemura 2002). Norman & Spaans (1997) estimate a redshift of roughly unity, where H2 formation in the gas phase and H2 formation on grain surfaces are equally important. At high redshift, H2 formation proceeds through the H- route. Below a redshift of unity, grain surface reactions become more important relative to the (inefficient) H- route. Note that at high densities H2 is formed through three-body association.
These issues are of more than academic interest since the presence of
H2, either through the H- or dust grain routes, is instrumental
in the ability of low metallicity gas to cool and contract to form
stars. Because no dust grains are available prior to the formation of
pop III objects, the H- route is crucial in starting up the star
formation process, but the subsequent expulsion of metals in supernova
explosions and ambient dust formation can strongly enhance the
formation of molecular hydrogen (Hirashita, Hunt, & Ferrara 2002).
The construction of comprehensive models for the effects of dust
grains on early galaxy evolution and their observational consequences
is underway (c.f. Hirashita, Hunt, & Ferrara 2002; Spaans & Norman
1997; Kauffmann & Charlot 1998; Somerville, Primack & Faber 2001;
Glover 2003), motivated by upcoming observatories like ALMA and
JWST. In general, such studies adopt the H2 formation rate of
Hollenbach & McKee (1979). Although a good order of magnitude
estimate, recent work (Cazaux & Tielens 2002, 2004) has allowed the
formation of H2 (and HD) on dust grains to be computed more
accurately. Because the H2 chemistry plays such an important role
in the high redshift universe it is crucial to put it on the firmest
of physical bases. The aim of this paper is then to provide detailed
computations of the H2 formation efficiency and formation rate
as functions of ambient physical conditions and to extend earlier work
on the effects of dust grains on the physical properties of primordial
gas.
In this paper, we use the model developed by Cazaux & Tielens (2004) and extend it to accommodate the conditions in the high redshift universe. This model, which describes the formation of H2 on grain surfaces, takes into account the presence of both physisorbed and chemisorbed sites on the grain surface, and allows quantum mechanical diffusion as well as thermal diffusion for adatoms to go from site to site. In Section two, we calculate first the H2 formation efficiency for typical H fluxes, different surface characteristics, and different dust grain abundances, and second the H2 formation efficiency through the gas phase route (i.e., the H- route). In Section three, we discuss which are the physical conditions (i.e., dust and gas temperature, dust abundance, electron fraction) at which the H- route and grain surface route make equal contributions to the H2 formation rate. Then, we adopt a cosmological model in order to assess at which redshift this equality occurs, consistent with the star formation rate history described by Madau “the Madau plot” (e.g., the universal star formation rate as a function of redshift; Lilly et al. 1996; Madau et al. 1996). Therefore, we estimate when, in the history of the universe, the dust route became the dominant process toward H2 formation. In Section four, we discuss the effects of this gas to dust route transition on the star formation rate and the ambient radiation field.
2 H2 Formation
2.1 Dust grain Route
In this section we study the formation of H2 on interstellar grain surfaces. First, we discuss the typical range of the H flux in diffuse interstellar clouds. Second, we study the intrinsic properties of the grain (olivine or carbonaceous), the impact of the parameters characterizing the surface of the grain, and the role of the grain size distribution.
2.1.1 H Flux
A grain in the ISM is irradiated by H atoms from the gas phase. The H flux in a diffuse interstellar cloud is given by
| (1) |
where is the number of sites per on the surface of the
grain, the density of H atoms in the gas phase,
and the mean
velocity of these atoms. We assume sites
cm-2 for a 0.1 m grain, the density of H atoms to be between
1 and 100 particles per cm3, and the velocity of these atoms to be
between 1 and 10 km s-1.
Therefore, we consider a range for
the flux of where
is the flux of H atoms in monolayer per second (mLy s-1).
2.1.2 Characteristics and nature of the Grains
Surface Characteristics In this section we present
the characteristics of the grain surface that are relevant to the
model we use in this paper. This model has been discussed by
Cazaux & Tielens (2004), and describes how H2 forms on grain
surfaces.
When an atom hits a grain, it can either be bound to the
surface, if it arrives in an empty site, or it can go back into the
gas phase, if the site is occupied. This process follows Langmuir
kinetics. An adatom can bind to the surface in two energetically
different sites: a chemisorbed site or a physisorbed site. According
to the interaction between the atom and the surface, the mobility of
the adatom is set. Coming from the gas phase the atoms are first
physisorbed. Then they can either cross the barrier to go to a
chemisorbed site (depicted in Fig. 1) by moving
perpendicular to the surface, or go to another physisorbed site, by
moving along the surface. Considering an adatom H, the relevant
parameters for our study are the desorption energies of chemisorbed
hydrogen, , of physisorbed hydrogen ,
and of molecular hydrogen , as well as the energy of the
saddle point between a physisorbed and a chemsiorbed site and
the factor which is the fraction of the newly formed molecules
which stays on the surface. Fig. 1 illustrates these
parameters, in the case of a barrier between a physisorbed and a
chemisorbed site. Under steady state conditions, the H2 formation efficiency (i.e., the fraction of incoming atoms leaving
the grain as H2 molecules) varies with these parameters. When we
know the different physical processes involved in H2 formation on
grain surfaces, we can understand the impact of each parameter on the
H2 formation, and at which range of gas and dust temperatures it
occurs.
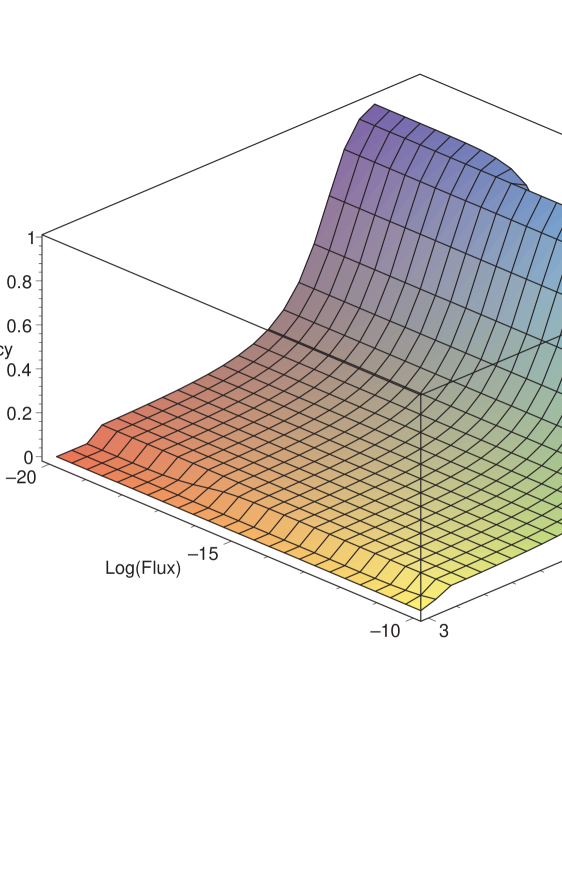
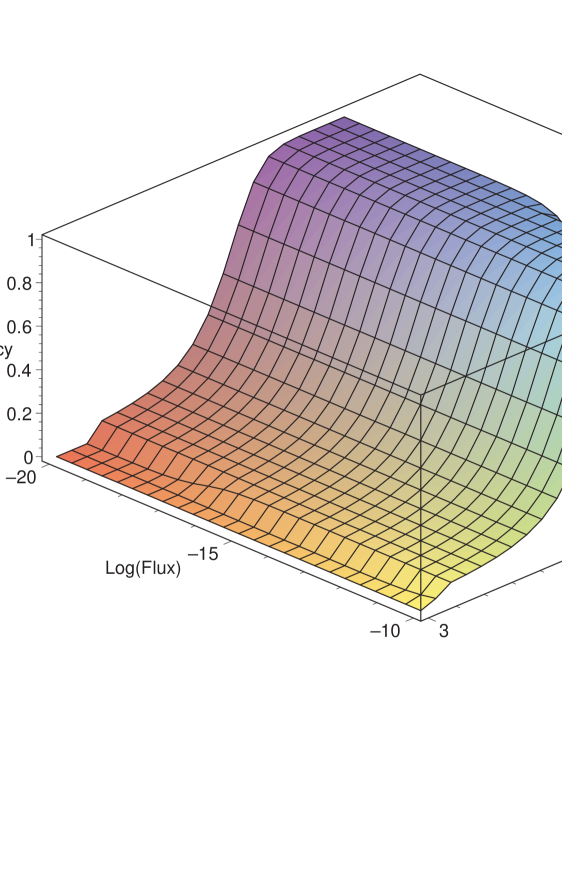
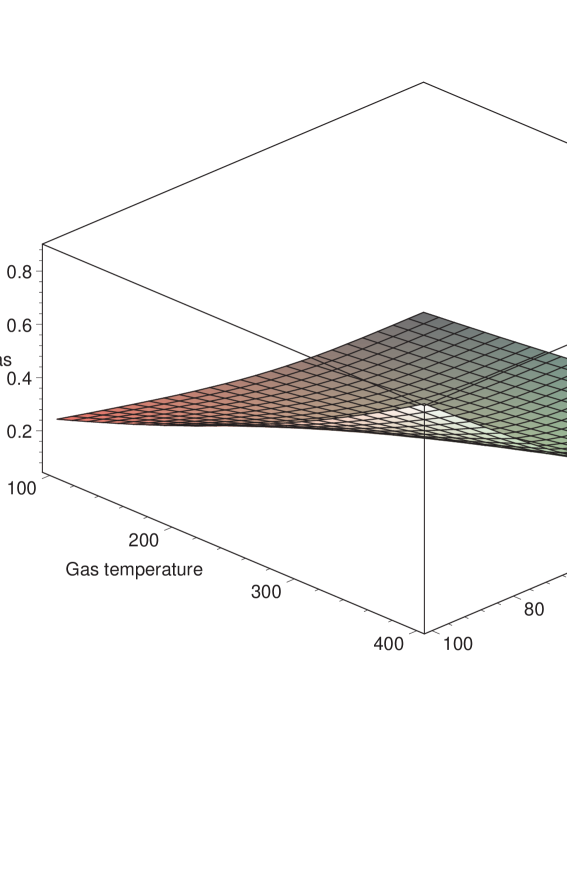
At low and high dust temperatures, variations in the flux affect the H2 formation efficiency. At low dust temperatures, this can be explained by the Langmuir kinetics. If the flux is low, the atoms, after a stay in the physisorbed sites, move into the chemisorbed sites without encountering other incoming atoms from the gas phase. If the flux is large, the physisorbed atoms, before moving to the chemisorbed sites, encounter some incoming atoms from the gas phase and are both released into the gas phase again. This explains the less efficient H2 formation at high fluxes. On the contrary, at high dust temperatures, only a small fraction of the atoms coming onto the grain go to chemisorbed sites. This fraction is set by the time required to evaporate from a physisorbed site, or to move to a chemisorbed site. When the flux increases, the number of chemisorbed H atoms just increases too, and the H2 formation is more efficient since the grain surface is occupied by more H atoms. This impact of the flux on the H2 formation efficiency is presented Fig. 2.
Another parameter which affects the H2 formation at low dust temperatures is the H2 desorption energy. H2 can form and stay on the surface of the grain until a temperature is reached that allows evaporation of these molecules. This desorption process is driven by the desorption energy of H2, , and consequently this parameter has a big impact on the H2 formation efficiency, as presented in fig 3, left panel.
At higher dust temperatures, the desorption energy of physisorbed atoms, as well as the energy of the saddle point, affect the H2 formation process. Indeed, the only obstacle to form H2 at higher dust temperatures, is the evaporation of the physisorbed H atoms before association. At these dust temperatures the physical process to form H2 is the encounter of a physisorbed H and a chemisorbed H atom. This means that the incoming H atom, which is physisorbed, has to cross the barrier presented in Fig. 1, and hence the energies and have a big impact on the H2 formation efficiency, as shown in Fig. 3, right panel and Fig. 4, left panel.
Finally, when the dust temperature is too high to enable the physisorbed atoms to recombine before they evaporate, the H2 formation process reduces to the association of two chemisorbed H atoms. Of course, this process depends on the desorption energy of the chemisorbed atoms, as illustrated in Fig. 4, right panel. When the dust temperature is high enough to enable chemisorbed H evaporation, these atoms leave the grain before recombining, and H2 formation is quenched.
Olivine versus Carbon
The composition of dust in the diffuse interstellar medium is still uncertain. According to observations, this composition includes silicates, amorphous carbon, polycyclic aromatic hydrocarbons (PAHs), graphite organic refractories, and many more (Mathis, Rumpl, & Nordsieck 1977). Most models combine all these elements to obtain the interstellar extinction curve and to compare it with observations. Weingartner & Draine (2001) and Li & Draine (2001, 2002) have developed a carbonaceous-silicate grain model which successfully reproduces observed interstellar extinction, scattering and infrared emission. This model consists of a mixture of carbonaceous and silicate grains with a grain size distribution chosen to reproduce the extinction curves obtained by observing the Milky Way, the Large Magellanic Cloud (LMC) and the Small Magellanic Cloud. This model requires the presence of very small carbonaceous grains, and appears to be a viable explanation for the observations. Therefore, we calculate H2 formation only on carbon and silicate grains. The surface characteristics of these two grains have been discussed in Cazaux & Tielens (2004). The experiments done by Pirronello et al. (1997a, 1997b and 1999) and Katz et al. (1999) have benchmarked the model that we are using here (Cazaux & Tielens 2004), and the derived parameters are reported in table 1. The H2 formation efficiency on olivine and carbonaceous grains as functions of the flux and the temperature is presented in Fig. 5 and 6.
The H2 formation rate
In astrophysical environments, the formation rate can be written as
| (2) |
where and are the number density and the thermal velocity of atoms in the gas phase, is the total cross section of interstellar grains, is the formation efficiency that is discussed in detail in (Cazaux & Tielens 2004) and is the sticking coefficient of the H atoms which depends both on the dust and the gas temperature. is given by (Hollenbach and McKee 1979)
| (3) |
where is of the order of cm s-1. We consider typical grains with a radius of 0.1 m and a material density of 3 g cm-3 (Hollenbach and McKee 1979). Therefore, the typical mass of a dust grain is about g. We can write , where is the dust to gas mass ratio, which is equal to 0.01 under Galactic conditions, and is the density of hydrogen in all forms. The formation rate can be written as
| (4) |
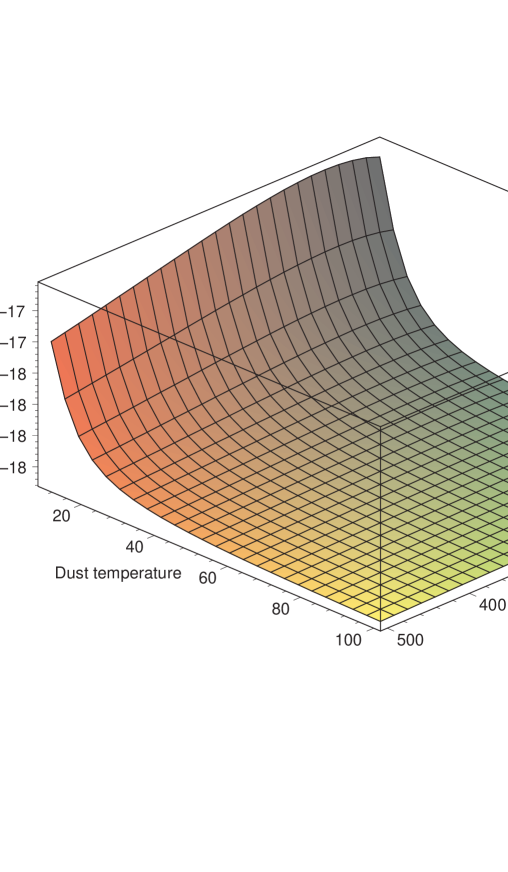
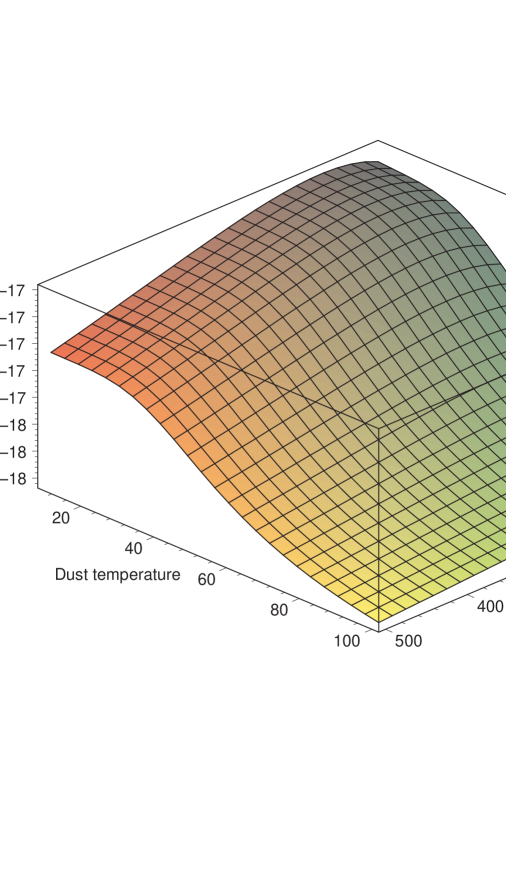
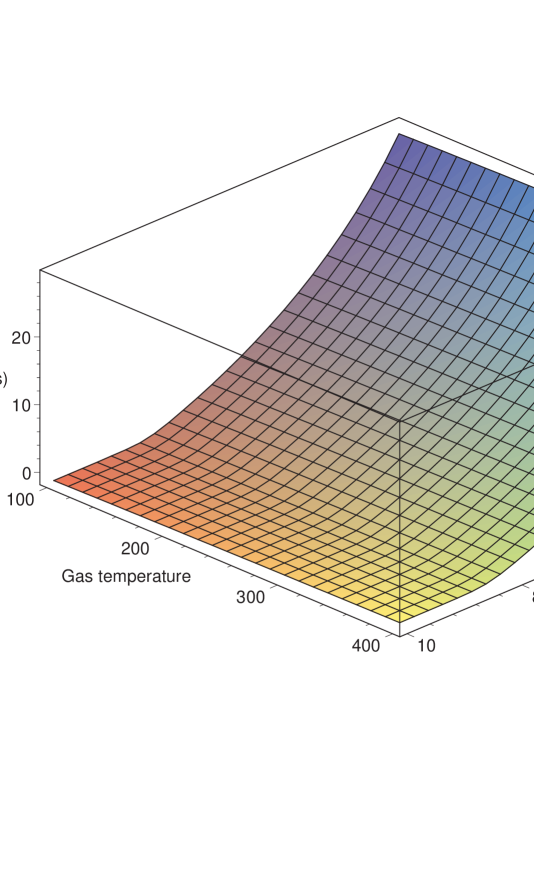
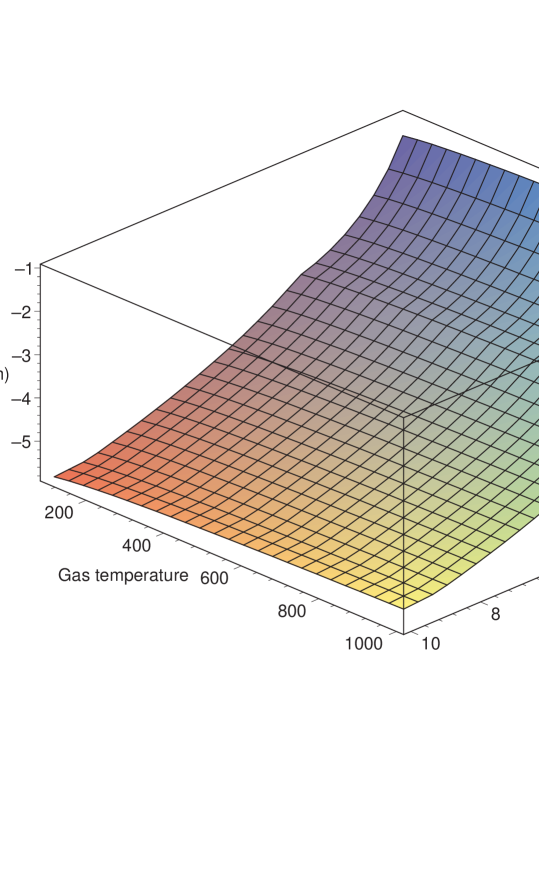
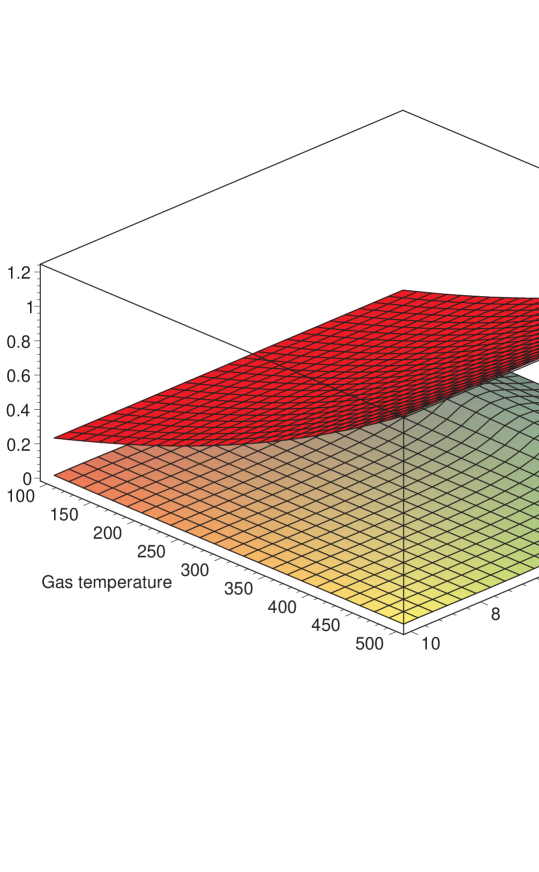
as previously calculated by Tielens & Hollenbach (1985). Due to the functional dependence of on the gas and dust temperature, the choice of olivine or amorphous carbon as the substrate is of little consequence for the temperature behavior of and we take olivine as the substrate in the remainder of the paper. This choice is illustrated in Fig. 7 and 8, where is plotted as a function of and for a hydrogen density 1 cm-3 and . For the gas and dust temperatures of interest in this work, the substrates give similar behaviors for within a factor of two.
2.2 The H- Route
In the absence of dust particles, H2 can be formed through gas phase reactions. This gas phase route is driven by the association of H atoms with H- ions,
| (5) |
and has a rate coefficient that is approximately constant with temperature below 300 K, with cm3 s-1, and equals T-0.17cm3 s-1 above 300 K (Glover 2003; Launay, Le Dourneuf & Zeippen 1991). The equilibrium H- density is determined by the relation (Donahue & Shull 1991; De Jong 1972)
| (6) |
where and k1 is the formation rate of H- via electron attachment, , with . We consider three main processes responsible for the disappearance of H-. First, associative detachment, , that we consider to be the most important gas phase route to form H2, with a rate coefficient (as discussed above). Second, photo-detachment, with a rate coefficient, as discussed by Glover (2003) and De Jong (1972), given by , where is the photo-detachment cross section of H-, Jν is the intensity of the radiation field, and is the energy for the photo-detachment of . Third, mutual neutralization, with a rate coefficient cm3 s-1. Because we are interested mostly in denser environments (like Milky Way diffuse, translucent and dense clouds), where most of the mass is located in clouds with densities of at least n 102cm-3 that are exposed to modest radiation fields (little star formation), the disappearance of H- is mainly due to the reaction with H to form H2. Hence, one can neglect the destruction of H- by radiation or through reaction with H+ (Donahue & Shull 1991). If we consider gas associated with HII regions that are embedded in galaxies, the disappearance of H- is due to the strong radiation of the nearby stars. This process is important for low ( cm-3) density gas in the local Universe (z1) where the star formation rate is higher and the mean density is lower, but becomes small compared to reactions with H for gas of higher density at redshifts larger than 2. Therefore, in the regions that we are interested in, we can write the equilibrium H- density as
| (7) |
and we write the H2 formation rate through the H- route as
| (8) |
with , the electron abundance given by . Note that in the numerical computations of the cosmological model described below all destruction routes have been included.
3 H2 Formation at High Redshift
3.1 A Comparison Between the H- and Dust Grain Routes to H2 Formation
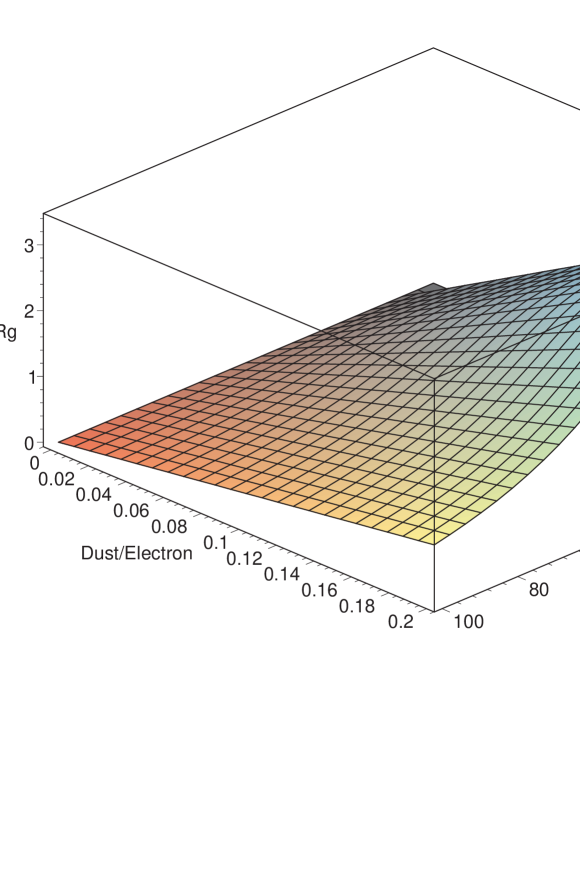
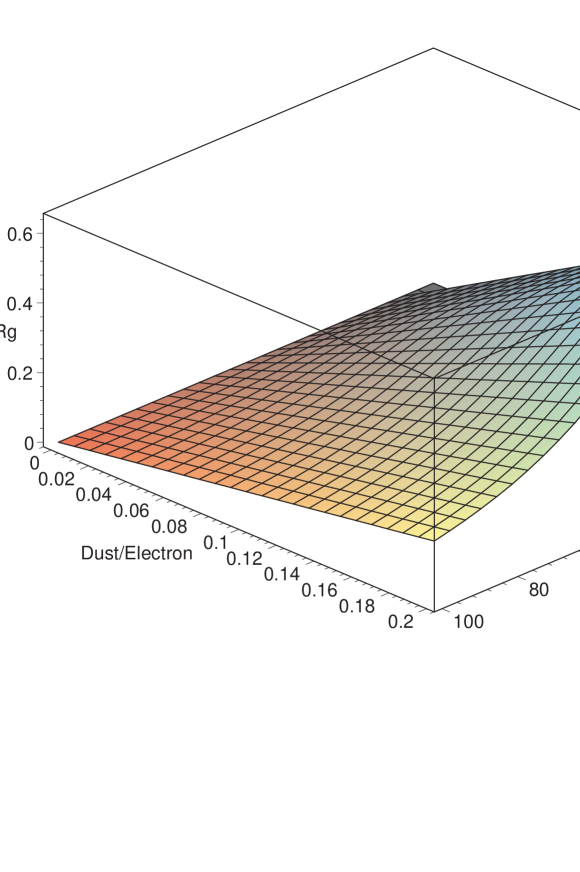
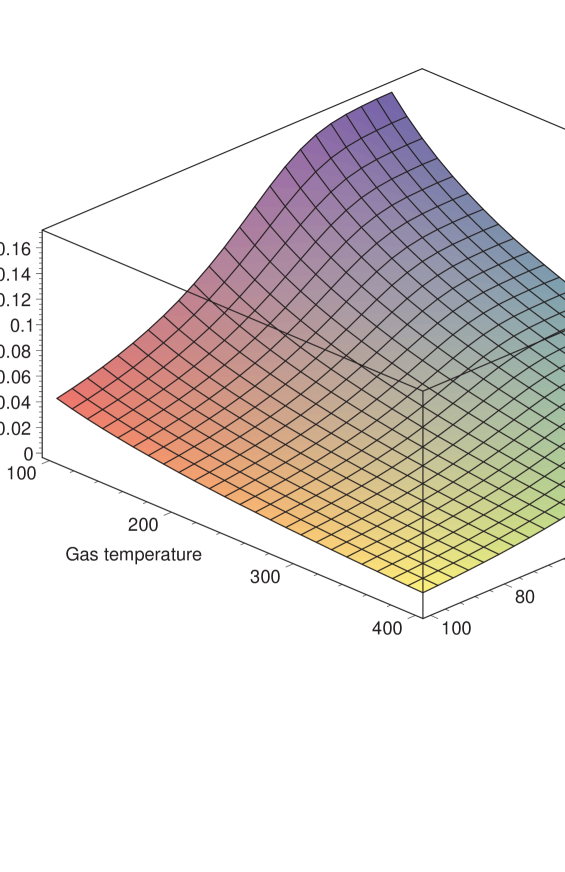
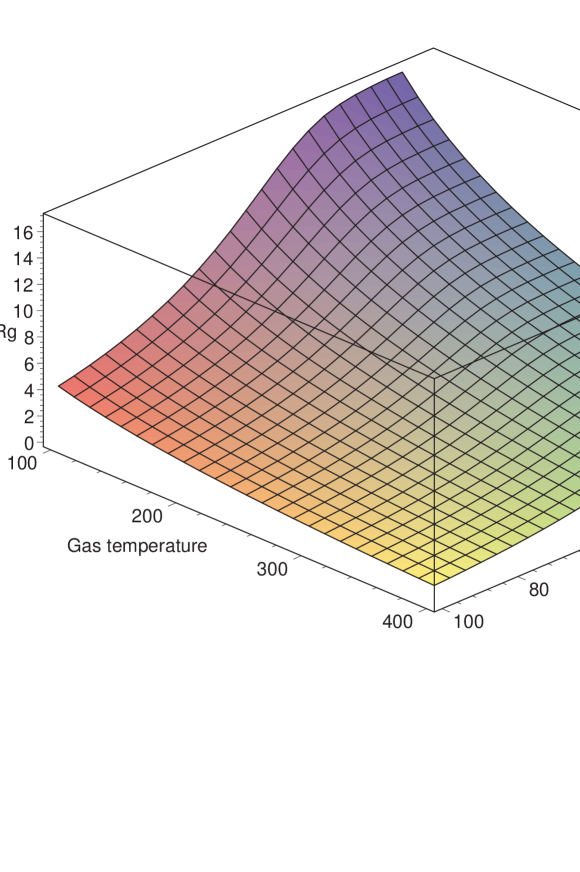
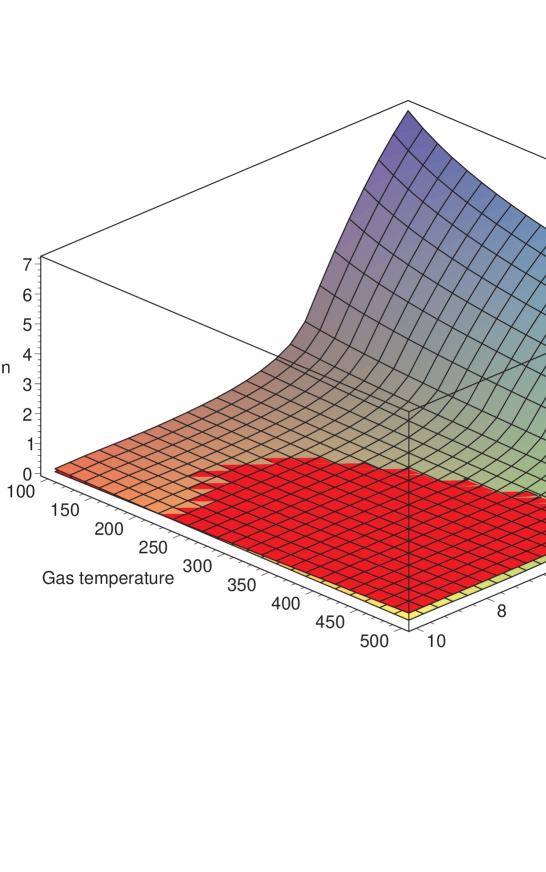
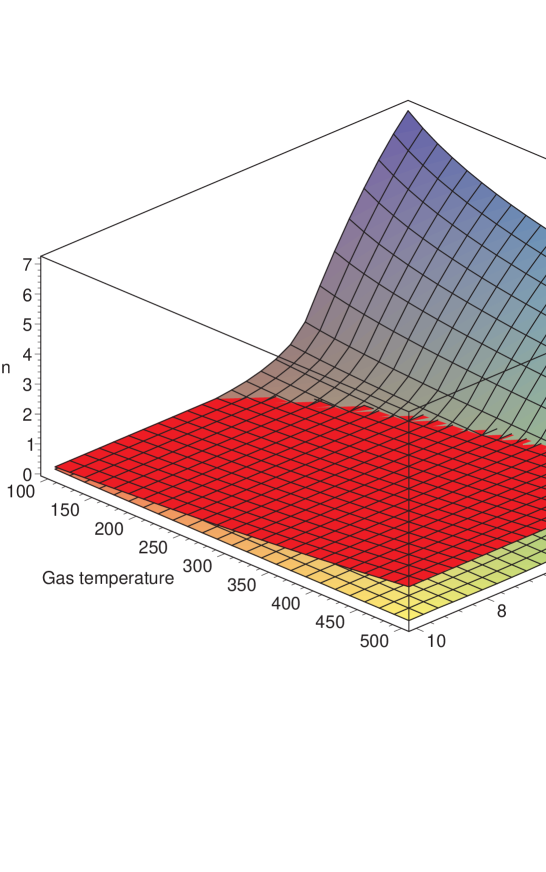
We first compare the micro-physics of H2 formation on dust grains and in the gas phase by treating the most influential variables as completely free. Our motivation is the substantial uncertainty that still exists regarding the dust and gas temperature of primordial gas as well as the free electron abundance and FUV radiation field at high redshift. The general results of this section can be incorporated by the reader into any cosmological model. We compute the ratio of H2 formation through the dust and gas routes as
| (9) |
Figs. 9, 10 and 11 and 12 show the ratio as functions of , , and . We find that the dust to electron ratio is the dominant parameter for the behavior of the ratio . In Figs. 14 and 13 we present the surface =1 as a function of the 3 free parameters. These two figures show for which conditions the gas phase route and the dust grain route to H2 formation are equal. At low dust grain temperatures, as shown by Fig. 13, the required ratio varies considerably. This is easily explained by the fact that at these temperatures, H2 once formed, mostly stays on dust grains (the temperature of the grain is then too low to enable evaporation). Therefore, for these considered temperatures, H2 formation through the dust route is extremely small, and the physical conditions to obtain the equality through the two different routes give a extremely high ratio . This range of temperatures is quite small (between 0 and 10K). Because we know that the grain temperature is typically larger than 10 K, we consider a range of temperatures between 10 and 100 K for the dust grains. For this considered range, as shown in Fig. 14, the ratio required for =1, varies slightly with the dust and the gas temperature. In conclusion, H2 formation through the H- route is equal to H2 formation through the dust route if the ratio lies between 0.1 and 0.8.
3.2 Cosmological Evolution of Physical Quantities
3.2.1 Model
In order to make a cosmological assessment of the relative importance of the dust grain and H- route contributions to the total H2 formation rate, we adopt a cosmological model for the density, dust abundance, electron abundance and radiation field strength as a function of redshift. Our microscopic model shows that the equivalence of the dust grain and H- route to form H2 occurs for a dust to electron ratio between 0.1 and 0.8. Therefore, in this section, we construct a cosmological model to estimate at which redshift this equivalence occurs, if at all. Like in Norman & Spaans (1997) and Hirashita, Hunt, & Ferrara (2002), we consider a disk galaxy with a radius and a scale height . The radial size of the galaxy, , formed at a certain redshift is given by kpc, where is the baryonic mass fraction in the protogalactic disk, following the treatment of Kauffmann (1996) for a biasing parameter of . The height to disk size ratio, = H/R, as discussed by Norman & Spaans (1997), is of the order of 0.01-0.03, although this value is uncertain and can be as high as 0.1 (Hirashita, Hunt, & Ferrara 2002). We wish to emphasize that the model galaxy constructed here is intended to represent a dwarf or sub- disk galaxy, typical of the bulk of all disk galaxies, that starts to form stars at a redshift of a few and continues to do so at a relatively vigorous pace (much like the Milky Way and the LMC). We would like to draw attention to the work of Glover (2003) that investigates as well the effects of metallicity on the relative contributions of the gas phase and dust grain formation routes of H2 formation. Our work aims to explore the cosmological dependence of the H2 formation rate, the metallicity and the star formation rate (SFR) for a fiducial galaxy, rather than a range of different environments, as in Glover (2003). Also, we point out that our treatment of H2 formation on dust grains follows the semi-classical approach of cazaux & Tielens (2004) which takes into account the characteristics of the grain surfaces that are essential to understand the association of H atoms on a grain, as well as the mobility of the different atoms under the tunneling effect and thermal hopping.
Electron Density
The adopted electron fraction, , in the optically thick limit, is described by Kitayama & Ikeuchi (2000) for the equilibrium between atomic H formation and ionization:
| (10) |
where is the photoionization coefficient of the H atoms, is the hydrogen recombination rate to the ground level (Spitzer 1978) written as =2.50. We consider the radiation field to be a combination of a background UV radiation field, an internally generated UV radiation field and cosmic rays.
| (11) |
In our model, we consider the gas to be optically thick around 1000 Å, and the spectral index of the radiation field to be , which is typical for a radiation field produced by massive stars. Note that a spectral index of would be appropriate for a radiation field produced by quasars. In our model we consider only the contribution made by massive stars. Therefore, the hydrogen ionization rate, as discussed in Kitayama & Ikeuchi (2000), can be written as
| (12) |
where is the optical depth perpendicular to the disk, given by with N⟂ the hydrogen column density perpendicular to the disk. I21 is the UV background intensity, in units of 10-21 ergs s-1 cm-2 str-1 Hz-1, which depends on the redshift, and can be written (Kitayama & Ikeuchi 2000) as
| (13) |
| (14) |
| (15) |
The internal UV radiation field, as discussed by Norman & Spaans (1997), results from stellar emission and thus depends on the star formation rate. Therefore, we can use equation (12) to obtain
| (16) |
where has the same units as and is directly proportional to the star formation rate (SFR), and with N∥ the hydrogen column density along the radius of the disk, where the disk is assumed to be exponential. We compute the SFR in our model using Hirashita & Ferrara (2002) at high redshift z5, and we match it onto the Madau plot for z5. At low redshift, we assume the SFR to be constant with a value comparable to the Galactic value of yr-1. For redshifts between 3 and 9, we parameterize the SFR as , with and determined by the limit conditions at and . At high redshift, from 9 to 20, we assume the SFR to be constant with a value of 0.003 M⊙ yr-1. Hence,
| (17) |
| (18) |
| (19) |
The above is a purely pragmatic approach whose only purpose is to define a reasonable star formation history for a model disk galaxy. This parameterization is not intended as an attempt to explain the Madau plot.
For the hydrogen column densities parallel and perpendicular to the disk, we consider in our calculations a disk with a radius and an height as given above, and with a height to disk size ratio . Therefore, the hydrogen column densities are written as
| (20) |
| (21) |
where the mean density of a collapsed object, , evolves with redshift as . Note that the density structure of the ISM under the influence of metallicity-induced phase transitions causes clouds to form with a density of cm-3, while the intercloud medium is typically at a density of cm-3, for a fiducial graviational pressure of K cm-3 at (Norman & Spaans 1997).
We adopt a mean distance between the, smoothly distributed, stellar sources and the bulk of hydrogen gas equal to , typical for a system where most of the baryonic mass and light are concentrated within . However, the obvious inhomogeneity of any galactic ISM allows radiation to penetrate much deeper into gaseous regions. This effect is incorporated in an approximate fashion by scaling the attenuating column with a redshift independent factor (Haiman & Spaans 1999; Wood & Loeb 2000).
Finally, the photo-ionization of H atoms due to cosmic rays can be scaled with the SFR as
| (22) |
where the Galactic cosmic ray ionization rate is used for the prefactor (Spitzer 1978) and the Milky Way is assumed to form stars at a rate of 3 /yr. This contribution is important in regions where the HI column is so large that UV photons can no longer penetrate.
Dust Abundance
We can compute the dust-to-gas mass ratio, following Norman & Spaans (1997) from:
| (23) |
where is the fraction of metals locked into grains, is the yield of metals like C and O (Woosley & Weaver 1995), is the fraction of stars formed that will become supernovae (Yepes et al. 1997). Note that these parameters are likely to depend on redshift (Schneider et al. 2002). However, in this investigation we use the Madau plot as a constraint to bootstrap the metallicity budget. The combination of the above values and our star formation history satisfies the observed cosmological metal production rate. The value of remains uncertain and assumes that Galactic dust coagulation is applicable at higher redshifts as well. The weak dependence on dust surface composition that we find makes us insensitive to elemental composition effects. Finally, km/s/Mpc is the Hubble constant and is the gas mass of the galaxy at redshift 0, typical of a galaxy that has converted a substantial fraction of its original gas mass into stars, but still contains a large reservoir of gas as well (like the Milky Way and the LMC). For these numbers, our model galaxy contains about an order of magnitude more mass in the form of stars as it does in the form of atomic hydrogen at (Zwaan et al. 1997). Finally, the integral in the equation above is the contribution to the metallicity of the gas by stars that have ended their evolution at a redshift larger than .
3.2.2 Results
In our study, we consider two different environments that represent different phases of the ISM. In the subsection “global effects”, we concentrate on clouds in the high density phase with nH100 cm-3 at , and that are the likely sites of star formation. In the subsection “proximity effects”, we concentrate on low density gas in the vicinity of an HII region with nH1 cm-3 at . The usual redshift scaling for the density applies (Norman & Spaans 1997).
Global Effects
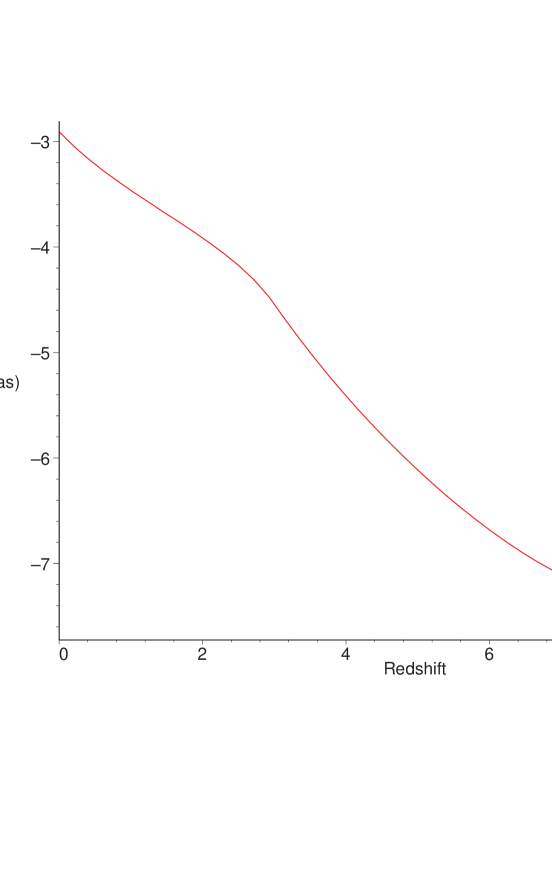
In Fig. 15, the electron fraction is presented as a function of the gas temperature and the redshift. We note the strong dependence of the electron fraction on redshift and the weak dependence it has on the gas temperature . The decreasing electron fraction with increasing redshift is easily explained by the fact that and . The resulting value of at is consistent with the electron abundance of the Milky Way and the LMC in the diffuse/ionized ISM.
In Fig. 16 the dust abundance, relative to the Galactic value , is presented. The slope of this curve follows our adopted star formation law. At a redshift of zero the dust abundance is comparable to that of the LMC. We feel that such a limiting value for is a sensible one to use for the bulk of the baryonic matter residing in dwarf and sub-L∗ galaxies.
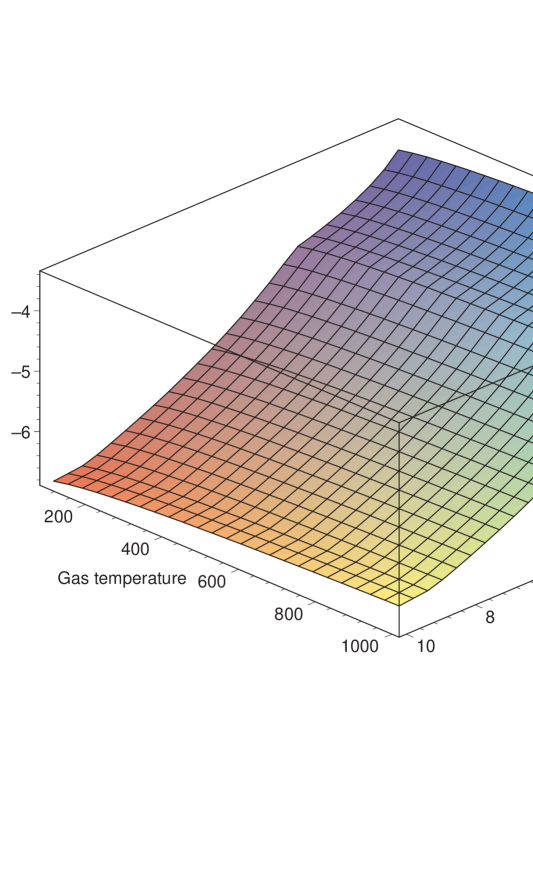
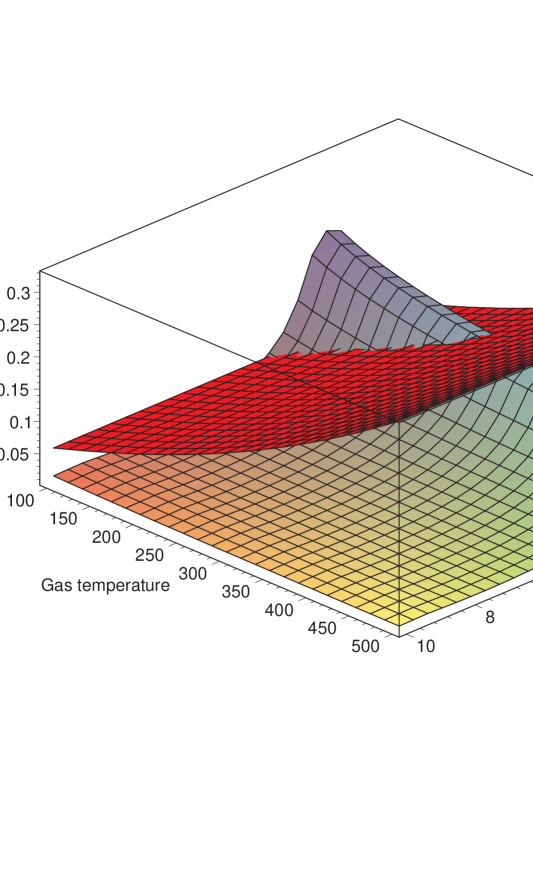
The ratio of the dust abundance over the electron fraction is calculated with our cosmological model and is presented in Figs. 17 and 18 . In these two figures we overplotted our microscopic model in order to determine under which conditions the dust or the H- route dominates. The flat surface (which is independent of redshift) represents the dust to electron ratio for which the dust route contribution to the H2 formation rate is equal to that of the H- route according to our microscopic model. The other surface represents the cosmological model. The section of the cosmological surface above the plane surface determines the cosmological parameters for which the dust route dominates. Conversely, the section of the cosmological surface below the plane surface shows the cosmological parameters for which the H- route dominates. For low dust temperatures (around 20 K) the dust route is the dominant process at low redshifts until a redshift of 4, for a gas temperature of 500 K, and dominates over the entire redshift range considered (z=10-0), for a gas temperature of 100 K. Note that at z=10, Tdust=TCMB=30K. For larger dust temperatures (around 100 K), the dust route dominates from redshift 0 until 6, for a gas temperature of 100 K. For higher gas temperatures (500K ), the dust route dominates from redshift 0 until 3.
Proximity Effects
For comparison, we have computed as well a cosmological model with a density of 1 cm-3 and an optical depth parameter of at , typical of gas that is exposed to UV photons that have escaped from nearby HII regions. This region is also assumed to be embedded in a primordial galaxy whose metallicity and dust abundance evolves as described in the previous sections. The dust abundance remains the same than the one calculated for a cloud in a galaxy (see fig. 16). The electron fraction is higher now since the density and the optical depth parameters are lower which allows much more radiation to penetrate and to ionize the medium. In Fig. 19, the electron fraction in this region is presented as a function of the gas temperature and the redshift. The photo-destruction of H- is important here and has been included.
It is apparent from Figure 20 and 21 that the gas phase formation route now dominates over the dust surface for most temperatures. This is caused by the increased electron abundance and the modest amounts of dust at high redshifts. Still, the bulk of the gas is generally shielded well and experiences conditions as described in the ”global effects” subsection. Hence, proximity effects do not affect the general trends that we observe.
4 Conclusions and Discussion
We have studied the formation of H2 on dust grain surfaces at high redshift and we have related our results to the contribution made by gas phase reactions, i.e., through the H- route. We have found that the substrate (olivine or amorphous carbon) has a modest impact on the resulting H2 formation rate. The formation efficiency depends strongly on the dust temperature below 10 K and above few hundred kelvins. The role of the gas temperature is more limited, but suppresses the H2 formation rate above several hundred K due to a reduced sticking coefficient. We wish to stress that the microphysical results on the formation efficiency and the H2 formation rate on dust grains are robust and independent of any galactic context.
We adopted a cosmological model to determine at which cosmological parameters the dust and gas phase contributions to the H2 formation rate are equal, and thus when, in the universe’s history, the dust grain route becomes the dominant H2 formation process. That is, when the presence of dust, a result of star formation, leads to an enhancement of the H2 formation rate, which in turn can boost the H2 abundance (depending on the internal FUV radiation field that can dissociate H2) and hence the ambient cooling rate by driving a rapid ion-molecule chemistry that leads to the formation of species like CO (an excellent low-temperature coolant). Such a cycle constitutes a positive feedback loop (Hirashita, Hunt, & Ferrara 2002) and can enhance the star formation rate inside a galaxy.
Our results show that, within the uncertainties of our cosmological model for the evolution of disk galaxies, the conditions for this positive feedback can occur at a redshift above 3 which corresponds to a dust-to-gas mass ratio less than 10-3 times the Galactic value. This redshift range is large and depends strongly on the dust grain and gas temperatures (microphysics) that we adopted as well as on the star formation rate (macrophysics) that we used. Indeed, for high dust/gas grain temperatures, the atoms desorb/bounce from/off the grain surface which decreases the H2 formation rate. On the other hand, a high gas temperature favors gas phase formation of H2. This clearly shows the importance of both dust and gas temperature to determine which of these two routes dominates. At very high redshift, , the temperature of the dust is coupled to the temperature of the CMB, which increases like . The dust grains are then too warm to allow an important dust route contribution. So even if dust would be present at these redshifts, it would not boost the H2 formation rate until the universe had cooled down considerably through cosmological expansion.
In fact, once the presence of dust boosts the H2 formation rate, and hence the star formation rate through the enhanced cooling rate, for redshift higher than , the production of stellar photons will raise the mean dust (and gas) temperature. This constitutes a minor effect when the shielding dust columns are large and the McKee criterium is satisfied (McKee 1989), but might be quite important in the first, metal-poor stages of star formation. In any case, the magnitude of the positive feedback that the presence of dust has on the H2 formation rate requires a careful treatment of the impact that (enhanced) star formation activity has on the dust (and gas) thermal equilibrium. We postpone these matters to a future paper.
Finally, recent observations of distant quasars (Bertoldi et al. 2003) at redshifts around z6 showed that these objects possess a metallicity close to solar. These quasars represent large over-densities in the Universe and our study concentrates on the evolution of a typical sub-L* galaxy, that we assume to be more representative of the average galaxy population. In any case, these distant quasars, rich in metals, possess both a high dust grain abundance and the physical conditions to allow efficient H2 formation on dust surfaces.
We would like to thank the anonymous referee for his careful reading of the manuscript and his comments that helped to improve this work.
References
- Aronowitz & Chang (1980) Aronowitz, S. & Chang, S. 1980, ApJ, 242, 149
- Barlow & Silk (1976) Barlow, M. J. & Silk, J. 1976, ApJ, 207, 131
- Bertoldi et al. (2003) Bertoldi, F., Carilli, C. L., Cox, P., Fan, X., Strauss, M. A., Beelen, A., Omont, A., & Zylka, R. 2003, A&A, 406, L55
- Cazaux & Tielens (2004) Cazaux, S. & Tielens, A. G. G. M. 2004, ApJ, in press.
- Cazaux & Tielens (2002) Cazaux, S. & Tielens, A. G. G. M. 2002, ApJ, 575, L29
- de Jong (1972) de Jong, T. 1972, A&A, 20, 263
- Donahue & Shull (1991) Donahue, M. & Shull, J. M. 1991, ApJ, 383, 511
- Fromherz, Mendoza, & Ruette (1993) Fromherz, T., Mendoza, C., & Ruette, F. 1993, MNRAS, 263, 851
- Galli & Palla (1998) Galli, D. & Palla, F. 1998, A&A, 335, 403
- Glover (2003) Glover, S. C. O. 2003, ApJ, 584, 331
- Gould & Salpeter (1963) Gould, R. J. & Salpeter, E. E. 1963, ApJ, 138, 393
- (12) Haiman, Z. & Spaans, M., 1999, ApJ, 518, 138
- Haiman, Abel, & Rees (2000) Haiman, Z.; Abel, T., & Rees, M. J. 2000, ApJ, 534, 11
- Haiman, Rees, & Loeb (1996) Haiman, Z., Rees, M. J., & Loeb, A. 1996, ApJ, 467, 522
- Haiman, Thoul, & Loeb (1996) Haiman, Z., Thoul, A. A., & Loeb, A. 1996, ApJ, 464, 523
- Hirashita & Ferrara (2002) Hirashita, H. & Ferrara, A. 2002, MNRAS, 337, 921
- Hirashita, Hunt, & Ferrara (2002) Hirashita, H., Hunt, L. K., & Ferrara, A. 2002, MNRAS, 330, L19
- Hollenbach & McKee (1979) Hollenbach, D. & McKee, C. F. 1979, ApJS, 41, 555
- Katz et al. (1999) Katz, N., Furman, I., Biham, O., Pirronello, V. & Vidali, G. 1999, ApJ, 522, 305
- Kauffmann & Charlot (1998) Kauffmann, G. & Charlot, S. 1998, MNRAS, 294, 705
- Kauffmann (1996) Kauffmann, G. 1996, MNRAS, 281, 475
- Kitayama & Ikeuchi (2000) Kitayama, T. & Ikeuchi, S. 2000, ApJ, 529, 615
- Klose (1992) Klose, S. 1992, A&A, 260, 321.
- Launay, Le Dourneuf, & Zeippen (1991) Launay, J. M., Le Dourneuf, M., & Zeippen, C. J. 1991, A&A, 252, 842
- Leitch-Devlin & Williams (1984) Leitch-Devlin, M. A. & Williams, D. A. 1984, MNRAS, 210, 577
- Li & Draine (2002) Li, A. & Draine, B. T. 2002, ApJ, 564, 803
- Li & Draine (2001) Li, A. & Draine, B. T. 2001, ApJ, 550, L213
- Lilly, Le Fevre, Hammer, & Crampton (1996) Lilly, S. J., Le Fevre, O., Hammer, F., & Crampton, D. 1996, ApJ, 460, L1
- Madau et al. (1996) Madau, P., Ferguson, H. C., Dickinson, M. E., Giavalisco, M., Steidel, C. C., & Fruchter, A. 1996, MNRAS, 283, 1388
- Mathis, Rumpl, & Nordsieck (1977) Mathis, J. S., Rumpl, W., & Nordsieck, K. H. 1977, ApJ, 217, 425
- McKee (1989) McKee, C. F. 1989, ApJ, 345, 782
- Nakamura & Umemura (2002) Nakamura, F. & Umemura, M. 2002, ApJ, 569, 549
- Norman & Spaans (1997) Norman, C. A. & Spaans, M. 1997, ApJ, 480, 145
- Pirronello, Liu, Roser & Vidali (1999) Pirronello, V., Liu, C., Roser, J. E. & Vidali, G. 1999, A&A, 344, 681
- Pirronello et al. (1997) Pirronello, V., Biham, O., Liu, C., Shen, L. & Vidali, G. 1997, ApJ, 483, L131
- Pirronello, Liu, Shen & Vidali (1997) Pirronello, V., Liu, C., Shen, L. & Vidali, G. 1997, ApJ, 475, L69 Schmeltekopf, A. L., Fehsenfeld, F. C., & Ferguson, E. E. 1967, ApJ, 148, L155
- (37) Schneider, R., Ferrara, A., Natarajan, P., & Omukai, K. 2002, ApJ, 571, 30
- Somerville, Primack, & Faber (2001) Somerville, R. S., Primack, J. R., & Faber, S. M. 2001, MNRAS, 320, 504
- Spaans & Norman (1997) Spaans, M. & Norman, C. A. 1997, ApJ, 483, 87
- Spitzer (1978) Spitzer, L. 1978, New York Wiley-Interscience, 1978. 333 p.,
- Tegmark et al. (1997) Tegmark, M., Silk, J., Rees, M. J., Blanchard, A., Abel, T., & Palla, F. 1997, ApJ, 474, 1
- Tielens & Allamandola (1987) Tielens, A. G. G. M. & Allamandola, L. J. 1987, ASSL Vol. 134: Interstellar Processes, 397.
- Tielens & Hollenbach (1985) Tielens, A. G. G. M. & Hollenbach, D. 1985, ApJ, 291, 722
- Weingartner & Draine (2001) Weingartner, J. C. & Draine, B. T. 2001, ApJ, 548, 296
- (45) Wood, K. & Loeb, A., 2000, ApJ, 545, 86
- Woosley & Weaver (1995) Woosley, S. E. & Weaver, T. A. 1995, ApJS, 101, 181
- Yepes, Kates, Khokhlov, & Klypin (1997) Yepes, G., Kates, R., Khokhlov, A., & Klypin, A. 1997, MNRAS, 284, 235
- Zwaan, Briggs, Sprayberry, & Sorar (1997) Zwaan, M. A., Briggs, F. H., Sprayberry, D., & Sorar, E. 1997, ApJ, 490, 173
| Surface | aaFor more details about the determination and calculation of these parameters, see Cazaux & Tielens (2002). | aaFor more details about the determination and calculation of these parameters, see Cazaux & Tielens (2002). | aaFor more details about the determination and calculation of these parameters, see Cazaux & Tielens (2002). | aaFor more details about the determination and calculation of these parameters, see Cazaux & Tielens (2002). | aaFor more details about the determination and calculation of these parameters, see Cazaux & Tielens (2002). | aaFor more details about the determination and calculation of these parameters, see Cazaux & Tielens (2002). | aaFor more details about the determination and calculation of these parameters, see Cazaux & Tielens (2002). |
|---|---|---|---|---|---|---|---|
| unit | K | K | K | K | s-1 | ||
| Olivine | 340 | 0.3 | 200 | 650 | 30000 | 21012 | 11013 |
| Carbon | 540 | 0.4 | 250 | 800 | 30000 | 31012 | 21013 |