eurm10 \checkfontmsam10 \pagerange1–7
The Distribution of Mass and Light in Cluster Infall Regions
Abstract
The CAIRNS (Cluster And Infall Region Nearby Survey) project is a large spectroscopic survey of the infall regions surrounding nine nearby rich clusters of galaxies. I describe the survey and use the kinematics of galaxies in the infall regions to estimate the cluster mass profiles. At small radii, these mass profiles are consistent with independent mass estimates from X-ray observations and Jeans analysis. I demonstrate the dependence of mass-to-light ratios on environment by combining these mass profiles with Two-Micron All-Sky Survey (2MASS) photometry. Near-infrared light is more extended than mass in these clusters, suggesting that dense cluster cores are less efficient at forming galaxies and/or more efficient at disrupting them. At large radii, galaxy populations in cluster infall regions closely resemble those in the field. The mass-to-light ratio at these radii should therefore be a good probe of the global mass-to-light ratio. The mass-to-light ratio in the infall region yields a surprisingly low estimate of .
1 Introduction
The relative distribution of matter and light in the universe is one of the outstanding problems in astrophysics. Clusters of galaxies, the largest gravitationally relaxed objects in the universe, are important probes of the distribution of mass and light. [Zwicky (1933)] first computed the mass-to-light ratio of the Coma cluster using the virial theorem and found that dark matter dominates the cluster mass. Recent determinations using the virial theorem yield mass-to-light ratios of (Girardi et al. 2000 and references therein). Equating the mass-to-light ratio in clusters to the global value provides an estimate of the mass density of the universe; this estimate is subject to significant systematic error introduced by differences in galaxy populations between cluster cores and lower density regions ([Carlberg et al. 1997, Girardi et al. 2000]). Indeed, some numerical simulations suggest that cluster mass-to-light ratios exceed the universal value ([Diaferio 1999, Kravtsov & Klypin 1999, Bahcall et al. 2000]).
Determining the global matter density from cluster mass-to-light ratios therefore requires knowledge of the dependence of mass-to-light ratios on environment. Bahcall et al. (1995) show that mass-to-light ratios increase with scale from galaxies to groups to clusters. Ellipticals have larger overall values of than spirals, presumably a result of younger, bluer stellar populations in spirals. At the scale of cluster virial radii, mass-to-light ratios appear to reach a maximum value. Some estimates of the mass-to-light ratio on very large scales (10) are available ([Bahcall et al. 1995]), but the systematic uncertainties are large.
There are few estimates of mass-to-light ratios on scales between cluster virial radii and scales of 10 (Rines et al. 2000, Rines et al. 2001a, Biviano & Girardi 2003, Katgert et al. 2003, Kneib et al. 2003, Rines et al. 2004, Tully 2004 and references therein). On these scales, many galaxies near clusters are bound to the cluster but not yet in equilibrium ([Gunn & Gott 1972]). These cluster infall regions have received relatively little scrutiny because they are mildly nonlinear, making their properties very difficult to predict analytically. However, these scales are exactly the ones in which galaxy properties change dramatically (e.g., Ellingson et al. 2001, Lewis et al. 2002, Gomez et al. 2003, Treu et al. 2003, Balogh et al. 2004, Gray et al. 2004). Variations in the mass-to-light ratio with environment could have important physical implications; they could be produced either by a varying dark matter fraction or by variations in the efficiency of star formation with environment. In blue light, however, higher star formation rates in field galaxies could produce lower mass-to-light ratios outside cluster cores resulting only from the different contributions of young and old stars to the total luminosity ([Bahcall et al. 2000, Tully 2004]).
Galaxies in cluster infall regions produce sharp features in redshift surveys. Early investigations of this infall pattern focused on its use as a direct indicator of the global matter density . Unfortunately, random motions caused by galaxy-galaxy interactions and substructure within the infall region smear out this cosmological signal (Diaferio & Geller 1997, Vedel & Hartwick 1998). Instead of sharp peaks in redshift space, infall regions around real clusters typically display a well-defined envelope in redshift space which is significantly denser than the surrounding environment ([Rines et al. 2003], hereafter Paper I, and references therein).
Diaferio & Geller (1997) and Diaferio (1999) analyzed the dynamics of infall regions with numerical simulations and found that in the outskirts of clusters, random motions due to substructure and non-radial motions make a substantial contribution to the amplitude of the caustics which delineate the infall regions. Diaferio & Geller (1997) showed that the amplitude of the caustics is a measure of the escape velocity from the cluster; identification of the caustics therefore allows a determination of the mass profile of the cluster on scales .
Diaferio & Geller (1997) and Diaferio (1999) show that nonparametric measurements of caustics yield cluster mass profiles accurate to 50% on scales of up to 10 Mpc. This method assumes only that galaxies trace the velocity field. Indeed, simulations suggest that little or no velocity bias exists on linear and mildly non-linear scales ([Kauffmann et al. 1999a, Kauffmann et al. 1999b]). The caustic method has been applied to systems as large as the Shapley Supercluster ([Reisenegger et al. 2000]) and as small as the Fornax cluster ([Drinkwater et al. 2001]) as well as to many nearby clusters (Paper I). Biviano & Girardi (2003) applied the caustic technique to an ensemble cluster created by stacking redshifts around 43 clusters from the 2dF Galaxy Redshift Survey. Rines et al. (2000) found an enclosed mass-to-light ratio of within 4 of A576. Rines et al. (2001) used 2MASS photometry and the mass profile from Geller et al. (1999) to compute the mass-to-light profile of Coma in the K-band. They found a roughly flat profile with a possible decrease in with radius by no more than a factor of 3. Biviano & Girardi (2003) find a decreasing ratio of mass density to total galaxy number density. For early-type galaxies only, the number density profile is consistent with a constant mass-to-light (actually mass-to-number) ratio.
Here, we calculate the infrared mass-to-light profile within the turnaround radius for the CAIRNS clusters (Paper I), a sample of nine nearby rich, X-ray luminous clusters. We use photometry from 2MASS, the Two Micron All Sky Survey ([Skrutskie et al. 1997]) and add several new redshifts to obtain complete or nearly complete surveys of galaxies up to 1-2 magnitudes fainter than (as determined by Cole et al. 2001 and Kochanek et al. 2001). Infrared light is a better tracer of stellar mass than optical light; it is relatively insensitive to dust extinction and recent star formation. Despite these advantages, there are very few measurements of infrared mass-to-light ratios in clusters ([Tustin et al. 2001, Rines et al. 2001a, Lin et al. 2003, Rines et al. 2004]).
2 Observations
The CAIRNS clusters are 8 of the 14 Abell clusters that are: nearby (), Abell richness class , X-ray luminous (erg s-1) galaxy clusters with declination . Between 1997 and 2003, we collected 5607 redshifts (both new and remeasured) in large areas around nearby clusters with the FAST spectrograph on the FLWO 1.5-m telescope in Arizona. We targeted galaxies within a projected radius of 10 of the clusters, selecting targets first from POSSII 103aE plates and later from 2MASS when it became available. The redshift catalogs in Rines et al. (2004) complete band magnitude-limited samples extending 1-2 magnitudes fainter than the characteristic magnitude . These samples include 60-85% of the total light in the clusters and their infall regions.
3 Mass Profiles
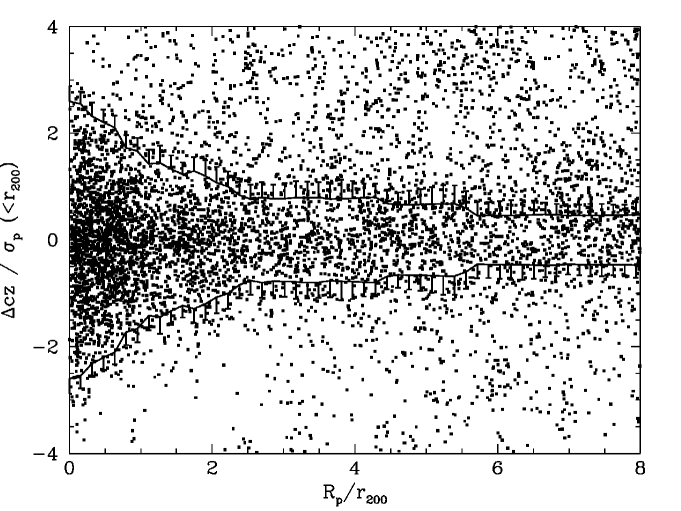
Figure 1 shows the redshifts of galaxies surrounding nearby clusters as a function of projected radius (normalized to , the radius within which the average density is 200 times the critical density). The caustic pattern (a dense envelope in phase space with well-defined edges) is evident in the combined cluster as well as in each of the 9 clusters. Using the phase space distribution of galaxies in cluster infall regions, we apply the kinematic mass estimator of D99 to these clusters. The resulting mass profiles agree well with NFW (Navarro et al. 1997) and Hernquist (1990) models, but exclude an isothermal sphere.
These mass profiles agree with X-ray masses at small radius as well as virial masses (after correction for the surface pressure term) at slightly larger radii ([Rines et al. 2002], Paper I). The latter is primarily a consistency check as the caustic technique utilizes the same kinematic data as the virial theorem. This consistency can be further demonstrated with the velocity dispersion profiles (see Paper I and Rines et al. 2004).
4 Near-Infrared Luminosity Functions
When using the mass-to-light ratio in clusters to estimate , one must determine whether the luminosity functions of field and cluster galaxies differ significantly. Given the well-known morphology-density relation, it is possible that the two LFs differ significantly. We use 2MASS photometry to determine the near-infrared luminosity functions for the CAIRNS clusters and infall regions ([Rines et al. 2004]). The cluster and infall region LFs are very similar to each other (Figure 2) and to the field LF for relatively bright galaxies (). Because of this similarity, we can correct for the luminosity in faint galaxies using the field LF. Our redshift surveys include 60–85% of the total light.


5 Near-Infrared Mass-to-Light Profiles
Both the surface number density and surface luminosity density profiles of cluster/infall region members are more extended than the mass profiles of Paper I. Figure 3 shows the mass-to-light profiles of the CAIRNS clusters. The mass-to-light profiles are either flat or show a decreasing with increasing radius. The mean mass-to-light ratio within is a factor of larger than the mean value outside .
The decreasing mass-to-light profiles could be caused by gradients in stellar populations with radius; such effects have been invoked to account for a similar result for B band mass-to-light profiles in simulations ([Bahcall et al. 2000]). In K band, however, changes in stellar populations with radius are expected to change the mean stellar mass-to-light ratio by . Thus, the CAIRNS mass-to-light profiles provide tentative evidence for variations in the efficiency of galaxy formation and/or disruption. Environments with higher virial temperatures (like cluster centers) are more efficient at disrupting galaxies and/or less efficient at forming them.
A related trend has been noted by Lin et al. (2003, 2004), who show that K-band mass-to-light ratios within increase with increasing cluster mass. This result indicates that more massive clusters (with larger virial temperatures) have less efficient galaxy formation and/or more efficient galaxy disruption. We confirm this trend in Rines et al. (2004). Because cluster infall regions should be composed of galaxies inhabiting less massive systems ([Rines et al.(2001b, Rines et al. 2002]) and/or regions with lower virial temperatures, the above trend predicts that cluster infall regions should have smaller mass-to-light ratios than virial regions, consistent with the CAIRNS results.
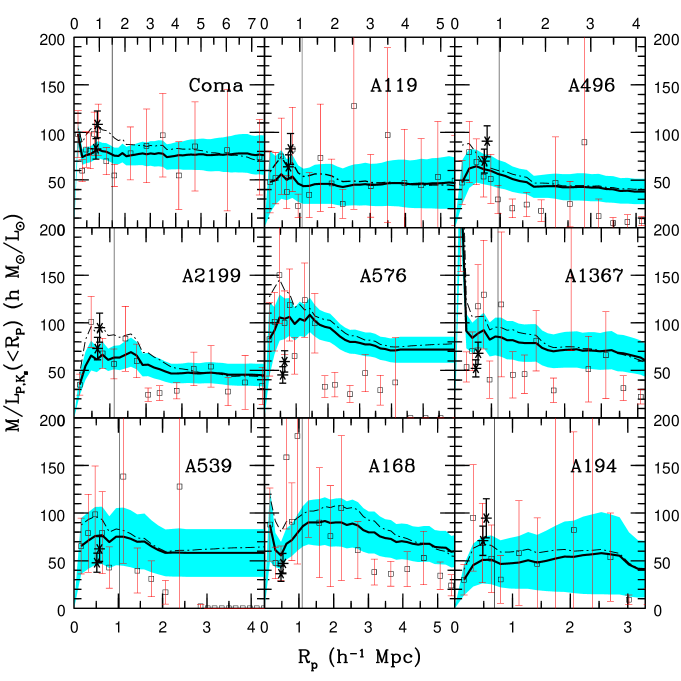
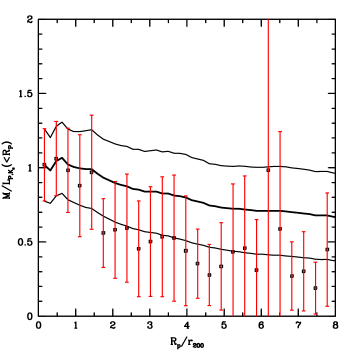
Figure 4 shows the mass-to-light profile of the combined CAIRNS cluster (normalized to unity at ). The mass-to-light profile clearly decreases with radius. The combined cluster should be less susceptible to substructure than the individual clusters. Figure 4 shows that the mass-to-light ratio in shells decreases by about a factor of 2 from the virial region to the infall region, consistent with the results for individual clusters. Taking the mass-to-light ratio in cluster infall regions as an estimate of the global value and the SDSS luminosity density extrapolated to band ([Blanton et al. 2003]), we estimate (statistical). This estimate is somewhat lower if we use the band luminosity density of either Cole et al. (2001) or Kochanek et al. (2001). We discuss potential systematic effects in Rines et al. (2004). Most of these effects would flatten the observed mass-to-light profiles relative to the true profiles, suggesting that the observed decrease in mass-to-light ratio with radius is real.
6 Conclusions
Cluster infall regions contain more galaxies than their virial regions. If currently popular cosmological models are correct, the mass in infall regions will eventually accrete onto the parent clusters, and their final masses will increase by a factor of about 2.
Near-infrared luminosity functions depend only weakly on environment, at least at the bright end. We show that near-infrared light is more extended than mass in cluster infall regions, suggesting environmental dependence of the efficiency of galaxy formation and/or disruption. If more efficient galaxy disruption is responsible, intracluster stars might be a significant component of stellar mass in clusters. The mass-to-light ratios in infall regions suggest a low . Future work is needed to determine the significance of the conflict of this result with the currently favored .
Acknowledgements.
I would like to thank Margaret Geller and Antonaldo Diaferio for their many contributions as my primary collaborators in this work. I would also like to thank Tom Jarrett, Michael Kurtz, Joe Mohr, Gary Wegner, and John Huchra for their contributions to the CAIRNS project. Perry Berlind, Mike Calkins, and Susan Tokarz collected and reduced most of the spectroscopic data. I thank the Smithsonian Institution for support.References
- [Bahcall et al. 2000] Bahcall, N. A., Cen, R., Davé, R., Ostriker, J. P., & Yu, Q. 2000, Astrop. J., 541, 1
- [Bahcall et al. 1995] Bahcall, N. A., Lubin, L. M., & Dorman, V. 1995, Astrop. J., 447, L81
- [Balogh et al. 2004] Balogh, M. et al. 2004, MNRAS, 348, 1355
- [Biviano & Girardi 2003] Biviano, A. & Girardi, M. 2003, Astrop. J., 585, 205
- [Blanton et al. 2003] Blanton, M. R. et al. 2003, Astrop. J., 592, 819
- [Carlberg et al. 1997] Carlberg, R. G., Yee, H. K. C., & Ellingson, E. 1997, Astrop. J., 478, 462
- [Cole et al. 2001] Cole, S. et al. 2001, MNRAS, 326, 255
- [Diaferio 1999] Diaferio, A. 1999, MNRAS, 309, 610
- [Diaferio & Geller 1997] Diaferio, A. & Geller, M. J. 1997, Astrop. J., 481, 633
- [Drinkwater et al. 2001] Drinkwater, M. J., Gregg, M. D., & Colless, M. 2001, Astrop. J., 548, L139
- [Ellingson et al. 2001] Ellingson, E., Lin, H., Yee, H. K. C., & Carlberg, R. G. 2001, Astrop. J., 547, 609
- [Geller et al. 1999] Geller, M. J., Diaferio, A., & Kurtz, M. J. 1999, Astrop. J., 517, L23
- [Gómez et al. 2003] Gómez, P. L. et al. 2003, Astrop. J., 584, 210
- [Girardi et al. 2000] Girardi, M., Borgani, S., Giuricin, G., Mardirossian, F., & Mezzetti, M. 2000, Astrop. J., 530, 62
- [Gray et al. 2004] Gray, M. E. and Wolf, C. and Meisenheimer, K. and Taylor, A. and Dye, S. and Borch, A. and Kleinheinrich, M. 2004, MNRAS, 347, L73
- [Gunn & Gott 1972] Gunn, J. E. & Gott, J. R. I. 1972, Astrop. J., 176, 1
- [Hernquist 1990] Hernquist, L. 1990, Astrop. J., 356, 359
- [Katgert et al. 2003] Katgert, P., Biviano, A., & Mazure, A. 2003, Astrop. J., 600, 6457
- [Kauffmann et al. 1999a] Kauffmann, G., Colberg, J. M., Diaferio, A., & White, S. D. M. 1999a, MNRAS, 303, 188
- [Kauffmann et al. 1999b] —. 1999b, MNRAS, 307, 529
- [Kneib et al. 2003] Kneib, J.-P. et al. 2003, Astrop. J., 598, 804
- [Kochanek et al. 2001] Kochanek, C. S. et al. 2001, Astrop. J., 560, 566
- [Kravtsov & Klypin 1999] Kravtsov, A. V. & Klypin, A. A. 1999, Astrop. J., 520, 437
- [Lewis et al. 2002] Lewis, I. et al. 2002, MNRAS, 334, 673
- [Lin et al. 2003] Lin, Y., Mohr, J. J., & Stanford, S. A. 2003, Astrop. J., 591, 749
- [Lin et al. 2004] Lin, Y., Mohr, J. J., & Stanford, S. A. 2004, Astrop. J., in press, astro-ph/0402308
- [Navarro et al.(1997)] Navarro, J. F., Frenk, C. S., & White, S. D. M. 1997, Astrop. J., 490, 493
- [Reisenegger et al. 2000] Reisenegger, A., Quintana, H., Carrasco, E. R., & Maze, J. 2000, Astron. J., 120, 523
- [Rines et al. 2003] Rines, K., Geller, M. J., Diaferio, A., & Kurtz, M. J. 2003, Astron. J., 126, 2152
- [Rines et al. 2002] Rines, K., Geller, M. J., Diaferio, A., Mahdavi, A., Mohr, J. J., & Wegner, G. 2002, Astron. J., 124, 1266
- [Rines et al. 2000] Rines, K., Geller, M. J., Diaferio, A., Mohr, J. J., & Wegner, G. A. 2000, Astron. J., 120, 2338
- [Rines et al. 2001a] Rines, K., Geller, M. J., Kurtz, M. J., Diaferio, A., Jarrett, T. H., & Huchra, J. P. 2001a, Astrop. J., 561, L41
- [Rines et al.(2001b] Rines, K., Mahdavi, A., Geller, M. J., Diaferio, A., Mohr, J. J., & Wegner, G. 2001b, Astrop. J., 555, 558
- [Rines et al. 2004] Rines, K. , Geller, M. J., Diaferio, A., Kurtz, M. J., & Jarrett, T. H., 2004, Astron. J., submitted (astro-ph/0402242)
- [Skrutskie et al. 1997] Skrutskie, M. F. et al. 1997, in ASSL Vol. 210: The Impact of Large Scale Near-IR Sky Surveys, 25
- [Treu et al. 2003] Treu, T., Ellis, R. S., Kneib, J., Dressler, A., Smail, I., Czoske, O., Oemler, A., & Natarajan, P. 2003, Astrop. J., 591, 53
- [Tully 2004] Tully, R. B., 2004, Astrop. J., submitted, astro-ph/0312441
- [Tustin et al. 2001] Tustin, A. W., Geller, M. J., Kenyon, S. J., & Diaferio, A. 2001, Astron. J., 122, 1289
- [Vedel & Hartwick 1998] Vedel, H. & Hartwick, F. D. A. 1998, Astrop. J., 501, 509
- [Zwicky (1933)] Zwicky, F. 1933, Helv. Phys. Acta, 6, 110