ISOPHOT 95 m observations in the Lockman Hole
We report results from a new analysis of a deep 95 m imaging survey with ISOPHOT on board the Infrared Space Observatory, over a 1 deg2 area within the Lockman Hole, which extends the statistics of our previous study (Rodighiero et al. 2003). Within the survey area we detect sixty-four sources with S/N (roughly corresponding to a flux limit of 16 mJy). Extensive simulations indicate that the sample is almost complete at mJy, while the incompleteness can be quantified down to 30 mJy. The 95 m galaxy counts reveal a steep slope at mJy (), in excess of that expected for a non-evolving source population. In agreement with counts data from ISO at 15 and 175 m, this favours a model where the IR populations evolve both in number and luminosity densities. We finally comment on some differences found with other ISO results in this area.
Key Words.:
Infrared: galaxies – Galaxies: photometry, statistics, evolution1 Introduction
The infrared sky observed from space is providing tight constraints on the evolution of cosmological source populations. The IRAS extragalactic number counts (Oliver et al. 1992, Bertin et al. 1997) showed some marginally significant excess of galaxies compared to non-evolutionary predictions. More recently, ISOPHOT (Lemke et al. 1996) found some evidence of evolution for the IR population at 170m (e.g. Puget et al. 1999, Dole et al. 2001), but source confusion at these wavelengths limits the observations to moderately faint fluxes ( mJy). At shorter wavelengths, ISOCAM (Cesarsky et al. 1996) detected a number of faint sources consistent with strong evolution in the mid-IR (e.g. Elbaz et al. 1999), a factor 10 in excess with respect to non-evolution predictions.
The ISO deep counts, together with those in the submillimeter (e.g. Scott et al. 2002) are used as constraints on models of galaxy formation and evolution (e.g. Lacey et al. 1994, Franceschini et al. 2001, Lagache et al. 2003). These studies are also needed to estimate the confusion noise for future IR and submillimeter telescopes (Xu et al. 2001, Lagache et al. 2003).
In this paper we present a new analysis of ISOPHOT 95 m data in the direction of the Lockman Hole, extending our previous study (Rodighiero et al. 2003, hereafter Paper I) and significantly improving the source statistics.
The Spitzer Space Observatory (Fazio et al., 1999) will soon observe the same region of the Lockman Hole in complementary wavebands at 24, 70 and 160 m with MIPS and in the near-IR with IRAC. This will provide additional extensive information on the Spectral Energy Distributions (SEDs) of ISO sources.
The paper is organized as follows: in Section 2 we introduce the dataset and in Section 3 we summarize features of the adopted reduction procedure. The infrared maps and the new catalogue are presented in Section 4. The source counts and a discussion of the effects of confusion and cosmic variance are reported in Section 5.
2 The sample: LHEX + LHNW
The Lockman Hole (Lockman et al., 1986) is the sky region with the lowest HI column density, and is thus best suited for the detection of faint extragalactic infrared sources. Moreover, available multiwavelength observations in this area (Hasinger et al. 2001, Fadda et al. 2004 in prep., and Rodighiero et al., 2004 in prep., Rodighiero et al., 2003, Kawara et al., 2004, Scott et al., 2002, De Ruiter et al., 1997, and Ciliegi et al. 2003), allow to study the spectral energy distributions of the detected sources and to address their physical nature.
ISOPHOT, on board the ISO satellite, observed two different regions in the Lockman Hole. Each one of the two fields, called LHEX and LHNW, covers an area of and has been surveyed at two far-infrared wavebands with the C100 and C200 detector (respectively at 95 and 175 m), in the P22 survey raster mode. The ISOPHOT survey in the LHEX field has been reported in Paper I, while we extend here our analysis to the LHNW, which consists of a mosaic of four rasters, each one covering an area of . The observational parameters are reported in Paper I.
3 Data reduction
The LHNW data set has been reduced with the procedure described in Paper I and successfully applied to the LHEX field. The procedure is based on a parametric algorithm that fits the signal time history of each detector pixel. It extracts the background level, in order to identify the singularities induced by cosmic-rays impacts and by transient effects in the detectors, and to identify and extract real sky sources.
The source extraction process, the completeness, the photometric and astrometric accuracies of the final catalogues have been tested by us with extensive sets of simulations, by inserting into the real image sources with known flux and position, and accounting for all the details of the reduction procedure. We defer the interested reader to Paper I for details. The flux calibration was also verified by reducing with the same technique ISOPHOT 95 m observations of some selected standars, such as calibrating stars and IRAS sources, in order to cover the flux range spanned by our Lockman source catalogue.
4 The 95 m source catalogue
In Paper I, we detected 36 sources with S/N (corresponding to a flux of 16 mJy) within the LHEX area, making up a complete flux-limited sample for mJy. Reliable sources were detected, with decreasing but well-controlled completeness, down to mJy. In the twin LHNW area of 0.5 deg2, we detect 28 sources above a 3- threshold, reaching the same flux level as in the previous sample.
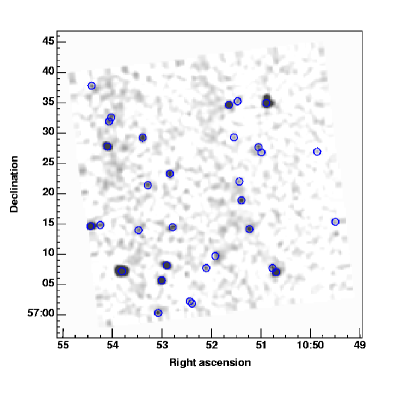
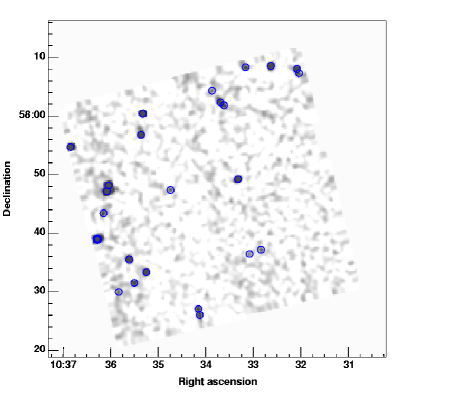
In Figure 1 we show the final maps obtained in the LHEX and in the LHNW fields. The open circles indicate sources detected with a signal-to-noise ratio greater than 4. In Table 1 we report the new list of sources detected in the LHNW region. The entries are: IAU-conformal names, sky coordinates (right ascension and declination at Equinox J2000), the detection significance (signal-to-noise ratio), the 95 m total fluxes (in mJy) and their uncertainties. As discussed in Paper I, all sources have been extracted from the maps and confirmed by visual inspection of the pixel history. This approach produces an highly reliable source catalogue.
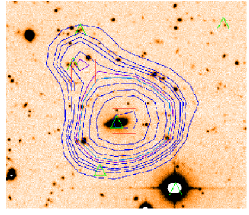
Our source extraction tool and simulation procedures can be optimally used to recover the total fluxes for slightly blended sources. An example is reported in Figure 2, where for a pair of ISOPHOT complex sources (sources 8 and 17 in LHEX, see catalogue in Paper I) we show the optical R band image (Fadda et al. 2004, in prep.) with overlayed the 95 m contours. The ISOPHOT positions are marked with open squares, the triangles indicate the ISOCAM 15 m detections (Fadda et al., 2004). The distance between the two far-IR sources, arcseconds, typical for the few blended objects in the LHEX and LHNW maps, slightly exceeds the ISOPHOT C100 beam ( 45 arcsec).
The final combined LHEX+LHNW catalogue contains a total of 64 sources, detected at 95 m over an area of about 1 square degree.
| ID | RA | DEC | S/N | Flux |
|---|---|---|---|---|
| (J2000) | (J2000) | [mJy] | ||
| LHJ103521+580034 | 10:35:21.2 | +58:00:34 | 33 | 235 24 |
| LHJ103606+574715 | 10:36:06.7 | +57:47:15 | 22 | 163 17 |
| LHJ103604+574815 | 10:36:04.4 | +57:48:15 | 21 | 181 20 |
| LHJ103653+575444 | 10:36:53.8 | +57:54:44 | 16 | 201 24 |
| LHJ103618+573904 | 10:36:18.2 | +57:39:04 | 16 | 227 26 |
| LHJ103515+573330 | 10:35:15.5 | +57:33:30 | 16 | 136 16 |
| LHJ103523+575656 | 10:35:23.3 | +57:56:56 | 15 | 114 14 |
| LHJ103318+574925 | 10:33:18.6 | +57:49:25 | 15 | 159 19 |
| LHJ103236+588042 | 10:32:36.2 | +58:80:42 | 12 | 109 14 |
| LHJ103537+573537 | 10:35:37.4 | +57:35:37 | 12 | 114 13 |
| LHJ103530+573139 | 10:35:30.8 | +57:31:39 | 8 | 73 12 |
| LHJ103409+572715 | 10:34:09.1 | +57:27:15 | 8 | 63 10 |
| LHJ103407+572613 | 10:34:07.5 | +57:26:13 | 8 | 69 10 |
| LHJ103341+582031 | 10:33:41.2 | +58:20:31 | 8 | 77 12 |
| LHJ103202+588009 | 10:32:02.4 | +58:80:09 | 8 | 97 15 |
| LHJ103610+574330 | 10:36:10.6 | +57:43:30 | 7 | 85 14 |
| LHJ103336+582000 | 10:33:36.7 | +58:20:00 | 6 | 34 7 |
| LHJ103308+588030 | 10:33:08.8 | +58:80:30 | 5 | 80 16 |
| LHJ103445+574733 | 10:34:45.1 | +57:47:33 | 5 | 48 10 |
| LHJ103249+573719 | 10:32:49.7 | +57:37:19 | 5 | 56 11 |
| LHJ103352+584030 | 10:33:52.1 | +58:40:30 | 4 | 55 14 |
| LHJ103304+573637 | 10:33:04.3 | +57:36:37 | 4 | 55 14 |
| LHJ103550+573005 | 10:35:50.4 | +57:30:05 | 4 | 49 11 |
| LHJ103159+587026 | 10:31:59.8 | +58:70:26 | 4 | 100 24 |
| LHJ103524+575749 | 10:35:24.5 | +57:57:49 | 3 | 35 7 |
| LHJ103316+573136 | 10:33:16.1 | +57:31:36 | 3 | 30 10 |
| LHJ103327+574539 | 10:33:27.6 | +57:45:39 | 3 | 42 12 |
| LHJ103313+589010 | 10:33:13.2 | +58:90:10 | 3 | 21 7 |
5 Source counts from the Lockman Hole 95 m survey
We have computed the 95 m source counts down to a flux level of 30 mJy, following the same procedure described in Paper I. The counts have been corrected for the incompleteness factors derived through simulations. According to these, the completeness decreases from around 100 mJy, to around 40 mJy, see Table 1 in Paper I). Poissonian noise has been considered.
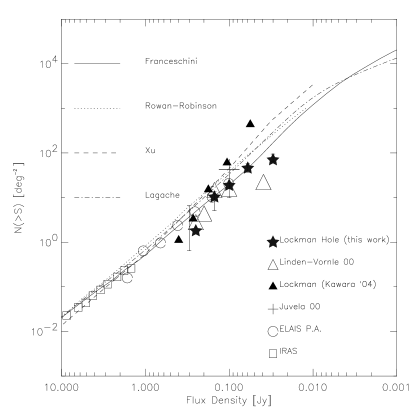
The new source counts confirm our previous finding for the LHEX field. The integral counts are plotted in Figure 3 as starred symbols. Our results are compared with those from other surveys: the preliminary analysis of the ISOPHOT ELAIS survey (Efsthatiou et al. 2000, open circles); the counts derived from the IRAS 100m survey (open squares); those published by Linden-Vornle et al. (2000, open triangles), Juvela et al. (2000, ’+’ symbol) and recently by Kawara et al. (2004, filled triangles) which are based on the same dataset (see discussion below). A comparison is made also with model counts by Franceschini et al. (2001, solid line), Lagache et al. (2002, dot-dashed line), Xu et al. (2001, dashed line) and Rowan-Robinson et al. (2001, dotted line). The slope of the counts turns out to be .
The good agreement with the ELAIS source counts (which are based on a larger area) suggests that these results are not much affected by spatial biases. In the fainter flux region below 100 mJy, the source counts from different surveys appear instead more scattered.
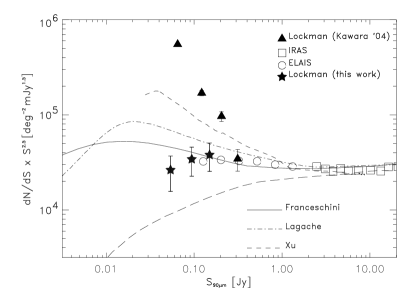
In Figure 4 we report the differential 95 m counts dN/dS normalized to the Euclidean law (the data are reported in Table 2). For this we have used only sources with a signal-to-noise ratio greater than 4. The results are compared with those from Kawara et al. (2004, filled triangles) and from the preliminary analysis of the ISOPHOT ELAIS survey (Efsthatiou et al. 2000, open circles). A comparison is performed with modellistic differential counts from Franceschini et al. (2001), Xu et al. (2001) and Lagache et al. (2002).
Our results differ from those of Kawara et al. (2004), who analysed the same dataset used here (i.e. the combined LHEX and LHNW ISOPHOT 95 m data), but with an independent reduction based on the standard PHOT Interactively Analysis (PIA, Gabriel et al. 1997). Their final catalogue includes quite more sources than ours (223 versus 64), at similar flux levels and S/N ratios. The two number counts turn out to be in good agreement only above 200 mJy. Although unable to understand the origin of this difference, we note that different flux calibrations were adopted by the two analyses, Kawara et al. using a single reference, IRAS F10507+5723. In any case, our careful detector time-sequence analysis and the simulations performed to check each sources should in principle allow us a robust rejection of spurious detections, while at the same time keeping under control the survey incompleteness.
With this new extended sample we confirm our conclusions in Paper I about the existence of an evolving population of IR galaxies, consistent with independent results based on deep ISOCAM mid-IR and ISOPHOT 175 m counts. Our analysis, however, indicates that the evolution cannot be too strong since the level of the counts at the faintest fluxes is not very high. The counts predictions reported in the figures typically assume that the whole local galaxy population evolves back in cosmic time in luminosity and/or number density. With such an assumption, the model counts tend to more or less exceed our data at the faint fluxes. In the evolutionary scheme by Franceschini et al. (continuous lines) the contribution of a non-evolving normal galaxy population dominating the bright counts adds to that of a fast evolving starburst-galaxy component rising up at faint fluxes, then producing relatively flat overall counts. The present results at 95 m seem to confirm this model.
An apparently non-random spatial distribution of the 95 m sources was already indicated in Paper I. A comparison of the two maps in LHEX and LHNW (Fig. 1) shows even more clearly the effects of field-to-field variation (28 versus 36 sources detected in the to areas). The source spatial distribution in LHNW seems particularly inhomogeneous, with source clustering close to two map borders. This strong clustering of the far-IR sources (whose physical origin may be related with the effects of galaxy interactions and mergers as a trigger of the starburst-induced far-IR emission) makes the confusion problem very serious. Four sources in LHNW and five in LHEX appear with close companions (see one example in Fig.2), emphasizing that source blending and confusion happens even at these moderately faint flux limits. Although progress is being achieved with Spitzer, definitely larger space telescopes (e.g. the Herschel Space Observatory, due to launch in 2007) will be required for proper sampling of this difficult waveband domain.
| Integral | Differential | |||||
| S | dN(S) | flux bin | bin center | |||
| mJy | deg-2 | mJy | mJy | deg-2mJy1.5 | ||
| 30 | 70.0 | 30-100 | 54 | |||
| 60 | 45.7 | 60-150 | 94 | |||
| 100 | 18.8 | 100-300 | 173 | |||
| 150 | 10.3 | |||||
| 300 | 1.8 | |||||
Acknowledgments
We acknowledge many exchanges and support from C. Lari. We thank an anonymous referee. This work was partly supported by the ”POE” EC TMR Network Programme (HPRN-CT-2000-00138).
References
- (1) Bertin E., Dennefeld M., Moshir M., 1997, A&A, 323, 685
- (2) Cesarsky C. J., Abergel A., Agnese P. et al., 1996, A&A, 315, 32
- (3) Dole H., Gispert R., Lagache G. et al., 2001, A&A, 372, 364
- (4) Efstathiou A., Oliver S., Rowan-Robinson M. et al., 2000, MNRAS, 319, 1169
- (5) Elbaz D., Cesarsky C.J., Fadda et al., 1999, A&A 351, L37
- (6) Fazio G.G., Eisenhardt P. & Huang J.-S., 1999, Ap&SS, 269, 541
- (7) Franceschini A., Aussel H., Cesarsky C. J., Elbaz D., Fadda D., 2001, A&A, 378, 1
- (8) Gabriel C., Acosta-Pulido J. A., 1999, in The Universe as Seen by ISO. Eds. P. Cox & M. F. Kessler. ESA-SP 427
- (9) Juvela M., Mattila K., Lemke, D., 2000, A&A, 360, 813
- (10) Kawara K., Matsuhara H., Okuda H., et al., 2004, A&A, 413, 843
- (11) Lacey C. and Cole S., 1994, MNRAS, 271, 676L
- (12) Lagache G., Dole H., Puget J. L., 2003 MNRAS, 555
- (13) Lemke D., Klaas U., Abolins J., et al., 1996, A&A 315, L64
- (14) Linden-Vornle M. J. D., Norgaard-Nielsen H. U., Jorgensen H. E. et al., 2000, A&A, 359, 51
- (15) Lockman F. J., Jahoda K., McCammon D., 1986, ApJ, 302, 432
- (16) Oliver S., Rowan-Robinson M., Saunders W., 1992, MNRAS, 256, 15
- (17) Puget J. L., Abergel A., Bernard J.-P., et al., 1999, A&A, 345, 29
- (18) Rodighiero, G., Lari C., Franceschini A., Greganin A., Fadda D., 2003, MNRAS, 343, 1155 (Paper I)
- (19) Rowan-Robinson M., 2001, ApJ, 549, 745
- (20) Scott S. E., Fox, M. J., Dunlop, J. S., et al., 2002, MNRAS, 331, 817
- (21) Xu C., Lonsdale C. J., Shupe D. L., O’Linger J., Masci F., 2001, ApJ, 562, 179