OGLE 2003–BLG–235/MOA 2003–BLG–53: A planetary microlensing event.
Abstract
We present observations of the unusual microlensing event OGLE 2003–BLG–235/MOA 2003–BLG–53. In this event a short duration (7 days) low amplitude deviation in the light curve due a single lens profile was observed in both the MOA and OGLE survey observations. We find that the observed features of the light curve can only be reproduced using a binary microlensing model with an extreme (planetary) mass ratio of for the lensing system. If the lens system comprises a main sequence primary, we infer that the secondary is a planet of about 1.5 Jupiter masses with an orbital radius of AU.
1 Introduction
Gravitational microlensing occurs when a foreground object passes through or very near the line of sight of a background source star generating a well known symmetric light curve profile. If the foreground lens object is a star with an orbiting planet, then the presence of the planet may be detectable via a brief disturbance in the single lens light curve (Mao & Paczyński, 1991; Gould & Loeb, 1992). This effect can potentially be utilized to detect planets with masses ranging from those of gas giants right down to terrestrial planets (Bennett & Rhie, 1996).
The short timescales of these deviations, ranging from a few days for giant planets to hours for terrestrial planets, and their unpredictability, present considerable challenges in any observational program. While some encouraging results have been obtained (Bennett et al., 1999; Albrow et al., 2000; Rhie et al., 2000; Bond et al., 2002; Jaroszyński & Paczyński, 2002), no firm detections of planets by microlensing have previously been obtained.
In this Letter we report observations, obtained by OGLE and MOA, of the event OGLE 2003–BLG–235/MOA 2003–BLG–53 (hereafter O235/M53) that was independently detected in both survey programs. We observed a 7 day deviation that was strongly detected in both surveys. We show that an extreme mass ratio binary microlensing model best reproduces the observed features in the light curve.
2 Observations
Presently, Galactic bulge microlensing events are discovered and then alerted by the two independently operating survey groups OGLE (Udalski, 2003) and MOA (Bond et al., 2001). The microlensing event OGLE 2003–BLG–235 (=18:05:16.35, =28:53:42.0, J2000.0) was first identified and alerted by the OGLE EWS system (Udalski, 2003) on 2003 June 22. It was independently detected by MOA on 2003 July 21 and alerted as MOA 2003–BLG–53.
OGLE observations were carried out with the 1.3 m Warsaw telescope at Las Campanas Observatory, Chile, which is operated by the Carnegie Institute of Washington, equipped with a mosaic CCD camera with 81928192 pixels. The images were obtained in the I band with an exposure time of 120 seconds each. The observations presented here come from the OGLE-III phase of the OGLE survey and started in August 2001. Additional photometry of the star was also collected during OGLE-II phase (1997–2000). This dataset indicates, however, no variability of the object during that period and was not used in further analysis.
MOA observations were carried out from the Mt John Observatory in New Zealand with a 0.6 m telescope equipped with a mosaic CCD camera with 40966144 pixels. The MOA images were obtained using 180 second exposures with a broad band red filter with its throughput centered on the standard I band.
The photometry was derived using difference imaging analysis carried out independently by the OGLE and MOA teams on their respective datasets. This method is the current state-of-the-art for photometric accuracy in crowded fields (Alard, 1999; Alcock et al., 1999). Our analysis resulted in two sets of time-series photometry in the I band corresponding to 183 OGLE measurements and 1092 MOA measurements during 2000–2003.
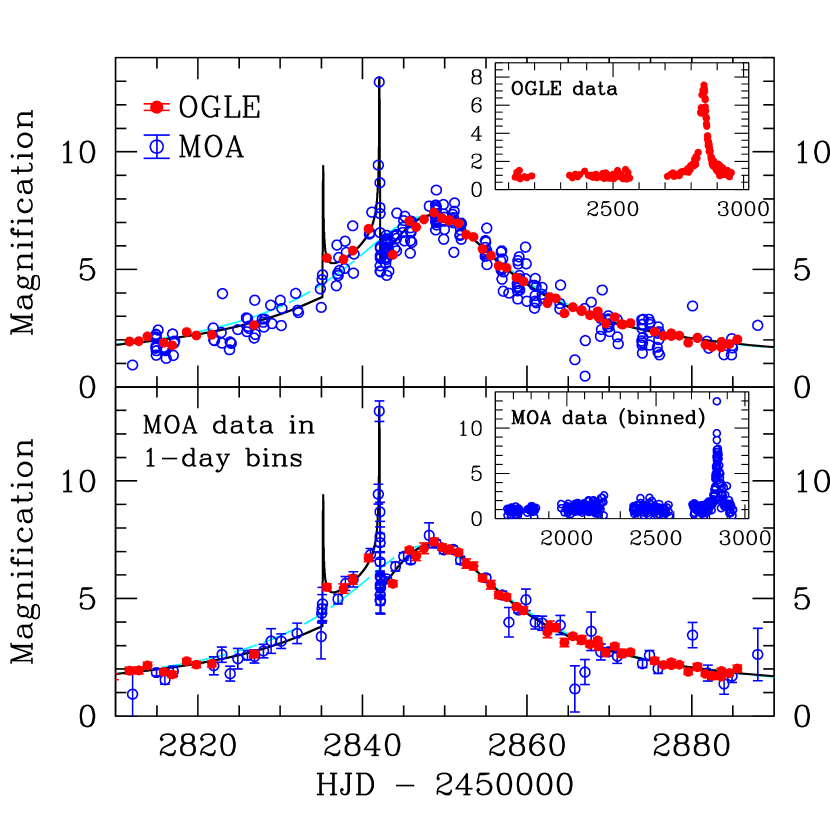
In Fig. 1 we show the light curve for this event on various timescales from March 2000 to the present. The long term behavior is typical for single point mass microlensing events, and it is similar to the almost 2000 other events discovered in the Galactic Bulge since 1993. The unique feature of O235/M53 is, however, a short duration deviation from the profile expected for a single lens, seen clearly in both datasets during 2003 July 14–21. Moreover, a spike, characteristic of those binary microlensing events where the source enters or exits a bounded “caustic” region in the magnification map projected on the sky, was observed and well covered by MOA on 2003 July 21. This caustic region was crossed in 12% of the overall lens Einstein radius crossing time. This short duration, combined with the small (25%) amplitude of the photometric deviation in the caustic region interior, suggests an extreme mass ratio binary system.
As well as regular monitoring in the I band, several V band observations were obtained by OGLE at various magnifications of the event. These were not used in the microlensing modeling, but they were used to constrain the source and lens star properties. By plotting the linearized fluxes in the I and V bands against each other, a model independent measurement of the color index of the source star was determined. We obtained . Using mag for the interstellar reddening towards the source (Sumi, 2003), the corrected color index of indicates a G type source star.
3 Light curve modeling
The modeling of the observed light curve of O235/M53 was performed independently by three groups using different methods to generate numerical binary microlensing light curves (Bennett & Rhie, 1996; Mao & Loeb, 2001; Rattenbury et al, 2002), and all three found the solution that is presented in Fig. 1. The observable quantities for all microlensing events are the Einstein radius crossing time, , the impact parameter (in Einstein radius units) of the source star trajectory with respect to the lens center-of-mass (c.o.m.), and the time, , of the closest approach to the c.o.m. For binary microlensing events, one also measures the mass ratio, , the transverse separation, , of the lens components, and the position angle, , of the binary with respect to the source–lens transverse velocity. For caustic crossing events, one also measures the ratio, , of the apparent angular radius of the source star to that of the Einstein ring. In addition to these 7 physical parameters, there are two linear scaling parameters between the magnification and the flux units for each passband, giving a total of 11 parameters for the modeling. In our modeling procedure, we searched for local minima using minimization procedures that allowed all 11 parameters to vary simultaneously. Our light curve modeling also employed a surface limb darkening profile appropriate for a G type star assuming a metalicity that is approximately solar.
In Table 1, we list the physical microlensing parameters for the best fitting model shown in Fig. 1. This model has for 1267 degrees of freedom and an extreme mass ratio of , which is a strong indication that the secondary may be a planet. Since microlensing light curves generally allow a much more accurate determination of the secondary:primary mass ratio, than the absolute mass of either body, the most sensible way to distinguish planetary microlensing events from those due to binary systems is through a criterion based on the mass ratio parameter . There is a well known minimum in the distribution of mass ratios for binary stars and planetary systems, which is known as the “brown dwarf desert.” There are few systems known with (Halbwachs et al., 2000; Chabrier, 2003; Mazeh & Zucker, 2002). Thus it is sensible to define the boundary between stellar binary and planetary binary microlensing events in between these values to minimize any possible ambiguity. This leads to a criterion of for a planetary microlensing event, and so O235/M53 is clearly in the planetary event category.
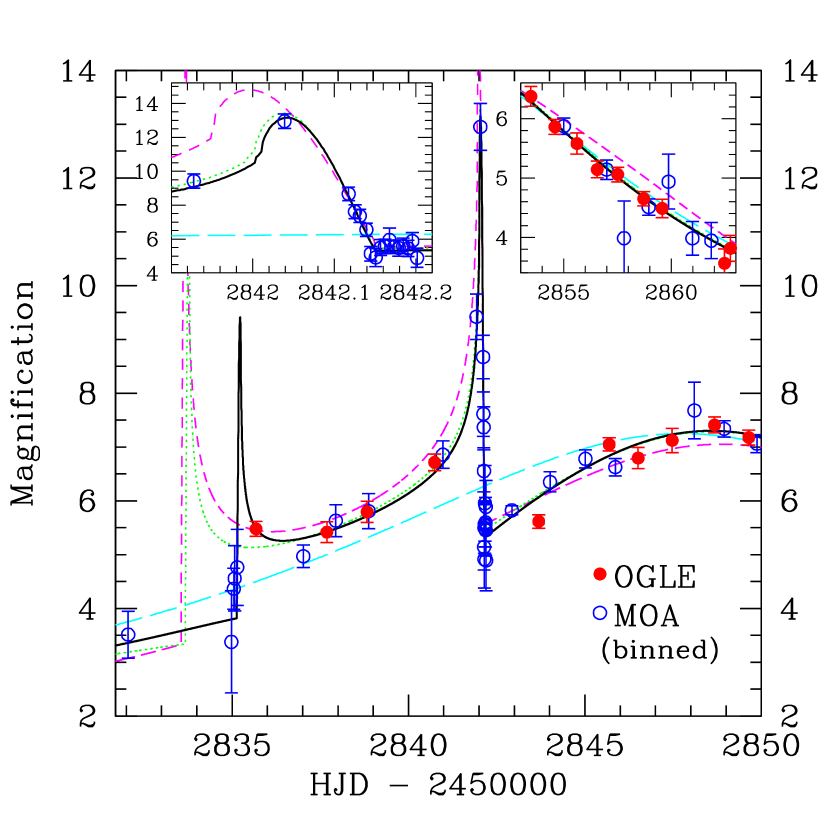
We have carried out a systematic search in parameter space to try to find sets of model parameters that might explain the observed light curve with a larger mass ratio. Binary microlensing models with that traverse a caustic curve in days have much larger magnifications inside the caustic curve than is observed for O235/M53. These binary lens events also have much larger deviations from a single lens light curve before and after the caustic crossings. As the mass ratio is decreased, the best fit light curves approach the observed light curves, with much weaker caustic crossing deviations. In Fig. 2, we show a close-up of the 7 day deviation with the best fit planetary model, compared with the best non-planetary model with and best fit single lens model. The non-planetary binary models and single lens models are strongly disfavored with fit values that are larger by and respectively. In both cases, the improvement for the best fit model is quite significant in both the MOA and OGLE data sets (see Table 1). The failure of the non-planetary binary model can be seen in the Fig. 2 inserts. This model predicts both stronger caustic signals and significant deviations 13–20 days after the second caustic crossing that are not consistent with the observations. This model also shows some discrepancies at magnifications , but these are not as strongly excluded due to the higher photometric uncertainties at lower magnification.
Also shown in Fig. 2 is a planetary model with an earlier caustic crossing and a larger planet mass ratio: . This fit represents a distinct local minimum of the surface, and is disfavored by only or . This is not accounted for by our 1– uncertainty on . Therefore, we have increased the upper error estimate on the planetary mass ratio to 0.0011, so that the actual uncertainty in will be bounded by our error estimates at the 3– level. In Table 1 we also list the parameters for these alternative models.
Finally, the first OGLE observation after the second caustic crossing indicates a magnification below all of the binary models shown by about . Such an outlier is not unusual because the real photometric error distributions for crowded field photometry generally have larger wings than a Gaussian distribution. Three of the 183 OGLE measurements are outliers from the best fit by , and 16 are outliers by . These outlier points do not appear to cluster in the vicinity of the planetary deviation. If this single data point did indicate a real light curve deviation, it could be explained by a small variation to the planetary microlensing model, such as a moon orbiting the planet, but there is no non-planetary model that could help to explain it.
4 Further constraints on the source and lens
Most microlensing events have only a single measureable parameter, , that constrains the lens mass, distance, and tranverse velocity with respect to the line-of-sight to the source. However, time resolved observations of binary event caustic crossings resolve finite source star effects and partly remove these degeneracies (Alcock et al., 2000; Witt & Mao, 1994; Nemiroff & Wickramasinghe, 1994; Gould, 1994), by allowing a measurement of the Einstein angular radius given by .
Using the flux parameters of the microlensing fit, we obtained for the source star and for the blended component. This source star magnitude, plus the V–I color from Section 2, can be compared to the bulge color magnitude diagram of Holtzman et al. (1998), and this indicates that the source is probably a bulge star near the main sequence turn-off. To determine the angular radius of the source star we used the color-color relations of Bessell & Brett (1988) together with empirical relations between and surface brightness derived from interferometry observations of nearby main sequence stars (van Belle, 1999; di Benedetto, 1998).
We find as, which combined with our measurement of , yields as. This yields the following relation between the lens mass and distance
| (1) |
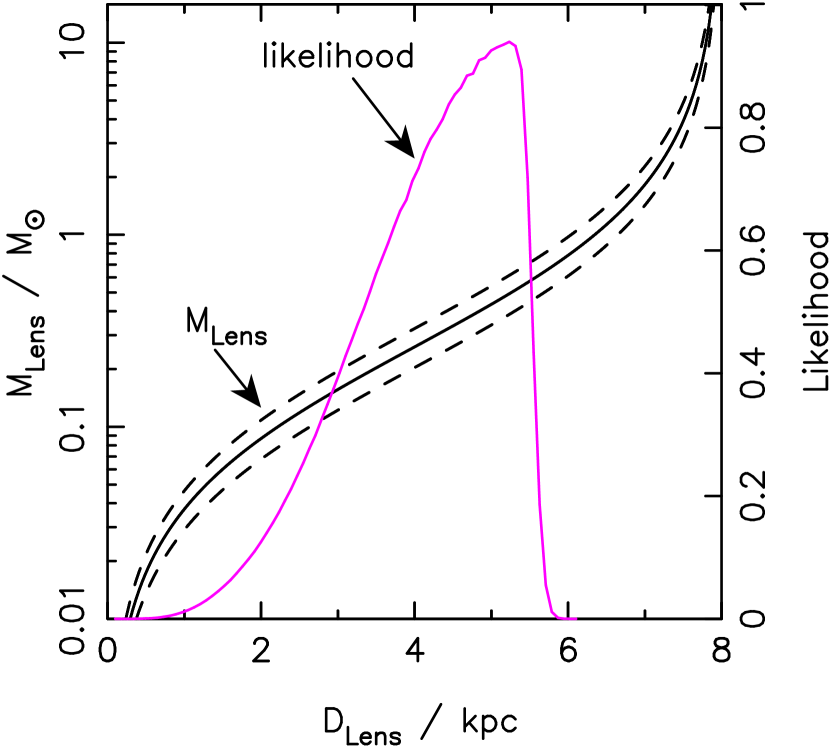
where . If we combine this relation with the mass luminosity relations of Kroupa & Tout (1997) for main sequence stars, and require that the lens luminosity at a given distance does not exceed the blend flux, we obtain an upper limit (90% confidence) of kpc. Thus, if the lens is a main sequence star, it must be in the Galactic disk.
In Fig. 3, we show Eqn. 1 together with the results of a maximum likelihood analysis based on our measurements of the Einstein ring and its characteristic crossing time. The likelihood function was calculated using the Galactic disk models of Han & Gould (1996). We then obtain with 90% confidence: kpc from which we infer the lensing system to comprise an M2–M7 dwarf star of mass M☉ with a giant planetary companion of MJ (Jupiter masses). The planet is in a wide orbit with a transverse separation of AU.
Another possibility for the lens is that it could be a remnant object such as a white dwarf, neutron star, or black hole. If the lens is a white dwarf with mass 0.6 M☉, Eqn. 1 would place it a distance of 5.5 kpc. In this case, the microlensing parameters would imply a 2.5 MJ planet orbiting the white dwarf with a transverse separation of 2.8 AU.
5 Discussion
In Section 3 we concluded that the observed light curve of O235/M53 is best described by a binary lensing model with an planetary mass ratio of . Our definition of the planetary nature of the secondary lens by means of the mass ratio is optimal when the mass ratio can be measured, but it is useful to consider other possible definitions. Another potential dividing line between planets and brown dwarfs is the Solar metalicity threshold for sustained Deuterium burning at 13.6 MJ, although Deuterium burning itself has little relevance for planet formation.
The situation in the case of O235/M53 was helped by the measurement of finite source effects. If the lens is a main sequence star, then as shown in the previous section, it must be an M dwarf with a MJ planetary companion111The only other M dwarf star known to have planetary companions is Gliese 876 (Marcy et al, 2001).. There is a non-negligible chance that the lens is a white dwarf and a much smaller chance that it is a neutron star, but in both cases, a planetary companion below the nominal 13.6 MJ threshold is required. Only in the unlikely case of a massive black hole primary, could the secondary be outside the range traditionally associated with a planet.
There are some prospects for follow-up observations of this event. Our measurements of the finite source effects imply a proper motion of the lens with respect to the source of . High resolution imaging carried out years from now with JWST or adaptive optics systems should be able to resolve the lens and source stars providing direct measurements (Han & Chang, 2003; Alcock et al., 2001) of the color and brightness of the lens, as well as confirmation of the proper motion measurement.
We present these observations as a demonstration of the planetary microlensing phenomenon. The power of microlensing is in its ability to acquire statistics on many systems (Bennett & Rhie, 2002). These include planets in wide orbits, very low mass planets, and even planets in other galaxies (Covone et al., 2000; Bond et al., 2002). The challenge now to the microlensing community is to develop effective strategies to find more planetary microlensing events.
Numerical photometry of OGLE 2003–BLG–235/MOA 2003–BLG–53 is available from the websites for OGLE http://ogle.astrouw.edu.pl and MOA http://www.physics.auckland.ac.nz/moa.
References
- Alard (1999) Alard, C., 1999, A&A, 343, 10
- Albrow et al. (2000) Albrow, M.D., et al., 2000, ApJ, 533, 378
- Alcock et al. (1999) Alcock, C. et al., 1999, ApJ, 521, 602
- Alcock et al. (2000) Alcock, C. et al., 2000, ApJ, 541, 270
- Alcock et al. (2001) Alcock, C. et al., 2001, Nature, 414, 617
- Bennett & Rhie (1996) Bennett, D.P. & Rhie, S.H. 1996, ApJ, 472, 660
- Bennett & Rhie (2002) Bennett, D.P. & Rhie, S.H. 2002, ApJ, 574, 985
- Bennett et al. (1999) Bennett, D.P. et al., 1999, Nature, 402, 57
- Bond et al. (2001) Bond, I.A., Abe, F., Dodd, R.J. et al., 2001, MNRAS, 327, 868
- Bond et al. (2002) Bond, I.A., Rattenbury, N.J., Skuljan, J. et al., 2002, MNRAS, 333, 71
- Bessell & Brett (1988) Bessell, M.S. & Brett, J.M. 1988, PASP, 100, 1134
- Chabrier (2003) Chabrier, G. 2003, ApJ, 586, L133
- Covone et al. (2000) Covone, G. et al. (2000), ApJ, 357, 816
- di Benedetto (1998) di Benedetto, G.P. 1998, A&A, 339, 858
- Gould (1994) Gould, A., 1994, ApJ, 421, L71
- Gould & Loeb (1992) Gould, A. & Loeb, A. 1992, ApJ, 396, 104
- Halbwachs et al. (2000) Halbwachs, J.L., Arenou, F., Mayor, M. Udry, S. & Queloz, D., 2000, A&A, 355, 581
- Han & Chang (2003) Han, C. & Chang, H.Y., 2003, MNRAS, 338, 637
- Han & Gould (1996) Han, C. & Gould, A. 1996, ApJ, 467, 54
- Holtzman et al. (1998) Holtzman, J.A. et al., 1998, AJ, 115, 1946
- Jaroszyński & Paczyński (2002) Jaroszyński, M. & Paczyński, B. 2002, Acta Astron., 52, 361
- Kroupa & Tout (1997) Kroupa, P. & Tout, C.A. 1997, MNRAS, 287, 402
- Marcy et al (2001) Marcy, G.W. et al., 2001, ApJ, 556, 296
- Mao & Loeb (2001) Mao, S. & Loeb, A. 2001, ApJ, 547, L97
- Mao & Paczyński (1991) Mao, S. & Paczyński, B. 1991, ApJ, 374, L37
- Mazeh & Zucker (2002) Mazeh, T. & Zucker, S. 2002, Rev. Mod. Astron., 15, 133
- Nemiroff & Wickramasinghe (1994) Nemiroff, R.J. & Wickramasinghe, W.A.D.T. 1994, ApJ, 424, 21
- Rattenbury et al (2002) Rattenbury, N.J., Bond, I.A., Skuljan, J. & Yock, P.C.M. 2002, MNRAS, 335, 159
- Rhie et al. (2000) Rhie, S.H. et al., 2000, ApJ, 533, 378
- Sumi (2003) Sumi, T. 2003, MNRAS, in press (astro-ph/0309206)
- Udalski (2003) Udalski, A. 2003, Acta Astron., 53, 291
- van Belle (1999) van Belle, G.T. 1999, PASP, 111, 1515
- Witt & Mao (1994) Witt, H. & Mao, S., 1994, ApJ, 430, 505
| Model | |||||||||||
|---|---|---|---|---|---|---|---|---|---|---|---|
| (days) | mag | (1267 dof) | (1089 dof) | (178 dof) | |||||||
| Best Fit | 19.70(15) | ||||||||||
| Early Caustic | 19.62 | ||||||||||
| Best Non-planet | 19.68 | ||||||||||
| Single Lens | – | – | – | – | 19.10 |
Note. — The units for are .