THE KINEMATICS OF MORPHOLOGICALLY SELECTED GALAXIES
IN THE GOODS-NORTH FIELD11affiliation: Based on data obtained at the
W.M. Keck Observatory, which is operated as a scientific partnership
among the California Institute of Technology, the University of
California, and NASA, and was made possible by the generous financial
support of the W.M. Keck Foundation.
Abstract
We present near-IR spectra of emission from 13 galaxies at in the GOODS-N field. The galaxies were selected primarily because they appear to have elongated morphologies, and slits were aligned with the major axes (as determined from the rest-frame UV emission) of 11 of the 13. If the galaxies are elongated because they are highly inclined, alignment of the slit and major axis should maximize the observed velocity and reveal velocity shear, if present. In spite of this alignment, we see spatially resolved velocity shear in only two galaxies. We show that the seeing makes a large difference in the observed velocity spread of a tilted emission line, and use this information to place limits on the velocity spread of the ionized gas of the galaxies in the sample: we find that all 13 have km s, where is the velocity shear (half of the velocity range of a tilted emission line) that would be observed under our best seeing conditions of . When combined with previous work, our data also indicate that aligning the slit along the major axis does not increase the probability of observing a tilted emission line. We then focus on the one-dimensional velocity dispersion , which is much less affected by the seeing, and see that the elongated subsample exhibits a significantly lower velocity dispersion than galaxies selected at random from our total sample, not higher as one might have expected. We also see some evidence that the elongated galaxies are less reddened than those randomly selected using only UV colors. Both of these results are counter to what would be expected if the elongated galaxies were highly inclined disks. It is at least as likely that the galaxies’ elongated morphologies are due to merging subunits.
Subject headings:
galaxies: evolution — galaxies: kinematics and dynamics1. Introduction
At redshifts up to , it is possible to identify disk galaxies, place spectroscopic slits along the galaxies’ major axes, and obtain rotation curves similar to those of disk galaxies in the local universe (e.g. Vogt et al. 1996, 1997; Böhm et al. 2003). As redshift increases galaxy morphologies become increasingly irregular (van den Bergh 2001; Conselice et al. 2003), and spatially resolved spectra for kinematic measurements are more difficult to obtain as galaxy sizes approach the size of the seeing disk and the width of slits. In addition, the rest-frame optical emission lines used for such measurements shift into the near-IR for . Nevertheless spatially resolved and tilted rest-frame optical emission lines from which “rotation curves” can be constructed have been seen for galaxies beyond (Pettini et al. 2001; Lemoine-Busserolle et al. 2003; Moorwood et al. 2003; Erb et al. 2003); these lines generally have low signal-to-noise ratios (S/N) and the morphologies of the galaxies are irregular or unknown, making the interpretation of the tilted lines uncertain. One-dimensional velocity dispersions which do not require spatial resolution are much easier to obtain at high redshift; their use as a mass indicator for such galaxies has been well-studied (e.g. Kobulnicky & Gebhardt 2000), although faint emission lines may not trace a galaxy’s full gravitational potential. Whether or not an emission line is spatially resolved, the alignment of a slit with a galaxy’s apparent major axis should maximize the observed velocity, if the galaxy is elongated because it is highly inclined. Such a slit orientation also tests the alignment of the morphological and kinematic major axes.
Observations such as these at are critical, as it has become increasingly clear that this epoch is an important period in the evolution of the universe. Galaxies at are compact, rapidly star-forming, and morphogically disordered (e.g. Giavalisco et al. 1996; Shapley et al. 2001), whereas those at have become the normal Hubble sequence galaxies of the universe today. Recent results suggest that QSO activity reaches a peak near (Fan et al. 2001), and the median redshift of bright sub-millimeter galaxies is (Chapman et al. 2003). In addition, most of the stellar mass in the universe today formed during this epoch: in a study of galaxies in the HDF-N, Dickinson et al. (2003) find that 50–75% of the mass in today’s galaxies had formed by , but only 3–14% had formed by .
In this paper we present kinematic measurements from emission in galaxies at in the GOODS-N field, making use of the deep HST ACS imaging which has recently been obtained as part of the Great Observatories Origins Deep Survey (GOODS; Giavalisco & GOODS Team 2003). We describe our selection criteria, observations and data reduction in §2, the results of our simple morphological analyses in §3, and our kinematic results in §4. In §4.1 we highlight the critical importance of the seeing to kinematic measurements at high redshift, and we discuss our results in §5. We use a cosmology with , , and throughout. In such a cosmology, 1″ corresponds to 8.1 kpc at , the mean redshift of the current sample.
| Galaxy | R.A. (J2000) | Dec. (J2000) | Exposure time (s) | aaVacuum heliocentric redshift from rest-frame UV interstellar absorption lines. | bbVacuum heliocentric redshift of Ly emission line, when present. | ccVacuum heliocentric redshift of H emission line. | ddFlux of H emission line, in units of 10-17 ergs s-1 cm-2. This should be considered a lower limit because conditions were non-photometric. | SelectioneeReason for selection. E=elongated, T=“triplet,” additional galaxies on slit with BX1084, R=favorable redshift. See §2 for details. | ||
|---|---|---|---|---|---|---|---|---|---|---|
| BX305 | 12:36:37.131 | 62:16:28.358 | 2.4825 | – | 2.4839 | 24.28 | 0.79 | 4.2 | R | |
| BX1055 | 12:35:59.594 | 62:13:07.504 | 2.4865 | 2.4959 | 2.4901 | 24.09 | 0.24 | 2.7 | E | |
| BX1084 | 12:36:13.568 | 62:12:21.485 | 2.4392 | – | 2.4403 | 23.24 | 0.26 | 7.3 | E | |
| BX1085 | 12:36:13.331 | 62:12:16.310 | 2.2381 | – | 2.2407 | 24.50 | 0.33 | 1.1 | T | |
| BX1086 | 12:36:13.415 | 62:12:18.841 | – | – | 2.4435 | 24.64 | 0.41 | 1.8 | T | |
| BX1277 | 12:37:18.595 | 62:09:55.536 | 2.2686 | – | 2.2713 | 23.87 | 0.14 | 5.3 | E | |
| BX1311 | 12:36:30.540 | 62:16:26.116 | 2.4804 | 2.4890 | 2.4843 | 23.29 | 0.21 | 8.0 | E | |
| BX1322 | 12:37:06.538 | 62:12:24.938 | 2.4401 | 2.4491 | 2.4443 | 23.72 | 0.31 | 2.0 | E | |
| BX1332 | 12:37:17.134 | 62:11:39.946 | 2.2113 | – | 2.2136 | 23.64 | 0.32 | 4.4 | E | |
| BX1368 | 12:36:48.241 | 62:15:56.237 | 2.4380 | 2.4455 | 2.4407 | 23.79 | 0.30 | 8.8 | R | |
| BX1376 | 12:36:52.960 | 62:15:45.545 | 2.4266 | 2.4338 | 2.4294 | 24.48 | 0.01 | 2.2 | E | |
| BX1397 | 12:37:04.115 | 62:15:09.837 | 2.1322 | – | 2.1332 | 24.12 | 0.14 | 5.2 | E | |
| BX1479 | 12:37:15.417 | 62:16:03.876 | 2.3726 | 2.3823 | 2.3745 | 24.39 | 0.16 | 2.5 | E |
2. Observations and Data Reduction
The 13 galaxies presented here lie in the Hubble Deep Field North region imaged with the HST Advanced Camera for Surveys (ACS) as part of the GOODS program. We have spectroscopically identified approximately 180 galaxies at in this field, using color selection criteria and rest-frame UV spectra from the LRIS-B spectrograh on the 10 m W.M. Keck I telescope on Mauna Kea (Adelberger et al. 2004; Steidel et al. 2004). We have observed a subset of 13 of these with the near-infrared spectrograph NIRSPEC (McLean et al. 1998), on the W.M. Keck II telescope. The galaxies were selected primarily because they appeared elongated on our initial inspection of the -band GOODS-N data (detailed morphological analysis was not done until the full V1.0 release of the GOODS data in late August 2003). We also tried to select galaxies with redshifts that put in a favorable position with respect to the night sky lines, and chose two (BX305, BX1368) for this reason, as well as for their somewhat more compact appearance for the sake of comparison. BX1085 and BX1086 were observed because it was possible to place both of them on the slit with the elongated galaxy BX1084, as discussed below. The final column in Table 1 summarizes the selection criterion for each galaxy.
We attempted to align the slit with the elongated axis in all cases, with the exception of BX1084, BX1085 and BX1086111BX1086 is the only galaxy in the sample for which we did not previously know the redshift. We believe that the detected line is because the interloper fraction from the BX color selection criteria is %, and the typical interlopers (star-forming galaxies at ) do not have a single strong emission line in the -band. The redshift is also nearly identical to the redshift of BX1084, which is separated from BX1086 by 29., which lie on a single line and were therefore observed simultaneously with the PA set by their relative orientation. Coincidentally this PA differs from the PA of BX1084 by only 19°. Because morphological analysis was done after the observations, the slit and galaxy PAs were slightly misaligned, with an average offset of 10°. 11 out of 13 galaxies therefore had slits aligned to within 25°of the galaxy PA, and 9 out of 13 to within 13°. Such slight misalignments will not prevent the detection of significant rotation, should it exist (Vogt et al. 1996; Simard & Pritchet 1998; Böhm et al. 2003; Metevier et al. 2004). It is also possible for misalignment of the slit and the galaxy to introduce the appearance of velocity shear where none may actually exist; in § 4.1 below we explain why this effect has not biased the current observations. The galaxy PAs and slit positions are given in Table 2.
Most of the observations were conducted on the nights of 7-9 May 2003 (UT), with two additional objects (BX1055 and BX1397) observed on 7-8 July 2003 (UT). We used the 076 42″ slit for all observations. The seeing was relatively poor during the May run, with FWHM 07–09 in the -band; in July the seeing was better, with FWHM 05. Conditions were not photometric on either run, and in particular much of the May data suffers from significant losses due to cirrus clouds. For a detailed description of the observing and data reduction procedures, see Erb et al. (2003).
3. Morphologies
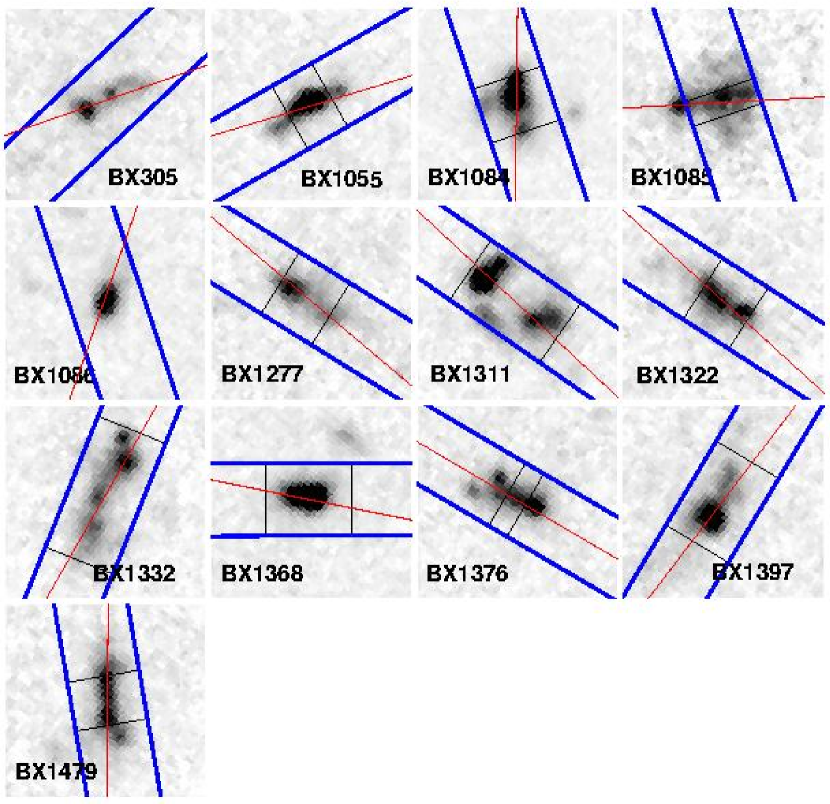
HST ACS images of the 13 galaxies in our sample are shown in Figure 1. For the purpose of morphological analysis we combined the four ACS bands into a single image, weighting in order to maximize the S/N. The images shown therefore cover the approximate range 1300–2500 Å in the rest frame. The slits used are marked with heavy blue lines and the object PA with fine red lines. As noted in §2, the average misalignment of slit and galaxy is 10°; the slit and galaxy PAs are aligned to within 25° for 11 of 13 objects, and to within 13° for 9 of 13. Most of the galaxies appear irregular on simple inspection, and we have not attempted any kind of morphological classification. We have however performed some simple morphological analysis, with two goals in mind: to determine whether there is any correlation between a galaxy’s kinematic properties and its aspect ratio, and to determine a size to be used in mass estimates.
Morphological analysis of faint galaxies is difficult, as it requires the separation of low surface brightness galaxy pixels from the sky background. We have estimated galaxy shapes and sizes using the pixels that make up half of the sky-subtracted light within a 15 (30 pixel) radius around the object centroid. The centroid is determined using an iterative process that calculates the centroid of an object, subtracts the sky value determined from a surrounding annulus, and recomputes the centroid until convergence is reached. We then use the pixels within 15 of the final centroid for the remaining analysis. We calculate two measures of galaxy size as follows. The effective half-light radius , where is the area of pixels encompassing 50% of the galaxy’s light, is sensitive to how large the bright regions of an object are, but not to their distribution; i.e. it depends on the number of pixels required to make up half of the galaxy’s light, but not on how those pixels are distributed within the 30 pixel radius. We find a mean and standard deviation of , corresponding to kpc. We also calculate , the RMS dispersion of the light about the centroid along the major axis (we avoid using the symbol to eliminate confusion with velocity dispersions calculated below), and the aspect ratio , the ratio of the dispersions along the minor and major axes. We find , or kpc, and . We use for mass estimates. Individual values of these parameters are shown in Table 2, and in the following section we relate them to the galaxies’ kinematic properties.
4. Kinematic Results
Close examination of the 13 galaxies’ two-dimensional spectra reveals only two showing spatially resolved velocity shear. We show velocity curves for the two emission lines in Figure 2, constructed by fitting a Gaussian profile in wavelength at each spatial position along the emission line, summing three pixels to increase the S/N. We refer to these figures as velocity curves rather than rotation curves because it is not clear that the tilted lines are caused by rotation; see §5 for discussion of this issue. The first of the tilted emission lines, that of BX1332, extends almost 175 in the spatial direction; this is significantly larger than the 8 seeing disk, and therefore the modest tilt of km s peak-to-peak is readily apparent. Assuming for the moment that this tilt is due to rotation, we calculate a lower limit on the circular velocity of half of the total velocity spread, km s. We emphasize here that we use as an observed quantity defined as half of the velocity spread of the emission line; this is not the terminal circular velocity, and is almost certainly less than that velocity. The second galaxy, BX1397, which was observed in July 2003 when the seeing was 05, has a smaller spatial extent of ″ but a larger velocity range, with km s. The large spatial extent of BX1332 may be suggested by the fact that it is the most elongated of the 13 galaxies, with ; but BX1397 has , slightly higher than the mean . Clearly the aspect ratio does not predict rotation. Such a low incidence of rotation in galaxies with slits placed along their elongated axes is perhaps surprising, especially since our earlier near-IR spectroscopy found tilted lines in about 40% of the galaxies observed, with random (with one exception) slit orientations (Erb et al. 2003). In §4.1 below we discuss limitations on observed rotational velocities imposed by the seeing, and in §5 we consider the implications of our low incidence of observed rotation.
It is also interesting to compare the relative extent of the and rest-frame UV emission. BX1332 and BX1397 have values of of 037 and 020 respectively, but the total spatial extent of all the pixels considered to be part of the galaxy for morphological analysis is for BX1332 and for BX1397. Deconvolving the seeing from the sizes above, we find for BX1332 and for BX1397, values which agree well with the total UV sizes. We can make this comparison for the rest of the objects by measuring the spatial width of the emission line and again deconvolving the seeing. The results of this calculation are shown by the thin lines perpendicular to the slits in Figure 1, which show the approximate extent of the emission. No lines are shown for BX305 and BX1086 because they appeared to be point sources after deconvolution. In general the UV and emission agree well, although there are cases with greater extents of both UV (BX1376) and (BX1368). The spatial extent of the emission line of each galaxy is given in Table 2.
We have calculated one-dimensional velocity dispersions for the galaxies in the sample by fitting a Gaussian profile to each emission line using the splot task in IRAF, which also provides errors. We deconvolved the instrumental profile by subtracting the instrumental FWHM of 15 Å (measured from the widths of sky lines) in quadrature from the Gaussian FWHM; the instrumental profile is comparable to the widths of the lines, so this deconvolution is important. It is possible to obtain higher resolution if the object and the seeing are smaller than the slit, but because the seeing was comparable to the slit width for most of our observations we have used the instrumental resolution as measured from the sky lines. After converting the FWHM to a velocity, we computed the velocity dispersion . The results are shown in column 8 of Table 2, with errors of one standard deviation from propagating the error in the Gaussian line fit. Two of the lines (BX1055 and BX1322) had observed widths less than 10% greater than the instrumental profile, making the deconvolution highly uncertain; for these lines we place an upper limit on of twice the one standard deviation error. The measured width of BX1085 was slightly less than the instrumental FWHM, preventing a calculation of entirely. Neglecting the objects with upper limits, we find a mean velocity dispersion of km s, with a standard deviation of 34 km s; this is somewhat smaller than the mean of the total sample of 61 galaxies at for which we currently have measurements222These data will be discussed in full elsewhere., km s. We have combined these measurements of with our estimates of galaxy sizes to determine masses. We calculate the virial mass , and find a mean and standard deviation of . The results of the mass calculations are shown in Table 2.


4.1. Seeing
4.1.1 Tilted Emission Lines
There is a long list of factors which affect the observed rotation curves of disk galaxies; these include the alignment of the slit with the major axis of the galaxy, the width of the slit compared to the size of the galaxy, the inclination of the disk, the spatial and velocity distribution of emission from the galaxy, and the blurring effect of the seeing (see, e.g., Vogt et al. 1996, 1997; Simard & Pritchet 1999; Böhm et al. 2003; Metevier et al. 2004 for discussion of these effects). We concentrate here on the seeing, which can have a tremendous effect on the velocities observed in galaxies at high redshift. We can see this in two different observations of the galaxy Q1700-BX691 (), which we first observed with NIRSPEC in May 2002 (Erb et al. 2003); during these observations the seeing was 5. Using the identical instrumental configuration and position angle on the sky, we observed the galaxy again in May 2003, when the seeing was 9. In Figure 3 we compare velocity curves derived from the two observations: at left is the previously published velocity curve, which has km s, and on the right is a velocity curve from the May 2003 observations, constructed in identical fashion and plotted on the same scale for comparison. It covers approximately the same spatial range as the previous observation, but shows about half the range in velocity, with km s. It also shows some distortion in the shape of the velocity gradient. These changes are not unexpected: as the seeing worsens, a wider range of velocities from different parts of the galaxy is blurred together, and the emission from the core of the galaxy, which presumably has both the highest surface brightness and the lowest velocity, biases the velocity measurements out to larger and larger radii. Further, flux is lost as the seeing disk approaches and exceeds the size of the slit, the S/N declines as emission is spread over a larger area, and poorer seeing makes it more difficult to center the galaxy (or to be precise, the bright object we offset from) on the slit.
Q1700-BX691 (when observed under good conditions) shows the largest velocity shear we have detected so far; in order to assess the effects of the seeing on galaxies with a variety of velocity spreads, we have smoothed their spectra in order to simulate poorer seeing. This procedure was applied to all of the galaxies showing tilted lines in the May 2002 sample (with the exception of SSA22a-MD41, which was observed at higher spectral resolution with the ISAAC spectrograph on the VLT). We smoothed by first replacing the emission line in the two-dimensional spectra with the sky background (copied from a spatially adjacent portion of the slit, at the same wavelength) to make a sky frame, and then subtracting this sky frame from the original image to create an image of the emission line with the background removed. This profile was then smoothed with a Gaussian filter in the spatial direction; to simulate seeing of 08 with a spectrum in which the original seeing was 05, we used a filter with 06 FWHM (). In order to account for slit losses due to the increase in seeing FWHM, we scaled the smoothed line by a factor of , chosen empirically by measuring the decrease in line flux in the two observations of Q1700-BX691 described above. The smoothed and scaled line was then added to the background frame to produce a final image. We then measured a velocity curve as usual on the resulting two-dimensional spectra. We find that the velocity spread is consistently reduced, but the detailed results are somewhat unpredictable. The effect of the smoothing depends not only on the initial tilt of the line, but also on the total flux and surface brightness. Lines with initial km s (Q1700-MD103, Q1623-BX511) no longer showed a tilt after smoothing, or had S/N too low to construct a velocity curve; those with larger (West-BX600, Q1623-BX447) showed a decrease in the velocity spread of approximately a factor of two, as we saw in the case of Q1700-BX691. The smoothed spectrum of Q1700-BX691 itself has km s, a good approximation to the May 2003 data which has km s.
We use these results to place upper limits on the internal velocity spread of the ionized gas in the galaxies in the current sample: the 11 galaxies with no detected shear, and BX1332 with km s, are likely to have km s, where we use the term to indicate the velocity that would be measured under seeing conditions of 5. It is important to note here that the one remaining galaxy, BX1397, which shows the largest km s, was observed in July 2003 when the seeing was 05 (as measured from a standard star observed immediately before the spectra were taken). Therefore all 13 of the galaxies have km s. In principle, of course, we would like to know the intrinsic velocity rather than ; this has been estimated with detailed modeling of rotation curves at lower redshift (Vogt et al. 1996, 1997). However, such a calculation requires a specific galaxy model such as an exponential disk, and knowledge of the galaxies’ inclinations. Given the irregular morphologies of the galaxies in our sample, such assumptions are not justified. Even if we were to model an intrinsic velocity distribution, it is likely that the results would be highly degenerate; very different configurations of emitting material could produce the same tilted line when significantly degraded by the seeing. We therefore attempt to estimate only .
The seeing clearly reduces our ability to resolve the velocity structure of a galaxy. However, it also mitigates the effects of slit misalignment, which under conditions of high spatial resolution can introduce spurious tilt in an emission line due to the correspondence between position of the emission within the slit and wavelength in the spectrum. For example, if the slit width is 200 km s and a galaxy is tilted within the slit such that one end of it falls on one side of the slit and the other end on the other side of the slit, it will appear to have velocity shear of km seven if its actual velocity shear is zero. This problem will arise only when the FWHM of the galaxy light perpendicular to the slit is significantly smaller than the width of the slit, a situation that is unlikely to occur even under our best seeing conditions of . Given the slight slit misalignments of the current observations, however, it is worthwhile to test the importance of this effect. We have done so by convolving the ACS image of each galaxy with a Gaussian filter to approximate the seeing of the NIRSPEC observation (under the assumption that the emission traces the UV continuum), and measuring the centroid of the galaxy within the slit at each spatial position. We find that the galaxy light fills the slit in all cases, the maximum velocity introduced from the shift of the galaxy centroid across the slit is km s, and the mean induced velocity is km s; depending on the orientation of the galaxy, the velocity shear we observe could be either increased or decreased by these amounts. These numbers are less than our typical errors in velocity. We have also tested the effect of error in the position of the slit by measuring the smoothed galaxies’ centroids within a simulated slit shifted by 02 (our typical uncertainty in positioning the galaxy on the slit) in either direction perpendicular to the slit PA. Again we find that the effect is less than or comparable to our velocity errors, with a maximum introduced velocity of km s and a mean of km s. We therefore believe that only a small fraction of the velocity shear we observe in the tilted lines could be induced by misalignment of the slit.
A related concern involves the one-dimensional velocity dispersions. As noted above and discussed further in §5, the elongated galaxies for which we have placed slits on the extended axes have a lower average velocity dispersion than the sample as a whole. It is possible that by choosing random slit orientations we are artificially elevating the velocity dispersion by illuminating the slit unevenly as described above. We have tested this by smoothing the ACS images of known galaxies to approximate 05 seeing, placing simulated slits along them at random orientations, and measuring the shifts in the galaxies’ centroids in the wavelength direction at each spatial position along the slit. For comparison with the velocity dispersion , we define , where is the full velocity shift of the centroid. We find that the mean induced velocity dispersion km s, with a maximum of 21 km s; these are nearly the same as the mean and maximum induced velocities found above, suggesting that even with large errors in position angle this effect does not introduce substantial velocity errors. The effect of on the observed value of will depend on the source of the velocity dispersion: if the line widths are due to random motions, then the induced velocity dispersion will add to the true velocity dispersion in quadrature to produce the observed profile, and is only a few km s. On the other hand, if the velocity dispersions are due to unresolved velocity shear, could either increase or reduce the observed by up to km s, an amount that is comparable to our typical error in . The effect on the average value of should be quite small, however, since these slit effects should increase or reduce with equal probability. The true situation is likely some combination of these two scenarios. In either case, however, the use of random position angles is unlikely to be a significant contaminant to our measurements of .
4.1.2 Velocity Dispersions
Although the seeing has a strong effect on the measurement of spatially resolved velocity shear, it has a relatively small effect on the one-dimensional velocity dispersion. This is because spatial resolution is not required to measure the velocity dispersion. We can see this by considering the limit in which the seeing disk exceeds the size of the galaxy. In this case we will be unable to distinguish emission from opposite sides of the galaxy (the line will no longer be tilted), but emission from both sides still contributes to the line width. We will then still measure the full velocity dispersion. The situation is slightly more complicated in practice, because of slit losses and decreased S/N: as the seeing worsens emission from the edges of the galaxy may fall outside the slit, decreasing the velocity dispersion somewhat, and S/N degraded by the seeing may limit the detection of faint wings in the line profile, especially if the galaxy’s light is very centrally concentrated.
We have quantified these effects with the observations and simulations described above. For Q1700-BX691 we measure km s with 05 seeing, and km s with 09 seeing; the two values of agree within the errors. We find that this is generally the case with artificially smoothed data as well. The line widths are usually well-preserved after the smoothing, with % of the width retained; the weakest line (Q1623-BX511) shows a significant decrease, but also a substantial increase in the errors due to reduced S/N, such that the two values are still within 1 of each other. The S/N of this degraded spectrum is lower than that of any object in the current sample. We therefore believe that our one-dimensional measurements are relatively uncompromised by the mediocre seeing conditions. The fact that the velocity spread of a tilted line is highly dependent on the seeing, while is not, makes it very difficult to estimate the former from measurements of the latter, as proposed by Weatherley & Warren (2003). Thus, their conclusion that Lyman break galaxies are preferentially low-mass star-bursting systems is premature.
4.2. Large-scale motions
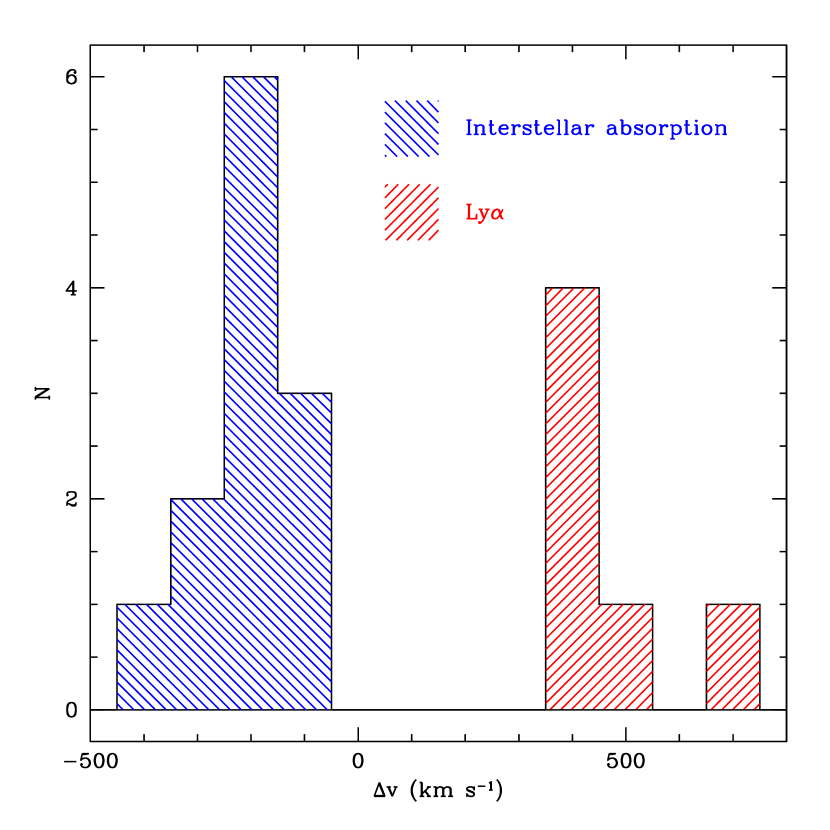
Galactic-scale outflows, identified via the offsets between the redshifts of the UV interstellar absorption lines or and the nebular emission lines, are a common feature of galaxies at (Pettini et al. 2001; Shapley et al. 2003). These outflows typically have speeds of km s with respect to the systemic redshift of the galaxy, and are presumably powered by supernovae. A comparison of the redshifts given in Table 1 from the interstellar absorption lines, , and shows that a similar pattern exists at . In Figure 4 we plot histograms of the velocity offsets of the interstellar absorption lines and with respect to ; we see that the mean offset of the absorption lines is km s, and the mean offset of is km s. These velocities are consistent with those of all of the galaxies for which we have performed this test (Steidel et al. 2004). Note that these velocities are measured from the centroids of the lines; we can estimate the terminal velocity of the outflows by adding half of the interstellar absorption line widths of km s (Steidel et al. 2004) to the numbers given above.
Could these outflows be the cause of any of the tilted emission lines we have observed, or otherwise influence our kinematic measurements? The outflow velocities ( km s) are several times larger than either the velocity spread of the tilted lines or the velocity dispersions, and the results of Shapley et al. (2003) show that nebular emission from HII regions indicates a galaxy’s systemic redshift rather than the redshift of outflowing material: these authors see both stellar photospheric lines and nebular lines from HII regions in the composite spectrum of the Lyman break galaxies, and find that their redshifts agree to within 50 km s. Heckman, Armus, & Miley (1990) have shown that the emission line luminosity of the outflow in M82 is % of the luminosity of the total galaxy. Calzetti et al. (2004) obtain a similar result in a study of the fraction of the ISM ionized by non-radiative processes in four local starburst galaxies, finding that 3–4% of the luminosity arises from such shock-heated gas. If these relations hold in more distant galaxies, we would be unlikely to detect from the outflows, especially given the strong redshift dependence of surface brightness. For these reasons we believe that the observed outflows are unlikely to influence our measurements of .
| Galaxy | aaVacuum heliocentric redshift of H emission line. | PAbbPosition angle of galaxy in degrees. | Slit PAccPosition angle of slit in degrees. | ddEffective half-light radius; see §3. | ddEffective half-light radius; see §3. | eeRMS dispersion of light about centroid along major axis; see §3. | eeRMS dispersion of light about centroid along major axis; see §3. | ffAspect ratio of RMS dispersions along minor and major axes; see §3. | ggApproximate spatial extent of emission line. | ggApproximate spatial extent of emission line. | hhOne-dimensional velocity dispersion from emission line. | ii( for those galaxies which show tilted emission lines. | jjVirial masses calculated from and ; see §§3 and 4. |
|---|---|---|---|---|---|---|---|---|---|---|---|---|---|
| (arcsec) | (kpc) | (arcsec) | (kpc) | (arcsec) | (kpc) | (km s) | (km s) | ( M⊙) | |||||
| BX305 | 2.4839 | 109.2 | 133.4 | 0.28 | 2.3 | 0.25 | 2.0 | 0.32 | – | – | – | 4.1 | |
| BX1055 | 2.4901 | 107.0 | 120.0 | 0.14 | 1.2 | 0.09 | 0.7 | 0.52 | 0.48 | 3.8 | – | 1.2 | |
| BX1084 | 2.4403 | 18.7 | 0.24 | 1.9 | 0.16 | 1.3 | 0.58 | 0.59 | 4.8 | – | 1.5 | ||
| BX1085 | 2.2407 | 93.3 | 18.7 | 0.29 | 2.4 | 0.25 | 2.0 | 0.39 | 0.27 | 2.2 | – | – | – |
| BX1086 | 2.4435 | 18.7 | 0.13 | 1.1 | 0.08 | 0.6 | 0.57 | – | – | – | 0.25 | ||
| BX1277 | 2.2713 | 49.8 | 58.1 | 0.26 | 2.1 | 0.22 | 1.8 | 0.32 | 0.62 | 5.1 | – | 0.83 | |
| BX1311 | 2.4843 | 47.2 | 55.3 | 0.26 | 2.1 | 0.33 | 2.7 | 0.36 | 1.14 | 9.2 | – | 2.3 | |
| BX1322 | 2.4443 | 47.7 | 57.1 | 0.24 | 1.9 | 0.19 | 1.5 | 0.38 | 0.57 | 4.6 | – | 1.5 | |
| BX1332 | 2.2136 | 0.32 | 2.6 | 0.37 | 3.1 | 0.21 | 1.47 | 12.1 | 45 | 1.0 | |||
| BX1368 | 2.4407 | 78.8 | 90.3 | 0.15 | 1.2 | 0.09 | 0.7 | 0.54 | 0.90 | 7.3 | – | 1.5 | |
| BX1376 | 2.4294 | 59.7 | 59.6 | 0.24 | 2.0 | 0.20 | 1.6 | 0.37 | 0.22 | 1.8 | – | 1.8 | |
| BX1397 | 2.1332 | 0.30 | 2.5 | 0.20 | 1.6 | 0.47 | 1.02 | 8.4 | 110 | 2.8 | |||
| BX1479 | 2.3745 | 9.7 | 0.22 | 1.8 | 0.23 | 1.9 | 0.24 | 0.51 | 4.2 | – | 0.45 |
5. Discussion
We have observed a lack of evidence for rotation in the form of tilted emission lines in elongated galaxies at , in spite of the fact that our spectroscopic slit was nearly aligned with the galaxies’ major axes in 11 out of 13 cases. The seeing was mediocre during many of our observations, and we show with observations of the same object taken under different conditions and with artificially smoothed data that this can affect the observed velocity shear at a given radius by as much as a factor of two. Accounting for the effects of the seeing, we believe that all 13 of the galaxies in the present sample have km s; 11 of them show no evidence of rotation at all. By we mean half of the peak-to-peak velocity amplitude measured in an exposure of 1 hour under good seeing conditions (5); unlike the terminal velocities of rotation curves of local galaxies, this is not a fundamental quantity, and it likely underestimates the true velocity. This observed lack of rotation is perhaps surprising; rotational velocities of a few hundred km s are predicted for models of star-forming galaxies at –3 (Mo, Mao, & White 1998, 1999), and we know that galaxies with km s are present among the still relatively small sample with rest-frame optical emission line spectra at these redshifts (Lemoine-Busserolle et al. 2003; Erb et al. 2003).
How, then, are we to interpret the lack of observed rotation in galaxies with slits aligned with their apparent major axes? The kinematic measurements indicate that most of the galaxies are not disks with irregular morphologies due to knotty star formation. In fact we find that the alignment of the slit with a galaxy’s major axis has little effect on whether or not a tilted emission line is observed. Of our total sample of 29 galaxies (the 13 presented here and the 16 in Erb et al. 2003), 12 had slits aligned with their major axes and 17 did not. We see tilted emission lines in 25% of the aligned galaxies and 29% of the unaligned galaxies; it seems that we are slightly more likely to observe a tilted line by choosing a random position angle, although this is hardly a robust result given the small numbers involved and the effect of the seeing on the detectability of velocity shear.
Given these results, we should consider the possibility that the tilted emission lines, when observed, may not always be due to rotation. Two or more merging clumps of material with relative velocities of km s, blurred by the seeing, could produce an extended, tilted emission line. Such a scenario fits naturally within the context of hierarchical structure formation, and has been used to explain the profiles of damped absorption systems at high redshift (Haehnelt, Steinmetz, & Rauch 1998). In this model the measured velocity would depend on the orientation of the merging clumps, and projection effects would be difficult to quantify. This is not meant to be an exclusive explanation for the origin of the tilted lines; rotation could certainly still be a factor as well, especially in the case of objects such as Q1700-BX691 that show a regular pattern of high velocity shear over a large spatial area.
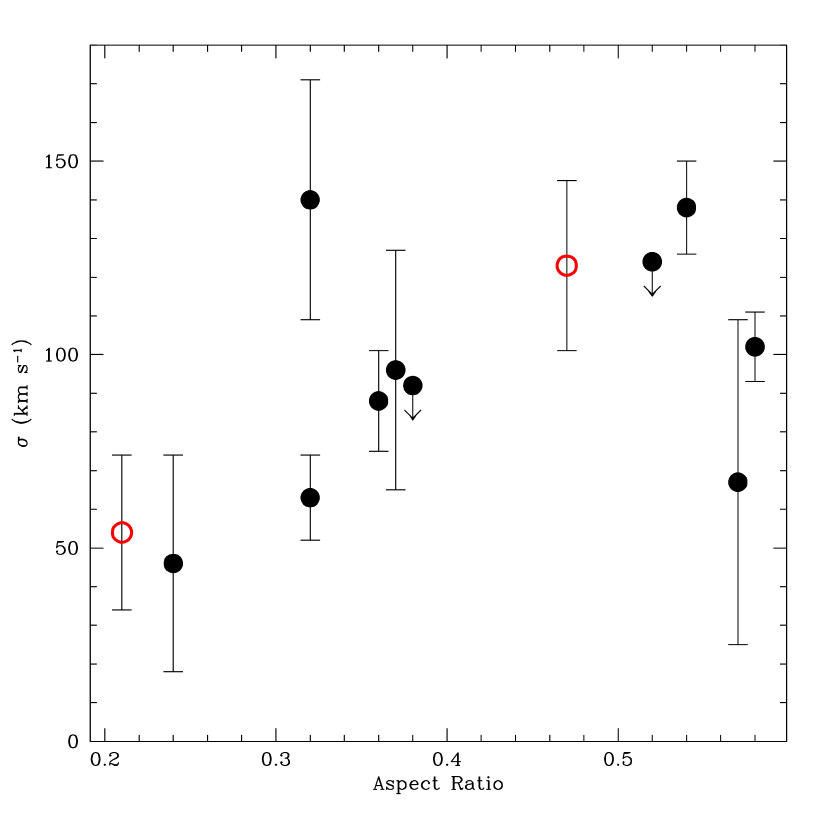
The uncertain causes and unreliable velocities of the tilted lines make inferences from this type of kinematic measurement difficult, and it therefore makes sense to focus our attention on what can be learned from the one-dimensional measurements, which are relatively unaffected by the seeing. In our simulations at least 80% of the velocity width was retained after smoothing in all except one case; after the smoothing, the exception had S/N lower than than of any object in the current sample. We have therefore compared the velocity dispersions of the sample with their morphologies; we see some evidence that the more elongated galaxies may have smaller velocity dispersions than the sample as a whole. Considering only those galaxies which we selected because they appeared elongated (i.e. neglecting BX305, BX1085, BX1086 and BX1368), we find a mean velocity dispersion of 80 km s, with an error in the mean of 9 km s. We compare this with the mean velocity dispersion of the remaining 54 galaxies at for which we have measurements (these data will be discussed in full elsewhere), km s; the difference in the means is more than 3. Using a K-S test, we find that the probability that the two samples are drawn from the same population is 0.04. To investigate this further we plot in Figure 5 the aspect ratio against the velocity dispersion . There is mild evidence for a correlation, in the sense that the more symmetric galaxies also have larger velocity dispersions; with a Spearman rank-order correlation test we find that the probability of observing these data if there is no correlation is 0.13.
These nine galaxies have , with an error in the mean of 0.04. We compare this with the 90 other galaxies we have identified at in the GOODS-N field. These have , with an error in the mean of 0.02; the difference in the means is , showing that this subsample is significantly more elongated than one made up of galaxies chosen at random. We have also calculated the mean (as determined from the colors, assuming a star formation age of yrs and a Salpeter IMF) of the elongated sample, (we again quote the mean and the error in the mean). As above we compare this with the remaining galaxies with in the GOODS-N field, which have , and find that the elongated galaxies have a lower by 2. These nine galaxies are also somewhat brighter than the sample as a whole, with as compared to 333Because our only photometry is in the rest-frame UV, we defer the calculation of absolute magnitudes until we have obtained rest-frame optical photometry.; we see no correlation between magnitude and , however. Both the decreased reddening and the lower velocity dispersions are the opposite of what one would expect if these galaxies were highly inclined disks: increasing the inclination of a disk also makes it appear redder, and the alignment of the slit and the major axis should maximize the observed velocity.
We have seen that elongated galaxies sometimes, but not always, show evidence for velocity shear along their major axes, and that clumpy galaxies that appear merger-like sometimes, but not always, show evidence of shear as well. We also see shear in galaxies of unknown morphology with the slit misaligned by an unknown amount. The situation is clearly complicated, and it is unlikely that a single model will explain all of these results; some combination of rotation and merging seems to be the most likely answer. It will be challenging to distinguish between these possibilities with the type of measurements presented here, however. Even under ideal conditions, the blurring of the seeing makes it difficult to discriminate between rotation and merging. Evidence for rotation could be found in deeper observations if the velocity curves are seen to flatten like the rotation curves of local galaxies, and more detailed morphological analysis may help pick out galaxies that are likely to be mergers. The best way to distinguish between the proposed scenarios, however, would be to obtain spectroscopic observations of an entire galaxy at high spatial resolution, and we look forward to observations of objects such as these with the new generation of near-IR integral field spectrographs with adaptive optics.
References
- Adelberger et al. (2004) Adelberger, K. L., Steidel, C. C., Shapley, A. E., Hunt, M. P., Erb, D. K., Reddy, N. A., & Pettini, M. 2004, ApJ, in press (astro-ph/0401445)
- Böhm et al. (2003) Böhm, A., et al. 2003, A&A, in press (astro-ph/0309263)
- Calzetti et al. (2004) Calzetti, D., et al. 2004, AJ, in press (astro-ph/0312385)
- Chapman et al. (2003) Chapman, S. C., Blain, A. W., Ivison, R. J., & Smail , I. 2003, Nature, 422, 695
- Conselice et al. (2003) Conselice, C. J., et al. 2003, ApJ, 600, L139
- Dickinson et al. (2003) Dickinson, M., Papovich, C., Ferguson, H. C., & Budavári, T. 2003, ApJ, 587, 25
- Erb et al. (2003) Erb, D. K., Shapley, A. E., Steidel, C. C., Pettini, M., Adelberger, K. L., Hunt, M. P., Moorwood, A. F. M., & Cuby, J. 2003, ApJ, 591, 101
- Fan et al. (2001) Fan, X., et al. 2001, AJ, 121, 54
- Giavalisco & GOODS Team (2003) Giavalisco, M. & GOODS Team. 2003, ApJ, astro-ph/0309105
- Giavalisco et al. (1996) Giavalisco, M., Steidel, C. C., & Macchetto, F. D. 1996, ApJ, 470, 189
- Haehnelt et al. (1998) Haehnelt, M. G., Steinmetz, M., & Rauch, M. 1998, ApJ, 495, 647
- Heckman et al. (1990) Heckman, T. M., Armus, L., & Miley, G. K. 1990, ApJS, 74, 833
- Kobulnicky & Gebhardt (2000) Kobulnicky, H. A. & Gebhardt, K. 2000, AJ, 119, 1608
- Lemoine-Busserolle et al. (2003) Lemoine-Busserolle, M., Contini, T., Pelló, R., Le Borgne, J.-F., Kneib, J.-P., & Lidman, C. 2003, A&A, 397, 839
- McLean et al. (1998) McLean, I. S., et al. 1998, in Proc. SPIE Vol. 3354, p. 566-578, Infrared Astronomical Instrum entation, Albert M. Fowler; Ed., Vol. 3354, 566–578
- Metevier et al. (2004) Metevier, A. J., Koo, D. C., Simard, L., & Phillips, A. C. 2004, ApJ, submitted
- Mo et al. (1998) Mo, H. J., Mao, S., & White, S. D. M. 1998, MNRAS, 295, 319
- Mo et al. (1999) —. 1999, MNRAS, 304, 175
- Moorwood et al. (2003) Moorwood, A. F. M., van der Werf, P. P., Cuby, J. G., & Oliva, E. 2003, Proceedings of the Workshop on The Mass of Galaxies at Low and High Redshift, eds. R. Bender and A. Renzini, Springer-Verlag, p. 302
- Pettini et al. (2001) Pettini, M., Shapley, A. E., Steidel, C. C., Cuby, J., Dickinson, M., Moorwood, A. F. M., Adelberger, K. L., & Giavalisco, M. 2001, ApJ, 554, 981
- Shapley et al. (2001) Shapley, A. E., Steidel, C. C., Adelberger, K. L., Dickinson, M., Giavalisco, M., & Pettini, M. 2001, ApJ, 562, 95
- Shapley et al. (2003) Shapley, A. E., Steidel, C. C., Pettini, M., & Adelberger, K. L. 2003, ApJ, 588, 65
- Simard & Pritchet (1998) Simard, L. & Pritchet, C. J. 1998, ApJ, 505, 96
- Simard & Pritchet (1999) —. 1999, PASP, 111, 453
- Steidel et al. (2004) Steidel, C. C., Shapley, A. E., Pettini, M., Adelberger, K. L., Erb, D. K., Reddy, N. R., & Hunt, M. P. 2004, ApJ, in press (astro-ph/0401439)
- van den Bergh (2001) van den Bergh, S. 2001, AJ, 122, 621
- Vogt et al. (1996) Vogt, N. P., Forbes, D. A., Phillips, A. C., Gronwall, C., Faber, S. M., Illingworth, G. D., & Koo, D. C. 1996, ApJ, 465, L15
- Vogt et al. (1997) Vogt, N. P., et al. 1997, ApJ, 479, L121
- Weatherley & Warren (2003) Weatherley, S. J. & Warren, S. J. 2003, MNRAS, 345, L29