XMM-Newton observations of the Ori cluster.
I. The complex RGS spectrum of the hot star Ori AB
We present XMM-Newton observations of the young ( Myr) cluster around the hot (O9.5V) star Orionis AB, aimed at obtaining a high resolution RGS spectrum of the hot star as well as EPIC imaging data for the whole field. We show that the RGS spectrum of Ori AB may be contaminated by weaker nearby sources which required the development of a suitable procedure to extract a clean RGS spectrum and to determine the thermal structure and wind properties of the hot star. We also report on the detection of a flare from the B2Vp star Ori E and we discuss whether the flare originated from the hot star itself or rather from an unseen late-type companion. Other results of this observation include: the detection of 174 X-ray sources in the field of Ori of which 75 identified as cluster members, including very low-mass stars down to the substellar limit; the discovery of rotational modulation in a late-type star near Ori AB; no detectable line broadenings and shifts ( km s-1) in the spectrum of Ori AB together with a remarkable low value of the O vii forbidden to intercombination line ratio and unusually high coronal abundances of CNO elements.
Key Words.:
stars: coronae – stars: winds – stars: individual: Ori – stars: early-type – stars: late-type1 Introduction
The Ori cluster, discovered by ROSAT (Wolk 1996; Walter et al. 1997) around the O9.5V star Ori AB, belongs to the OB1b association and is located at a distance of pc (from Hipparcos, ESA 1997). In addition to several hot stars, it is known to contain likely pre-main sequence late-type stars within of Ori, as well as some brown dwarfs and planetary-mass objects (Béjar et al. 1999; Zapaterio Osorio et al. 2000; Béjar et al. 2001). The estimated age of the cluster is Myr.
We have obtained an XMM-Newton observation of the Ori cluster, centered on the hot star Ori AB, with the purpose of obtaining: i) a high-resolution RGS spectrum of the central source; ii) imaging data as well as low-resolution spectra over the whole field, including both a few early-type stars and a large number of late-type stars down to the substellar limit. Given the high sensitivity of XMM-Newton, and the good combination of low- and high-resolution spectroscopic instruments on board, these observations were expected to shed light on the coronal and/or wind properties of stars in a very young cluster.
X-ray emission from O and B stars is usually explained with the presence of winds. X-ray observations of the hot stars Pup (O4If) and Ori (O9Ib) have shown the presence of such winds, with velocity widths of the order of km s-1 and blueshifted centroids (Waldron & Cassinelli 2001; Cassinelli et al. 2001; Kahn et al. 2001). However, some conflicting results have also been found, like high-densities close to the stellar surface in Ori (Waldron & Cassinelli 2001), where the velocity is too small to produce the shocks required for the X-ray emission, or a temperature structure in the Orion Trapezium hot stars that is similar to that of cool active stars, where the emission originates from magnetically confined coronal structures (Schulz et al. 2003). This has raised the question of whether coronal loops might be present in some hot stars partially contributing to their X-ray emission. High-resolution spectroscopic observations of the hot star Ori with XMM-Newton can clarify some of these issues.
As it will be described below, there are several X-ray sources, both hot and cool stars, in our XMM-Newton field close enough to the central source to potentially contaminate its high-resolution RGS spectrum. Although their X-ray intensity lies well below the level of Ori AB, they produce lines that can contribute significantly at certain wavelengths. These lines are shifted in wavelength with respect to those emitted by Ori AB, because of the different locations of these sources within the RGS field of view (FOV). These spurious lines must be identified in order to correctly analyze the spectrum of the central source. To this aim, the capability of XMM-Newton of obtaining simultaneous high-resolution spectra of the central source with RGS and low-resolution spectra of the other sources in the field with EPIC is of great advantage. By using the information derived from the EPIC spectra, it is possible in fact to model the expected contributions of nearby sources to the RGS spectra. This, together with the wavelengths shifts in the RGS spectra caused by the different offsets of the sources in the RGS FOV, allows an accurate correction of the Ori AB spectrum for the contribution of nearby sources.
This paper is organized as follows. In Sect. 2 we present the analysis of the XMM-Newton observation, discussing first the imaging data obtained with the EPIC PN and MOS detectors, and then the high-resolution spectroscopic data obtained with the RGS. Since the observed RGS spectra of the central source might in principle be contaminated by up to three nearby sources in addition to Ori AB itself, we present in this section light curves and low-resolution EPIC spectra of these four sources, showing that one of them (the hot star Ori E) is undergoing a flaring episode, another one (a K star) is showing evidence of rotational modulation, while Ori AB and the fourth source (another K star) are either quiescent or of low variability. With regard to the EPIC spectra also presented in this section, Ori AB appears much softer than the other three sources, consistently with typical X-ray spectra of hot stars. In Sect. 3, we present the results of our analysis, first for Ori AB and then for the flare on Ori E. In particular, we derive, for the former star, the “cleaned” differential emission measure distribution, and we put constraints on wind velocities and shifts, chemical abundances and densities. For Ori E we discuss the flare properties and we present evidence for circumstellar absorption. In Sect. 4, we discuss the implication of our results, both for current models of shocked winds in early-type stars (as in Ori AB), and for the possible occurence of flares in hot stars (as opposite to flares originating from unseen late-type companions). Finally in Sect. 5 we summarize our conclusions.
2 Observations
XMM-Newton observations of the Ori cluster, centered on the hot star Ori AB, were carried out as part of the Guaranteed Time of one of us (R.P.) from 21:47 UT on March 23, 2002 to 9:58 UT on March 24, 2002 (obs. ID 0101440301), for a total duration of 43 ks. We used both the EPIC (European Photon Imaging Camera, Turner et al. 2001; Strüder et al. 2001) instrument with PN and MOS detectors (sensitive to the spectral range 0.15–15 keV and 0.2–10 keV, respectively) and the RGS (Reflection Grating Spectrometer, den Herder et al. 2001) instrument (sensitive to the range Å). This allowed us to obtain simultaneously low-resolution CCD spectra ( eV at keV) of the brightest sources in the field, and high-resolution grating spectra () of Ori AB. The EPIC cameras were operated in Full Frame mode using the thick filter. Data analysis was carried out using the standard tasks in SAS v.5.4.1
2.1 EPIC observations of the Ori field
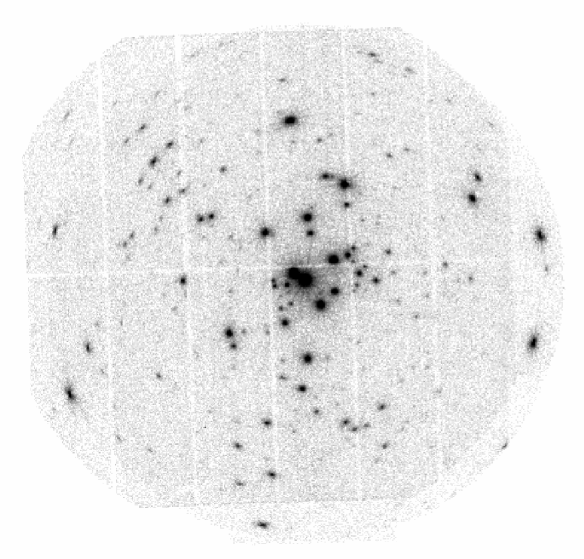
EPIC calibrated and cleaned event files were derived from the raw data using the standard pipeline tasks emchain and epchain and then applying the appropriate filters to eliminate noise and bad events. The event files have also been time filtered in order to exclude a few short periods of high background due to proton flares; the final effective exposure time is 41 ks for each MOS and 36 ks for the PN. The combined EPIC (MOS1+MOS2+PN) image in the keV energy band is shown in Fig. 1.
Source detection was performed both on the individual datasets and on the merged MOS1+MOS2+PN dataset using the Wavelet Detection algorithm developed at the Osservatorio Astronomico di Palermo (Damiani et al. 1997, Damiani et al., in preparation). For the detection on the summed dataset, a combined exposure map has been computed by summing the individual exposure maps with an appropriate scaling factor for PN, derived from the median ratio of PN to MOS count rates, in order to take into account the different sensitivities of MOS and PN. For our observation the median PN/MOS ratio is , resulting in a MOS equivalent exposure time of ks for the merged dataset. We detected a total of 174 sources above a significance threshold of . We have identified 75 sources with at least one possible cluster member or candidate within of the X-ray position. Of the detected members, 5 are early-type stars, including Ori AB and E, while 7 sources have been identified with very low-mass stars of spectral type later than M5. Among the latter ones is SOri 68, a planetary-mass object of spectral type L5.0 (Béjar et al. 2001) and the candidate brown dwarf SOri 25, which has a spectral type M6.5 and an estimated mass of (Béjar et al. 1999).
A more detailed analysis of the full EPIC field will be presented in a companion paper (Franciosini et al., in preparation). In the following we will concentrate only on the brightest central sources that might contribute significantly to the RGS spectra.
| RAx | DECx | count rate | Opt. ID | offset | Sp. type | |||
|---|---|---|---|---|---|---|---|---|
| (2000) | (cts/ks) | () | ||||||
| 1 | Ori AB | 1.17 | 3.78 | O9.5V | ||||
| 2 | Ori E | 1.08 | 6.70 | B2Vp | ||||
| 3 | GSC 4771-1147 | 0.91 | 12.24 | K5 | ||||
| 4 | r053841-0237 | 0.82 | K3 | |||||
2.2 RGS observations of Ori AB
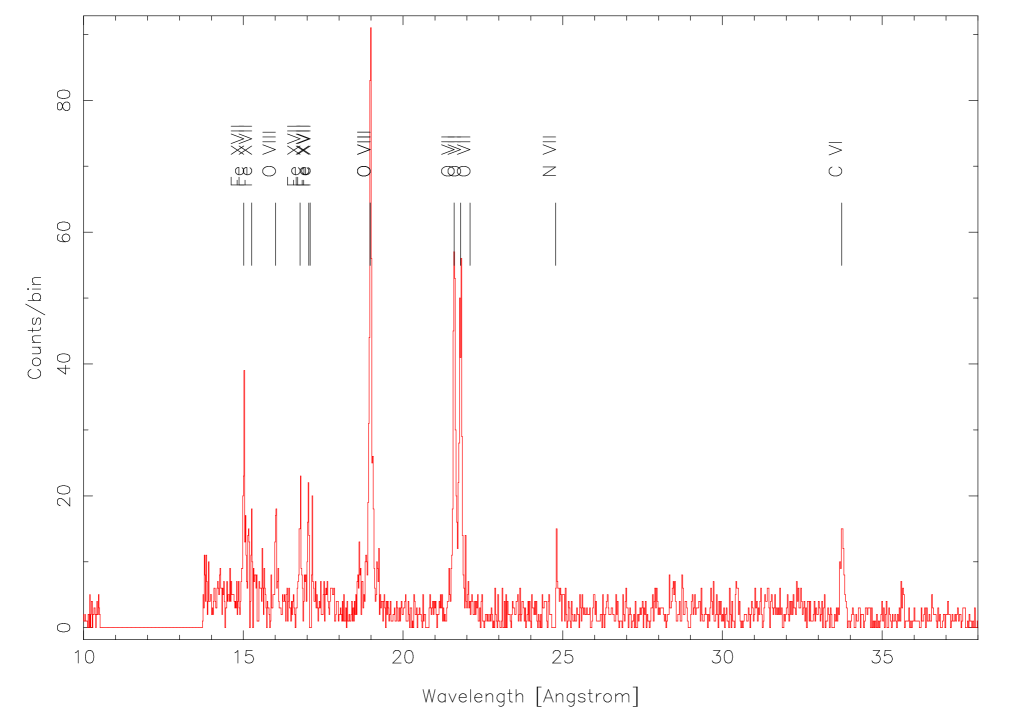
RGS spectra were extracted for the source located at the center of the EPIC field, which coincides with the position of the hot star Ori AB. The extracted RGS1 and RGS2 spectra have an effective exposure time of 42 ks; they are shown in Fig. 2, where we also indicate the identification of the most prominent lines.
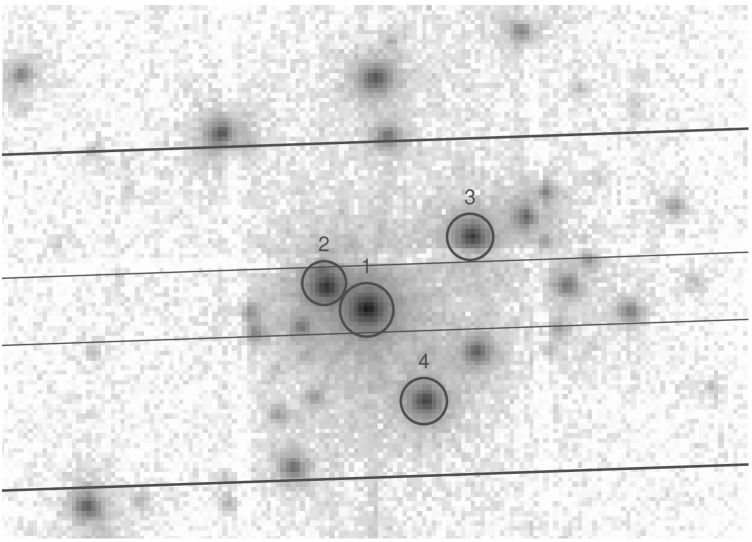
The RGS instrument has a rectangular field of view (FOV), with the longer axis along the dispersion direction and a width of in the cross dispersion direction. The dispersion direction is parallel to the separation of the upper and lower chips in the PN detector, with wavelength increasing towards the left; in our case it is almost aligned along the right ascension coordinate, as indicated in Fig. 3. The figure shows that there are other bright X-ray sources falling in the RGS FOV that might in principle contribute to the observed spectrum of the central source. From their EPIC fluxes, we see that there are 3 sources, listed in Table 1, with fluxes ranging from 24% to 45% of the Ori AB flux, while all other sources in the FOV have fluxes less than 10% of that of Ori AB. However, from the size of the extraction region used to derive the RGS spectrum (indicated by thin lines in Fig. 3), we see that only Ori E should contaminate the spectrum of Ori AB, while sources #3 and especially #4 should not give any significant contribution.
The presence of emission from a source with a certain offset in right ascension with respect to the center of the field produces a shift in the wavelength scale of RGS according to , where is measured in Å, in arcmin, and is the RGS spectral order. Hence, it is important to isolate the contribution of each source to the spectrum, especially considering the fact that intense lines of a secondary source may fall at wavelengths where weak lines of the main source are. The wavelength shifts, due to the different positions of the sources in the RGS FOV, and the knowledge of their low-resolution spectra from EPIC, make it possible to identify the contaminating lines and to estimate their contribution to the RGS spectrum of Ori AB, as we will show in Sect. 3.1.
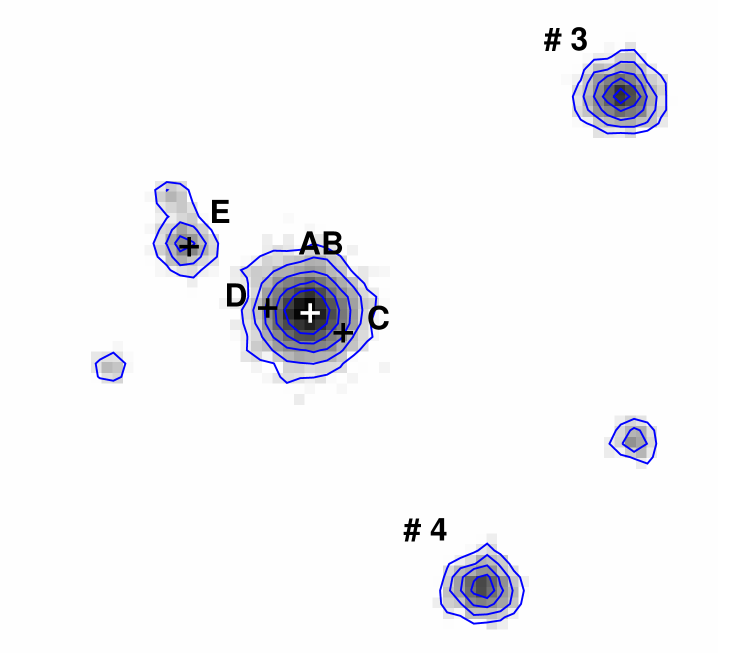
The central source Ori is a remarkable quintuple system. Components A and B are separed by only 0.25 arcsec, and are therefore unresolved. The other 3 components ( Ori C, D and E) are at distances of 11.2, 12.9 and 42 arcsec, respectively: except for Ori E, they cannot be easily resolved from Ori AB with XMM-Newton. In Fig. 4 we show a close-up view of the center of the field in the time interval preceding the Ori E flare (see Sect. 3.2), with the positions of the 5 components marked. The figure clearly shows that the contribution of Ori C and D to the X-ray emission of the central source is negligible (note, for comparison, that the quiescent flux of Ori E is only % of the flux of Ori AB). This conclusion is supported by a higher resolution Chandra observation of the same field by Wolk et al. (2004). At the resolution of Chandra, components C and D are easily resolved from components A and B: however, the Chandra image shows only a very weak X-ray source (% of the Ori AB flux) at the position of Ori D (a B2V star), and no emission at the position of Ori C (a A2V star). The Chandra observation reveals another X-ray source to the NW of Ori AB, which appears to be associated with the IR object Ori IRS1 (van Loon & Oliveira 2003), attributed to emission from a protoplanetary disk. This source cannot be resolved at the lower resolution of XMM-Newton and thus could potentially contaminate both the EPIC and RGS spectra of Ori AB. From the Chandra image, we estimate however that its contribution is % of the flux of Ori AB and is thus negligible.

2.3 EPIC light curves and spectra of the central sources
EPIC PN light curves for the four main sources in the central region of the field were extracted using a circular region of radius , except for Ori E where we have used a radius of to avoid contamination from Ori AB; in the latter case we also excluded a small region around a faint nearby source detected to the north of Ori E (, , see Fig 4). The four light curves, binned over 300 s, are shown in Fig. 5.
As shown by Fig. 5, Ori AB is clearly the dominant source and its emission is steady (the standard deviation around the mean count rate is 1%). The other hot star ( Ori E) shows instead the occurrence of a flare, with a factor of 10 increase in the count rate. The occurrence of a flare in a hot star is at variance with current models of X-ray emission in early-type stars: this, as well as the properties of the flare, will be discussed in Sect. 3.2. The other two sources (#3 and #4) are identified with K-type candidate members of the cluster and their X-ray emission, which shows a quite high level of variability, is likely due to magnetically-confined coronal structures. Particularly interesting is source #4 which shows evidence of rotational modulation, with a period of hours and an amplitude of % (Pallavicini et al. 2004, see their Fig. 3), that can be attributed to the inhomogeneous distribution of active regions over the surface of the star.

| MOS1 | MOS2 | PN | MOS1 | MOS2 | PN | ||
| Ori AB | Ori E | ||||||
| (keV) | |||||||
| (keV) | |||||||
| ( cm-3) | |||||||
| ( cm-3) | |||||||
| O | |||||||
| Ne | |||||||
| Mg | |||||||
| Si | |||||||
| S | |||||||
| Fe | |||||||
| /d.o.f | 1.78/55 | 1.50/56 | 1.15/174 | 0.54/97 | 0.87/104 | 0.67/288 | |
| ( erg cm-2 s-1) | 4.35 | 5.26 | 5.12 | 1.44 | 1.71 | 1.59 | |
| ( erg s-1) | 6.45 | 7.80 | 7.59 | 2.14 | 2.54 | 2.36 | |
| Source 3 | Source 4 | ||||||
| (keV) | |||||||
| (keV) | |||||||
| (cm-3) | |||||||
| (cm-3) | |||||||
| O | |||||||
| Ne | |||||||
| Mg | |||||||
| Si | |||||||
| S | |||||||
| Fe | |||||||
| /d.o.f | 0.69/69 | 0.55/57 | 0.64/202 | 0.61/55 | 0.73/61 | 0.62/191 | |
| ( erg cm-2 s-1) | 9.64 | 9.60 | 8.83 | 6.20 | 7.86 | 7.06 | |
| ( erg s-1) | 1.43 | 1.42 | 1.31 | 0.92 | 1.17 | 1.05 | |
| a: unabsorbed flux and luminosity in the ROSAT ( keV) band. has been computed assuming | |||||||
| pc for all sources. Note that the luminosity of Ori E might be higher by a factor of 3.3 if its | |||||||
| distance is 640 pc, see Sect. 4.2 | |||||||
PN and MOS spectra of these four sources have been extracted from the same regions as the light curves; the background spectrum was extracted from a nearby circular region of radius free from other X-ray sources and on the same CCD chip. Response matrices were generated for each source using the standard SAS tasks. Spectra have been rebinned in order to have at least 30 counts per bin, and were fitted in XSPEC v.11.2.0 in the energy range keV, using a two-temperature APEC v.1.3.0 model with variable element abundances. Since the hydrogen column density is not constrained by the fit, it was kept fixed to the value cm-2, derived from the measured reddening for Ori (Lee 1968; Brown et al. 1994). The spectra of the four sources together with the best-fit models are shown in Fig. 6, and the best-fit parameters are given in Table 2. Abundances are relative to the solar abundances by Anders & Grevesse (1989). Note that the spectral fit for Ori E refers to the whole (quiescent + flare) observation, since we will use it to correct the RGS spectrum obtained from the entire observation.
Fig. 6 clearly shows that Ori AB has a softer spectrum than the other three sources, indicating that it is much cooler than the others, as expected for an early-type star. The fit indicates temperatures of and keV (i.e. and ). The two K stars in the field show instead hard spectra, with temperature components of keV () and keV () that are typical of young active late-type stars. More complex is the case of the B2Vp star Ori E, which is an early-type star but which has also been caught during a flare. Its integrated spectrum is quite hard, and clearly shows the iron complex at 6.7 keV. There is also evidence for an excess emission at keV, likely due to the fluorescence line of Fe i, which is a signature of cool material close to the X-ray source.
3 Results
3.1 The RGS spectrum of Ori AB
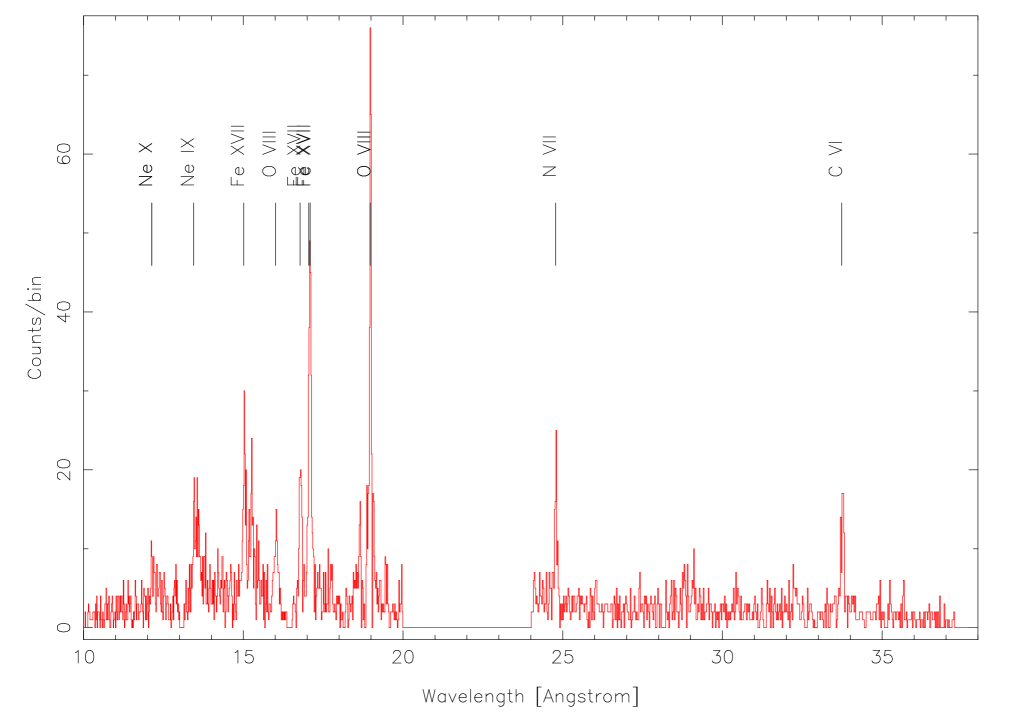
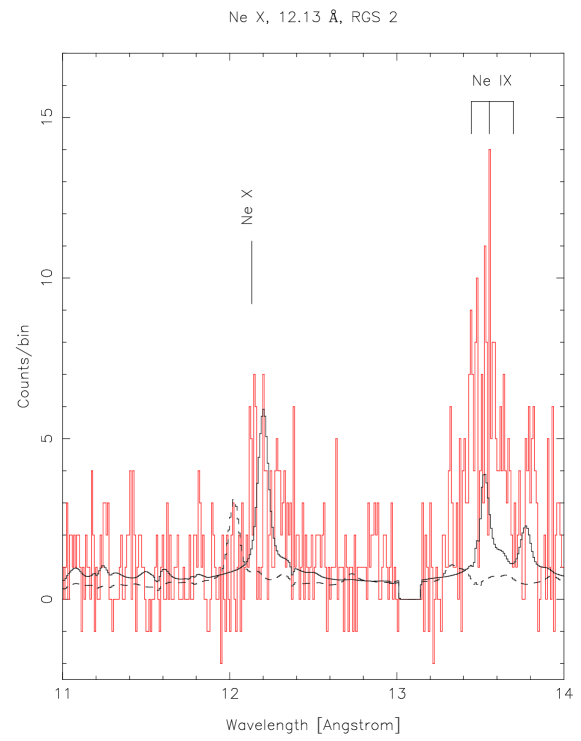
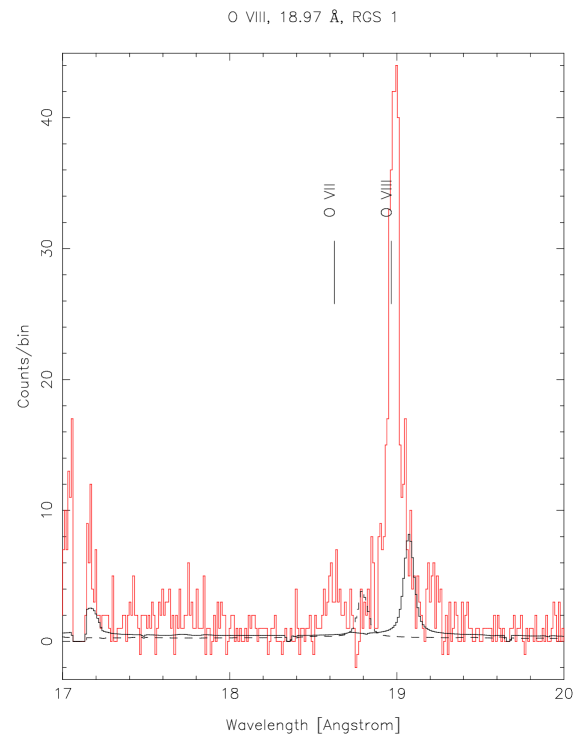
As mentioned in the previous section, the RGS FOV contains other three sources that might contribute to the RGS spectrum of Ori AB. While the contamination from sources #3 and #4 is expected to be negligible, the one from the flaring source Ori E might be quite significant. It is therefore necessary to identify the emission of these sources in the spectrum of the hot star to allow the study of its thermal structure and wind properties. Since we have the EPIC spectra of all the bright sources in the field, we can model their X-ray emission and predict their expected contribution to the RGS spectra, once their emission is shifted according to their angular position in the RGS FOV, as explained above. While the cross-calibration between the EPIC and RGS detectors has still some uncertainties (up to %, Kirsch 2003), such approach can be safely employed to identify the lines of the main source ( Ori AB) that are significantly contaminated by the emission of the other sources, and to estimate the overall effect of the contamination. As shown by Fig. 6 and Table 2, all the secondary sources are hotter than Ori AB, and have a lower count rate. As a consequence, their contribution to the RGS spectrum is limited to the continuum at short wavelengths and to two spectral lines, Ne x 12.1321 and O viii 18.97, as shown in Fig. 7. Moreover, as shown in Fig. 3, the region employed for the extraction of the RGS spectra does not include sources #3 and #4, and therefore their contribution can be neglected, although, as a double check, we also tested the expected position of their lines in the assumption that these two sources were also contaminating the spectrum of the main source. In particular, Fig. 7 shows that the O viii line of the main source is contaminated only to a small extent by Ori E; the Ne x line, however, has a more complicated behaviour, with Ori E providing % of the observed line flux in the spectrum and preventing any possible measure of the Fe xxi line at Å. In the case of sources #3 and #4, even if they were included in the extraction region the contamination would be limited only to the continuum, while no significant contribution is expected in any of the lines (Fig. 7).
| Ion | S/N | ratio | Blends | |||
|---|---|---|---|---|---|---|
| Ne x | 12.1321 | 6.8 | 1.19e-14 | 3.9 | Ne x 12.1321, 12.1375, Fe xvii 12.1240 | |
| No id. | 12.2800 | 1.91e-14 | 5.0 | … | ||
| Ne ix | 13.4473 | 6.6 | 2.71e-14 | 6.0 | 0.35 | Fe xviii 13.3948, Fe xix 13.4620 |
| No id. | 13.4970 | 8.81e-15 | 3.4 | … | ||
| No id. | 13.5180 | 2.12e-14 | 5.4 | … | ||
| Fe xvii | 15.0140 | 6.7 | 8.81e-14 | 16.6 | ||
| O viii | 15.1760 | 6.5 | 2.41e-14 | 8.4 | 0.00 | O viii 15.1765 |
| Fe xvii | 15.2610 | 6.7 | 4.39e-14 | 11.2 | 0.06 | |
| O viii | 16.0055 | 6.5 | 2.66e-14 | 9.2 | Fe xviii 16.0040, O viii 16.0067 | |
| Fe xviii | 16.0710 | 6.8 | 1.81e-14 | 7.7 | 0.18 | Fe xviii 16.0450, 16.1590, Fe xix 16.1100 |
| Fe xvii | 16.7800 | 6.7 | 4.21e-14 | 11.4 | ||
| Fe xvii | 17.0510 | 6.7 | 1.68e-13 | 19.1 | 0.19 | Fe xvii 17.0960 |
| O vii | 18.6270 | 6.3 | 2.35e-14 | 8.7 | 0.02 | |
| O viii | 18.9670 | 6.4 | 2.13e-13 | 25.7 | 0.13 | O viii 18.9725 |
| No id. | 19.2160 | 1.25e-14 | 4.5 | … | ||
| O vii | 21.6015 | 6.3 | 1.55e-13 | 15.4 | ||
| O vii | 21.8036 | 6.3 | 1.61e-13 | 15.6 | 0.20 | |
| No id. | 22.0977 | 2.55e-17 | 0.2 | … | ||
| N vii | 24.7792 | 6.3 | 3.11e-14 | 9.8 | N vii 24.7846 | |
| C vi | 33.7342 | 6.1 | 7.13e-14 | 11.2 | 0.00 | C vi 33.7396 |
a Line fluxes in erg cm-2 s-1
Once the features corresponding to Ori E that contaminate the RGS spectrum of the central star have been identified, we can measure the RGS1 and RGS2 line fluxes using a continuum derived from a global fit to the RGS spectra that accounts for the contributions from the two sources ( Ori AB and Ori E) to first approximation. Measured line fluxes were then corrected for the distance to the star (352 pc) and interstellar absorption, in order to obtain the fluxes emitted from the source (Table 3).

With the measured line fluxes we can determine the thermal structure of the source by calculating the Emission Measure Distribution (EMD) as a function of temperature, defined as [cm-3]. A line-based method has been employed in order to reconstruct the EMD of the source and derive elemental abundances, following the procedure described in Sanz-Forcada et al. (2003). The observed line fluxes, measured in RGS, are compared to the predicted values for a given EMD; discrepancies found in the comparison are reduced by correcting the adopted EMD and the values of the abundances until a satisfactory result is found (i.e. when observed and predicted line fluxes best agree). Since the lines emitted by different elements have contributions that overlap in temperature only partially, some uncertainty exists in the determination of the EMD and abundances in a case like that of Ori AB, where the number of measured spectral lines is small. The derived EMD is given in Fig. 8: it peaks at , close to the results of the global fits to the EPIC spectra.
The abundances derived from the EMD reconstrunction are (in the usual notation) [C/Fe] , [N/Fe] , [O/Fe] , [Ne/Fe] . A value of [Fe/H] (obtained from the EPIC/PN fit of Ori AB), has been adopted in the EMD reconstruction. In the case of C and N it is not possible to obtain reliable results from the EPIC analysis because the lines of these elements are formed below 0.5 keV, a region affected by severe calibration problems. While the Ne abundance is lower than the values obtained with EPIC (Table 2), O seems to be more abundant in the RGS spectrum than in the EPIC spectra. Cross-calibration problems could be responsible for this disagreement, as well as the assumption, in the EPIC fit, that Ori AB is emitting only at two temperatures. The abundances derived from the multi-T model (likely closer to the real plasma temperature structure) used in the RGS analysis should be more reliable than those obtained with EPIC, where the low spectral resolution allows us to apply only a 2-T fit. The results obtained with RGS point towards a clear overabundance of C, N and O with respect to Fe.
We have not detected any substantial blueshifts or Doppler broadenings in the RGS lines, with an upper limit of 800 km s-1. Another interesting feature of the RGS spectra is the observation of the He-like triplets. These triplets, formed by the recombination (), intercombination (), and forbidden () lines, are usually employed in cool stars to derive the electron density in a collisionally excited plasma, since the ratio is a decreasing function of density within a given range of density values (Gabriel & Jordan 1969). However, it is also possible to have a low ratio if a strong UV field is present close to the source emitting the He-like triplets: in hot stars, which are strong UV sources, a low ratio is thus indicative of proximity to the stellar surface rather than of high density (e.g. Cassinelli et al. 2001). In the case of Ori AB we observe the triplets of Ne ix ( Å, Å), formed at and O vii ( Å, Å), formed at . In both cases the forbidden line is very weak if not completely absent (see Figs. 2 and 7). This indicates that the emission originates close to the star, which contradicts the usual assumption of X-ray emission from wind shocks at large distances from the star. We cannot exclude, however, a high density of the emitting region as alternative, since the ratio allows us to put only an uninteresting lower limit to density ( cm-3) when a strong UV radiation field is present. Note that the observed ratio could also be the result of high densities, either close to the star (where the UV radiation field is high), or at larger distances from the star. Hence, we cannot distinguish which of the two mechanisms (UV radiation field, or high densities) is responsible for the observed ratio.
| Interval | /d.o.f. | |||||||||
| (keV) | (keV) | (cm-3) | (cm-3) | (erg cm-2 s-1) | (erg s-1) | (h) | (h) | |||
| quiescent | 1.00/26 | 0.59 | 0.88 | 12.3 | 3.6 | |||||
| peak | 0.68/101 | 3.06 | 4.54 | 15.5 | 1.7 | |||||
| decay | 0.91/129 | 2.64 | 3.91 | 17.5 | 2.5 | |||||
| a: unabsorbed flux and luminosity in the ROSAT ( keV) band. has been computed assuming pc | ||||||||||
| b: central time of the intervals in hours from JD 2452357 | ||||||||||

3.2 The flare on Ori E
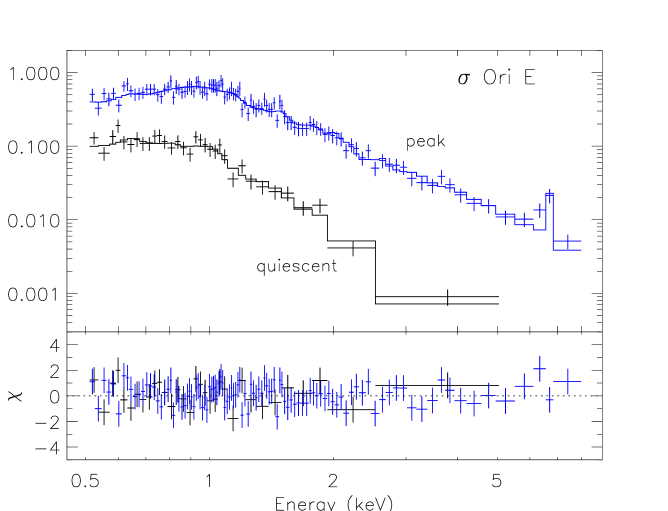
As mentioned in Sect. 2.3, the most striking feature of our observation is the flare observed on the hot star Ori E. The flare lasted for hrs, as estimated by extrapolating the observed decay, with a rise time of hr; the decay phase was observed only for the first 6.7 hr. We have performed time-resolved spectral analysis of both the quiescent emission and the flare at the peak and during the first part of the decay; the chosen intervals are shown in Fig. 5. Given the low number of counts in each interval, we have only fitted the PN spectra using a 2-temperature APEC model with variable global abundance. The best-fit parameters are shown in Table 4. Fig. 9 shows the spectra obtained during quiescence and at the peak of the flare, together with the corresponding best-fit models. The estimated total energy released by the flare is erg.
An interesting feature derived from this analysis is the preflare spectrum of Ori E, which is quite unusual for a hot star and similar to typical spectra of active cool stars (although not as hard as those of sources #3 and #4, cf. Table 2). In fact the source is much hotter than Ori AB, with a comparable amount of material at temperatures of 0.3 and 1.1 keV ( and 7.1). During the flare, the temperature of both components increases significantly (see Fig. 10), with a large increase of the emission measure of the hotter component (). At the peak of the flare the emitting plasma reaches a temperature of 3.5 keV () and there is a significant increase of the abundance, from during quiescence to at the peak of the flare, followed by a decrease during the decay. The temperatures and emission measures do not decrease significantly during the first part of the decay, suggesting the presence of a prolonged heating mechanism. This is consistent with the observed behaviour of the flare light curve, which shows a bump hrs after the peak that might be due to a secondary flaring event.
The EPIC spectrum of Ori E (Figs. 6 and 9) shows another interesting feature, i.e. the presence of excess emission around keV, which can be attributed to the Fe I fluorescence line, indicating the presence of cooler circumstellar material ionized by the flare. Another possible hint of the presence of circumstellar material is given by the dips identified in the light curve at and 17.5 hrs (see Fig. 5), corresponding to a photometric phase (computed according to the ephemeris of Reiners et al. 2000, JD 2442778.819, d). At this phase, Reiners et al. (2000) have found maximum He absorption, which has been attributed to the presence of absorbing circumstellar material along the line of sight. It is therefore possible that these dips are due to absorption of the X-ray emission by this material. However, we cannot exclude that such dips might be simply due to intrinsic variability of the flaring emission. The current uncertainties on the EPIC calibration at low energies does not allow us to obtain accurate fits below 0.5 keV: we are therefore unable to determine from the spectral fits a reliable value for the column density, and therefore to detect possible changes in the amount of absorbing material towards Ori E during the flare.
4 Discussion
The interpretation of the X-ray emission of hot stars has been changing in the past few years as a consequence of new high-spectral resolution data obtained with Chandra and XMM-Newton. It has been traditionally believed that X-ray emission in these stars arises from shock heating in their radiationally-driven massive winds which are unstable and form high density blobs on which the high-velocity winds shock. The presence of winds is clearly seen in the high-resolution spectra of the few cases studied so far (e.g. Waldron & Cassinelli 2001; Cassinelli et al. 2001; Kahn et al. 2001; Schulz et al. 2003), but the behavior of the He-like triplets in some of these sources indicates that at least part of the emission must originate from a distance too close to the star to be compatible to wind shocks (e.g. Waldron & Cassinelli 2001). An alternative explanation of the observed behavior of the He-like triplets, however, is the presence of high electron densities that could result from magnetically confined structures, giving similar ratios in the He-like triplets as for the case in which the UV radiation field is high, i.e., close to the stellar surface. Equally intriguiging for our understanding of X-ray emission from hot stars is the detection reported here and by Groote & Schmitt (2004, from ROSAT observations) of a flare from Ori E, which is a peculiar hot star, with the reported presence of strong magnetic fields of kG at photospheric level (Landstreet & Borra 1978). In discussing the data that we have collected with XMM-Newton, we will treat separately the case of Ori AB, for which high resolution spectra are available, from that of Ori E, which, besides the strong flare, also shows an unusually hard (for a hot star) quiescent EPIC spectrum.
4.1 Ori AB
The RGS spectrum of Ori AB shows several intriguing features. The He-like triplets of O and Ne indicate either the presence of high densities (implying magnetic confinement at small or large distances from the star) or a strong UV radiation field (implying proximity of the emitting material to the stellar surface where the winds, however, have not been accelerated enough to form strong shocks). Moreover, the X-ray spectrum reveals no signs of strong winds ( km s-1), but the observed has a typical value for hot stars (cf. Pallavicini et al. 1981). It is not likely that a cool low-mass companion may be responsible for this emission, since a young active cool star with such a high would also have a much hotter X-ray spectrum than observed (cf. the case of Ori E below).
The radiation pressure in a O9.5 dwarf star, such as Ori AB, is expected to be lower than in the case of hot giants and supergiants, or of hotter stars, but it should be strong enough to prevent the formation of coronal loops close to the star. Therefore, it is necessary to have either a very strong magnetic field that confines a small amount of coronal material close to the star (where the UV radiation field is high enough to cause the observed low value of the He-like ratio), or some magnetic confinement causing high densities must occur at larger distances from the star, where the UV radiation field is too weak to justify the observed He-like ratios. Interactions with circumstellar material, or within the circumstellar material itself, might play a role in this context, as suggested by the analogy with what is observed in some cases for PMS low-mass stars and their circumstellar disks.
X-ray observations of cool young stars have shown in fact an interesting difference between the Classical T Tauri Stars, CTTS, (that still possess a disk of circumstellar material), and Weak-lined T Tauri Stars, WTTS, (with no disk around the star). While WTTS have an X-ray emission that is typical of active cool stars, with high densities ( cm-3) at temperatures of MK, but lower densities ( cm-3) at MK (e.g., AB Dor, Sanz-Forcada et al. 2003), the only case of a CTTS studied so far at high resolution, TW Hya (Kastner et al. 2002), shows high densities at MK ( cm-3), while keeping the similarity with WTTS for the rest of its coronal emission. This different behaviour led to the conclusion that interaction with the disk, possibly though accretion, may play an important role in the X-ray emission of CTTS. An interesting question is whether a similar mechanism might also be relevant for hot stars. At this stage, this suggestion remains only speculative, but could resolve some of the conflicting results emerging from the observations of Ori AB and of other hot stars.
We have found in Ori AB higher abundances of C, N and O with respect to Fe than in the Sun, which could be indicative of processed material from the interior of the star. This is difficult to understand in a young unevolved main-sequence star. A crucial question is whether these anomalously high CNO abundances agree or not with the photospheric abundances. No accurate measurements of the photospheric abundances of this star have been reported to our knowledge.
Finally, as mentioned above, what we have called Ori AB in this paper is actually a quite complex system, only partially resolved by our XMM-Newton observations (and better resolved, but not completely, by Chandra). The primary source is itself a close binary, with components of similar spectral type. Other two components of the same system ( Ori C and D) are unresolved at our resolution: from our data (Fig. 4), and from the Chandra observation, they seem to contribute little to the total observed X-ray emission, but they might contribute to the circumstellar material and, possibly, to the magnetic field configuration of the whole region. Moreover, there is another X-ray and IR source, the protoplanetary disk Ori IRS1 mentioned above, unresolved at our resolution, that further complicates the picture. Observations of other hot stars at high resolution, including both giants and main-sequence stars, are clearly required to clarify the mechanisms of X-ray emission in early-type stars.
4.2 Ori E
The presence of a flare in Ori E challenges, if it originated in the hot star itself, the theories that interpret the X-ray emission of early-type stars as due to wind shocks, assuming that no stellar corona can be present. Stellar flares are produced by magnetic reconnection where magnetic energy is converted into plasma heating, radiative losses and mass motions. Flares are common among active stars, and especially among Young Stellar Objects (YSO) and T Tauri stars (TTS) that possess a high rotation rate. These stars have typical X-ray luminosities that can be a factor higher than that of the Sun and produce flares that are orders of magnitude stronger than solar flares. The possibility that the observed flare on Ori E, and part of its quiescent emission, were due to an optically unconspicous low-mass companion (of spectral type K or M) cannot be excluded. On the other hand, Ori E is known to be a magnetic star, with a global magnetic field of kG (Landstreet & Borra 1978), so the interpretation of this observation is far from being straightforward.
Early-type stars follow the relationship (Pallavicini et al. 1981). However, in the case of our observation, the quiescent emission of Ori E ( erg s-1) results in a (using bolometric corrections by Flower 1996), more than an order of magnitude higher than expected. If we consider that an active young star like AB Dor (K2V) has an average quiescent emission of erg s-1 (cf. Sanz-Forcada et al. 2003), part of the observed quiescent X-ray emission of Ori E might indeed arise from a young late-type companion. On the other hand, the peak flare luminosity ( erg s-1) is consistent with that of large flares in young active stars.
A late-type companion (later than K0) would be consistent with the observed colors of Ori E (, , , after correcting for interstellar absorption). A K0 star of age Myr has in fact , (Siess et al. 2000) while a typical B2V star has and (Cox 2000). If Ori E has a K0 companion, having at the cluster distance (Siess et al. 2000), the inferred magnitudes for the B2V and the K0 star would be, respectively, 7.2 and 8.7, with a summed magnitude ; similarly, in the J band the summed magnitude would be . Therefore, the observed IR colors are consistent with a companion of spectral type later than K0. Moreover, the expected bolometric luminosity of the companion would be such that , consistent with that of an active star close to saturation.
Groote & Schmitt (2004) recently reported the detection of a flare from Ori E with ROSAT, and attributed it to Ori E itself, rather than to a low-mass companion. The authors argue that the star does not belong to the Ori cluster, but it is a background object at a distance of 640 pc (Hunger et al. 1989), rather than the pc of the cluster. This would increase the quiescent X-ray luminosity of the star, and the total energy of the flare, by a factor of , but it would not change the essential point that any late-type companion of Ori E must be itself a very young object, whether the star belongs or not to the cluster. They also argue that no changes in the radial velocity of the primary star have been detected with a velocity of less than km s-1 (Groote & Hunger 1977), as expected from a low-mass companion. Finally, Groote & Schmitt (2004) state that the UV to IR fluxes of the star agree well with those expected from Ori E alone. These arguments can be answered as follows: (i) the method employed by Hunger et al. (1989) to derive the stellar distance is based on a complex analysis of the optical spectrum of the star, which can be affected by several uncertainties related to the models used to interpret the spectra. Moreover, as mentioned above, Ori E, because of its spectral type, is certainly a young star, whether or not it belongs to the cluster, and the same must be true for any late-type companion physically related to it (we exclude the unlikely circumstance that the hot star and its hypothetical late-type companion are the result of a chance alignement). (ii) The high precision ( km s-1) quoted by Groote & Hunger (1977) for the measurement of radial velocity variations in Ori E is quite remarkable considering its high projected rotational velocity ( km s-1) and the instrumentation typically employed in these measurements. A more realistic value of at least 10 km s-1 accuracy would be enough to miss the detection of a companion of orbiting around a star with (expected for a B2V star). (iii) The IR colors of Ori E are compatible with the presence of a low-mass companion, as explained above. Besides, the presence of a low-mass star in the optical spectrum of an early-type star would be virtually undetectable, especially if the late-type star has a high rotational velocity and some circumstellar material.
The X-ray spectra of Ori E obtained by us with XMM-Newton provide additional arguments in favour of the presence of an unseen late-type companion. The observed EPIC spectra (see Fig. 9) indicate, even during the pre-flare quiescent phase, a quite hard emission, similar to that of cool active stars, such as AB Dor or the sources #3 and #4 in the same XMM/EPIC field, but quite different from the soft spectrum of Ori AB (see Fig. 6). The metal abundance during quiescence is very low, , similar to what is commonly found in active stellar coronae. During the flare a significant increase of the metal abundance, by a factor of , is observed at the peak, similarly to what is observed in several flares on active late-type stars (e.g. Favata & Schmitt 1999; Güdel et al. 2001).
The observation of the fluorescence Fe i line emission in the flaring spectrum suggests the presence of circumstellar material around the flaring source. This circumstellar material would block part of the emission of a late-type companion in the optical range, making its detection even more difficult.
Despite all these arguments, that lead us to postulate the presence of an unseen active late-type companion, an origin of the flare from the hot star itself cannot be excluded. Flares in hot stars have been reported for the B2e star Eri (Smith et al. 1993) and the Herbig Be star MWC 297 (Hamaguchi et al. 2000), in addition to the flare reported by Groote & Schmitt (2004) in Ori E. It is not easy to explain the flaring emission with the usual magnetic reconnection in coronal loops (which are not expected to be present in early-type stars), but alternative scenarios of magnetic reconnection can be considered that include interactions between the star and circumstellar material and/or with stellar disks, as it has been proposed for classical T Tauri stars and other YSOs (Kastner et al. 2002). For the flare reported here, there is a remarkable coincidence between the photometric phase when maximum He absorption is observed (Reiners et al. 2000) and the presence of two dips in the X-ray light curve of the flare that might be interpreted as absorption features. If we assume that the flare originated in Ori E itself, the flaring source should be situated between the stellar surface and the circumstellar material in order to produce the absorption features observed in the flare decay. This is in contradiction with the hypothesis of a flare arising from the outer magnetosphere as has been suggested by Groote & Schmitt (2004).
5 Conclusions
We have analysed an XMM-Newton observation of the Ori cluster centered on the hot star Ori AB. Our results can be summarised as follows:
-
1.
we have detected 174 X-ray sources in the Ori field (above a significance threshold of ) of which 75 are identified as possible cluster members;
-
2.
we have detected 5 early-type members of the cluster as well as many late-type stars down to the substellar limit;
-
3.
we have discovered rotational modulation due to surface activity in a K-type star of the cluster (source #4);
-
4.
we have detected both quiescent and flaring emission from the B2Vp star Ori E and we have found that the quiescent emission has an EPIC spectrum unusually hard for a hot star;
-
5.
we have argued that the X-ray flare on Ori E, as well as most of the quiescent emission from the star, originated from an unseen young late-type companion, rather than from the hot star itself;
-
6.
we have obtained a high-resolution RGS spectrum of the central object Ori AB and we have been able to separate the emission of the central star from the contributions of nearby sources;
-
7.
we have found that the emission of Ori AB is steady (at a level %) and much softer than the one associated with the other sources, consistently with a wind origin;
-
8.
we have found, however, no evidence (with an upper limit of km s-1) for line broadenings and shifts as could be produced by strong winds;
-
9.
we have found a very low value of the O vii forbidden to intercombination line ratio in the hot star which is at variance with current models of shock heating in stellar winds far from the star;
-
10.
finally, we have found higher abundances of CNO elements with respect to Fe in the wind of Ori AB that are difficult to understand in a young unevolved star.
A complete census of all X-ray sources detected in this observation and belonging to the cluster will appear in a companion paper currently in preparation.
Acknowledgements.
JSF acknowledges support by the Marie Curie Fellowships Contract No. HPMD-CT-2000-00013. EF and RP acknowledge partial support from the Italian Space Agency (ASI) for data analysis. This research has made use of NASA’s Astrophysics Data System Abstract Service.References
- Anders & Grevesse (1989) Anders, E. & Grevesse, N. 1989, Geochim. Cosmochim. Acta., 53, 197
- Béjar et al. (2001) Béjar, V. J. S., Martín, E. L., Zapaterio Osorio, M. R., et al. 2001, ApJ, 556, 830
- Béjar et al. (1999) Béjar, V. J. S., Zapaterio Osorio, M. R., & Rebolo, R. 1999, ApJ, 521, 671
- Brown et al. (1994) Brown, A. G. A., de Geus, E. J., & de Zeeuw, P. T. 1994, A&A, 289, 101
- Cassinelli et al. (2001) Cassinelli, J. P., Miller, N. A., Waldron, W. L., MacFarlane, J. J., & Cohen, D. H. 2001, ApJ, 554, L55
- Cox (2000) Cox, A. N. 2000, Allen’s Astrophysical Quantities, 4th ed. (New York: Springer)
- Damiani et al. (1997) Damiani, F., Maggio, A., Micela, G., & Sciortino, S. 1997, ApJ, 483, 350
- den Herder et al. (2001) den Herder, J. W., Brinkman, A. C., Kahn, S. M., et al. 2001, A&A, 365, L7
- ESA (1997) ESA. 1997, The Hipparcos and Tycho Catalogues, ESA SP-1200
- Favata & Schmitt (1999) Favata, F. & Schmitt, J. H. M. M. 1999, A&A, 350, 900
- Flower (1996) Flower, P. J. 1996, ApJ, 469, 355
- Gabriel & Jordan (1969) Gabriel, A. H. & Jordan, C. 1969, MNRAS, 145, 241
- Groote & Hunger (1977) Groote, D. & Hunger, K. 1977, A&A, 56, 129
- Groote & Schmitt (2004) Groote, D. & Schmitt, J. H. M. M. 2004, A&A, in press
- Güdel et al. (2001) Güdel, M., Audard, M., Magee, H., et al. 2001, A&A, 365, L344
- Hamaguchi et al. (2000) Hamaguchi, K., Terada, H., Bamba, A., & Koyama, K. 2000, ApJ, 532, 1111
- Hunger et al. (1989) Hunger, K., Heber, U., & Groote, D. 1989, A&A, 224, 57
- Kahn et al. (2001) Kahn, S. M., Leutenegger, M. A., Cottam, J., et al. 2001, A&A, 365, L312
- Kastner et al. (2002) Kastner, J. H., Huenemoerder, D. P., Schulz, N. S., Canizares, C. R., & Weintraub, D. A. 2002, ApJ, 567, 434
- Kirsch (2003) Kirsch, M. 2003, EPIC Status of Calibration and Data Analysis, Tech. Rep. XMM-SOC-CAL-TN-0018, XMM-Newton Science Operation Center
- Landstreet & Borra (1978) Landstreet, J. D. & Borra, E. F. 1978, ApJ, 224, L5
- Lee (1968) Lee, T. A. 1968, ApJ, 152, 913
- Pallavicini et al. (2004) Pallavicini, R., Franciosini, E., & Randich, S. 2004, Mem. Soc. Astr. It., in press
- Pallavicini et al. (1981) Pallavicini, R., Golub, L., Rosner, R., et al. 1981, ApJ, 248, 279
- Reiners et al. (2000) Reiners, A., Stahl, O., Wolf, B., Kaufer, A., & Rivinius, T. 2000, A&A, 363, 585
- Sanz-Forcada et al. (2003) Sanz-Forcada, J., Maggio, A., & Micela, G. 2003, A&A, 408, 1087
- Schulz et al. (2003) Schulz, N. S., Canizares, C., Huenemoerder, D., & Tibbets, K. 2003, ApJ, 595, 365
- Siess et al. (2000) Siess, L., Dufour, E., & Forestini, M. 2000, A&A, 358, 593
- Smith et al. (1993) Smith, M. A., Grady, C. A., Peters, G. J., & Feigelson, E. D. 1993, ApJ, 409, L49
- Strüder et al. (2001) Strüder, L., Briel, U., Dennerl, K., et al. 2001, A&A, 365, L18
- Turner et al. (2001) Turner, M. J. L., Abbey, A., Arnaud, M., et al. 2001, A&A, 365, L27
- van Loon & Oliveira (2003) van Loon, J. T. & Oliveira, J. M. 2003, A&A, 405, L33
- Waldron & Cassinelli (2001) Waldron, W. L. & Cassinelli, J. P. 2001, ApJ, 548, L45
- Walter et al. (1997) Walter, F. M., Wolk, S. J., Freyberg, M., & Schmitt, J. H. M. M. 1997, Mem. Soc. Astr. It, 68, 1081
- Wolk (1996) Wolk, S. J. 1996, PhD thesis, Univ. New York at Stony Brook
- Wolk et al. (2004) Wolk, S. J., Adams, N. R., Walter, F. M., et al. 2004, in IAU Symposium 219: Stars as Suns, ed. A. K. Dupree & A. Benz, in press
- Zapaterio Osorio et al. (2000) Zapaterio Osorio, M. R., Béjar, V. J. S., Martín, E. L., et al. 2000, Science, 290, 103