R=100,000 Spectroscopy of Photodissociation Regions: H2 Rotational Lines in the Orion Bar
R=100,000 Spectroscopy of Photodissociation Regions: H2 Rotational Lines in the Orion Bar
1 Introduction
Photodissociation regions (PDRs) form on the surfaces of molecular clouds whenever these clouds are struck by far-ultraviolet radiation from hot young stars. These regions are characterized by the transition from hot, ionized gas to cold, molecular gas as the far-ultraviolet field is attenuated farther from the ionization front. The temperature profile of the PDR varies depending on the density and strength of the FUV field. Derivation of this profile must take into account the local heating and cooling, the chemical equilibrium, and radiative coupling to other layers within the structure. The Orion Bar is a dense molecular structure at the southeast boundary of the Orion Nebula. Early theoretical models of the Orion Bar by Tielens and Hollenbach tielens (for a density of 2.3 104 and UV field strength (G0) of 105) predict temperatures of 1000 K at AV=0-2, dropping to less than 100 K by AV=4.
Ground state rotational lines of H2 are good temperature probes of moderately hot (200-1000 K) gas. The low A-values of these lines result in low critical densities while ensuring that the lines are optically thin. ISO observations of H2 rotational lines in PDRs reveal large quantities of warm gas that are difficult to explain via current modelsdraine , but the spatial resolution of ISO does not resolve the temperature structure of the warm gas. We present and discuss high spatial resolution observations of H2 rotational line emission from the Orion Bar.
2 Observations and Data Reduction
We mapped the H2 = 0-0 S(1) and S(2) lines at 17.03 μm and 12.28 μm toward the Orion Bar in 2002 December. We made the observations using the Texas Echelon Cross Echelle Spectrograph (TEXES, lacy ) on the 3m NASA Infrared Telescope Facility (IRTF). The slit width was 2.0′′ for the 0-0 S(1) line and 1.4′′ for the 0-0 S(2) line. The spectral resolution of our data is 5.5 km s-1 at 17.03 μm and 4.7 km s-1 at 12.28 μm. On source integration times per position were 160 and 80 seconds for the 0-0 S(1) and S(2) lines respectively. We oriented the slit parallel to the Orion Bar ionization front, at a position angle of 45∘. We mapped by stepping the telescope from northwest to southeast in 0.7′′ (for S(2)) and 1′′ (for S(1)) steps to create 40′′ long scans. We reduced the raw images of cross-dispersed spectra using the standard TEXES pipeline reduction program lacy . We then smoothed our data to a spatial resolution of 2′′. The 0,0 position for the maps is at R.A. = 5h 35m 19.7s, Dec. = -5∘ 25′ 28.3′′ (J2000.0) and the mapped region runs from 13′′ northwest to 27′′ southeast of this position.
3 Results
3.1 Morphology
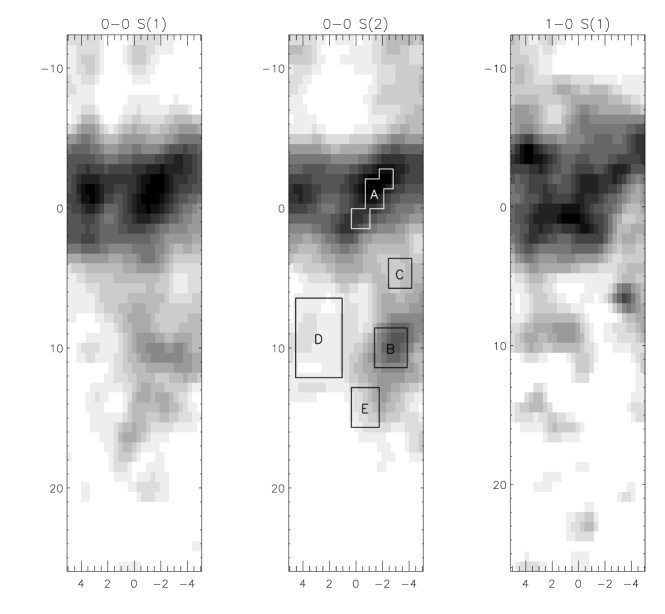
Figure 1 shows the distribution of =0-0 S(1) and S(2) intensity, along with distribution of intensity in the 2.12 μm = 1-0 S(1) line vanderwerf , resampled onto the same grid at the same spatial resolution. The dominant feature in the maps is the bright horizontal (northeast-southwest) ridge centered at y-2′′. This feature has a sharp northwestern edge, rising at most positions from a low or undetectable level to half of its peak intensity in 2′′ (0.004 pc). The total thickness of the bright ridge is 10′′ (0.02 pc).
There is remarkable agreement in the intensity distributions, not only between the 0-0 S(1) and 0-0 S(2) lines but also between these lines and the =1-0 S(1) line. The maps agree to within the uncertainties about the location and width of the bright ridge, and about the presence and extent of lower-level extended emission. To the left of its center, the bright ridge contains a clumpy “V” structure whose overall morphology echoes in all three lines.
3.2 Temperatures and Column Densities
Table 1 lists the temperatures and column densities for the areas labeled in Figure 1. Derived excitation temperatures range from roughly 400 to 700 K, with most areas at around 600 K. Over the 20′′ range in depth where we are able to measure temperature, we do not see any systematic trend in temperature with depth into the molecular cloud (to the southeast and farther from C).
| Observed Intensities | ||||||
|---|---|---|---|---|---|---|
| Area | 0-0 S(1) | 0-0 S(2) | 1-0 S(1) | Texa | Texb | N(H2)c |
| erg cm-2 s-1 | K | K | 1020 cm-2 | |||
| A | 7.7 | 6.6 | 3.6 | 476 | 630 | 7.7 |
| B | 3.8 | 4.3 | 0.49 | 591 | 554 | 3.1 |
| C | 1.8 | 2.1 | 1.3 | 616 | 661 | 1.4 |
| D | 1.1 | 1.3 | 0.94 | 668 | 673 | 0.81 |
| E | 2.6 | 1.8 | 0.2 | 413 | 525 | 3.1 |
a Excitation temperature determined from I[0-0 S(1)]/I[0-0 S(2)] assuming optically thin emission with o/p=3.
b Excitation temperature determined from I[1-0 S(1)]/I[0-0 S(1)] assuming optically thin emission with o/p=3.
c Column density of warm H2 for thermalized gas at the temperature determined from I[0-0 S(1)]/I[0-0 S(2)].
At most positions the temperature derived from the 0-0 S(1)/0-0 S(2) line intensity ratio agrees to better than 50 K with the temperature derived from the 1-0 S(1)/0-0 S(1) line intensity ratio despite a factor of 4 difference in Eupper between the 0-0 S(2) and 1-0 S(1) transitions. Looking at the entire dataset, we see the most variability between the two derived temperatures close to the ionization front. Because of the small variation in temperature over the mapped region of the PDR, the 0-0 S(2) line intensity map roughly traces the column density of warm H2.
3.3 Line widths and velocities
With the spectral resolution available with TEXES, we are able to resolve the ground vibrational state H2 lines. Physical linewidths (after deconvolving the instrument profile) are 3-6 km s-1, in agreement with linewidths expected for optically thin, thermalized gas at 600 K. Line widths for the two transitions agree to within 1-2 km s-1, with neither line being systematically wider than the other. We measure VLSR for the H2 lines to be 10-11 km s-1. Our observed line widths and velocities are in agreement with published values for both molecular lines (NH3 batrla , CS, and isotopes of CO hogerheijde ) and carbon recombination lines wyrowski .
4 Discussion
PDR models predict that H2 emission arises at a depth in the PDR with steep temperature gradients tielens ; draine . We do not see evidence for such spatial gradients even though we have resolved the PDR. The agreement of temperatures derived from the 0-0 S(1)/0-0 S(2) and 1-0 S(1)/0-0 S(1) line intensity ratio indicates that the emitting gas is isothermal. We re-interpret the 400-700 K temperatures found for galactic PDRs in the large ISO beam wright as emerging from isothermal gas, and not the beam-average of a temperature gradient. Future PDR modeling efforts must be able to explain the ubiquity of 600 K H2 in PDRs.
References
- (1) A.G.G.M. Tielens & D. Hollenbach: ApJ, 291, 747 (1985)
- (2) B.T. Draine & F. Bertoldi: ‘Heating the Gas in Photodissociation Fronts’. The Universe as seen by ISO, ed. P. Cox & M.F. Kessler (1999) pp. 553.
- (3) J.H. Lacy, M.J. Richter, T.K. Greathouse, D.T. Jaffe, & Q. Zhu: PASP, 114, 153 (2002)
- (4) P.P. van der Werf, J. Stutzki, A. Sternberg, & A. Krabbe: A&A, 315, L281 (1996)
- (5) W. Batrla & T.L. Wilson: A&A, 408, 231 (2003)
- (6) M.R. Hogerheijde, D.J. Jansen, & E.F. van Dishoeck: A&A, 294, 792 (1995)
- (7) F. Wyrowski, P. Schilke, P. Hofner, & C.M. Walmsley: ApJ, 487, L171 (1997)
- (8) C.M. Wright: ‘ISO-SWS observations of H2 in Galactic sources’. Molecular Hydrogen in Space, ed. F. Combes & G. Pineau des Forêts (Cambridge 2000) pp. 189-192