First Evidence of Circumstellar Disks around Blue Straggler Stars11affiliation: Based on observations with the NASA/ESA Hubble Space Telescope, obtained at the Space Telescope Science Institute, which is operated by the Association of Universities for Research in Astronomy, Inc., under NASA contract NAS5-2655.
Abstract
We present an analysis of optical HST/STIS and HST/FOS spectroscopy of 6 blue stragglers found in the globular clusters M 3, NGC 6752 and NGC 6397. These stars are a subsample of a set of 50 blue stragglers and stars above the main sequence turn-off in four globular clusters which will be presented in an forthcoming paper. All but the 6 stars presented here can be well fitted with non-LTE model atmospheres. The 6 misfits, on the other hand, possess Balmer jumps which are too large for the effective temperatures implied by their Paschen continua. We find that our data for these stars are consistent with models only if we account for extra absorption of stellar Balmer photons by an ionized circumstellar disk. Column densities of H i and Ca ii are derived as are the the disks’ thicknesses. This is the first time that a circumstellar disk is detected around blue stragglers. The presence of magnetically-locked disks attached to the stars has been suggested as a mechanism to lose the large angular momentum imparted by the collision event at the birth of these stars. The disks implied by our study might not be massive enough to constitute such an angular momentum sink, but they could be the leftovers of once larger disks.
1 Introduction
In the color-magnitude diagrams (CMD) of open and globular clusters (GCs), some stars appear brighter and bluer than the main sequence turn-off, yet not as bright as stars on the horizontal branch (HB; Sandage 1953; Paresce et al. 1991). Their brightnesses and colors are consistent with main-sequence evolutionary models for stars more massive than the cluster turnoff (e.g., Saffer et al. 2002). Blue stragglers are likely to form through a mass-acquisition episode such as a binary merger or a stellar collision (for an overview of stellar collisions, see Shara 2002). In the dense environments of GCs such collision mergers should in fact be common (Hills & Day 1976).
If the stragglers originate in stellar collisions, the rotation rate of the product star should be high (Sills et al. 2002). After an initial phase when the collision product is bloated, a contracting phase should follow. In the absence of angular momentum sinks, the star should spin up to faster than break-up speed and tear itself apart. A magnetically-locked circumstellar disk has been proposed as an efficient angular momentum reducer (Leonard & Livio 1995). Sills et al. (2002) do not find evidence for the formation of a substantial circumstellar disk from Smoothed Particle Hydrodynamics (SPH) simulations, including up to SPH particles, with the lightest particles having masses of .
In this Letter we present the first observational evidence consistent with thin disks around six GC stragglers. Our conclusion follows a careful analysis that excludes other systematic effects as potential explanations of the data. Whether these disks are the remnants of once more massive, dynamically important disks, or have always been thin disks unable to serve as angular momentum sinks, this finding is likely to provide an important window into the formation and evolution of blue stragglers.
2 Analysis
HST spectroscopy of stars in GCs M 3, NGC 6752 and NGC 6397 was acquired using STIS between April 1999 and March 2001 (GO-8226), and with FOS in October 1996 (GO-6697).
The STIS observations adopted low (G430L, =5.5 Å, range 3200-5600 Å) and intermediate (G430M, = 0.56 Å, range 3800-4100 Å) resolution gratings and the 52″05 slit. The FOS observations used the G400H (= 2.82 Å, range 3240–4822 Å) and G570H (= 4.09 Å, range 4574–6872 Å) gratings with the 05 aperture. Photometry of all the stars observed spectrographically was carried out on HST/WFPC2 images. Table 1 lists 6 of the 50 stars analyzed.
Details of the data reduction, will be presented by De Marco et al. (2004). Here we summarize the extraction technique which is vital for the issues at the heart of this Letter. For STIS observations, the size of the extraction aperture cannot be too large if we are to avoid contamination of the straggler’s spectrum. On the other hand, the aperture width cannot be too small or the wings of the wavelength-dependent spatial Point Spread Function (PSF) will not be extracted, introducing an artificial color bias. Stars extracted with too small an aperture will be systematically bluer in the Paschen continuum (longward of 4100 Å), but have Balmer jumps and Balmer continua which are those of a cooler star. We have devoted considerable care to insure that the extraction signature was clearly removed from all spectra. The spectra are extracted with progressively wider apertures, becoming redder as more and more of the PSF’s wings are included, up to a certain aperture width (about 8 pixels, or 034). Extracting the spectra with apertures larger than this threshold does not alter the result. Stars showing any significant contamination with an 8-pixel aperture have been excluded from the sample. For the FOS observations, the size of the entrance aperture (05) ensures that extraction problems do not affect our data.
Initial estimates of the stellar parameters were derived from a grid of LTE model spectra calculated with Hubeny & Lanz (1995) spectrum synthesis code, SYNSPEC, based on Kurucz ATLAS9 LTE model atmospheres, and covering the range = 5000 – 25000 K and = 2.0 – 5.0. The helium and alpha element abundances were He/H=0.24 (by mass), and [/Fe]=0.3 for all clusters, following the prescription of Bergbusch & VandenBerg (2001). The metal abundances used were [Fe/H]= for M 3 and NGC 6752 and for NGC 6397. (Harris 1996 quotes [Fe/H] = , and , respectively. At these low metallicities, differences as large as 0.1 dex do not alter the stellar parameters obtained.) We have assumed a constant microturbulent velocity of 2 km s-1.
To compare data and model continua, we measured the fluxes at 3560, 4200 and 5450 Å, by averaging flux values in bands 120, 80 and 120 Å-wide, respectively, to reduce the noise while avoiding absorption lines. The fluxes were converted to magnitudes using the , and zero-points defined by Bessell, Castelli & Plez (1998). In Fig. 1 we present the comparison of models’ and observations’ dereddened colors for NGC 6397. Similar diagrams will be shown for the entire sample of 50 blue stragglers in De Marco et al. (2004). On these color-color plots, several stars appear bluer (smaller values of [4200]-[5450]) than the locus occupied by the models. For these stars, there is no model that simultaneously fits the Paschen continuum (and hence the [4200]-[5450] color) and the Balmer jump (represented by the [3560]-[4200] color). If an effective temperature is chosen to fit the Paschen continuum, the observed Balmer jump remains too deep compared to the predicted jump by about 10%. This difference is significant, since model fits to the other blue stragglers in the sample match the data within the noise ( 3%).
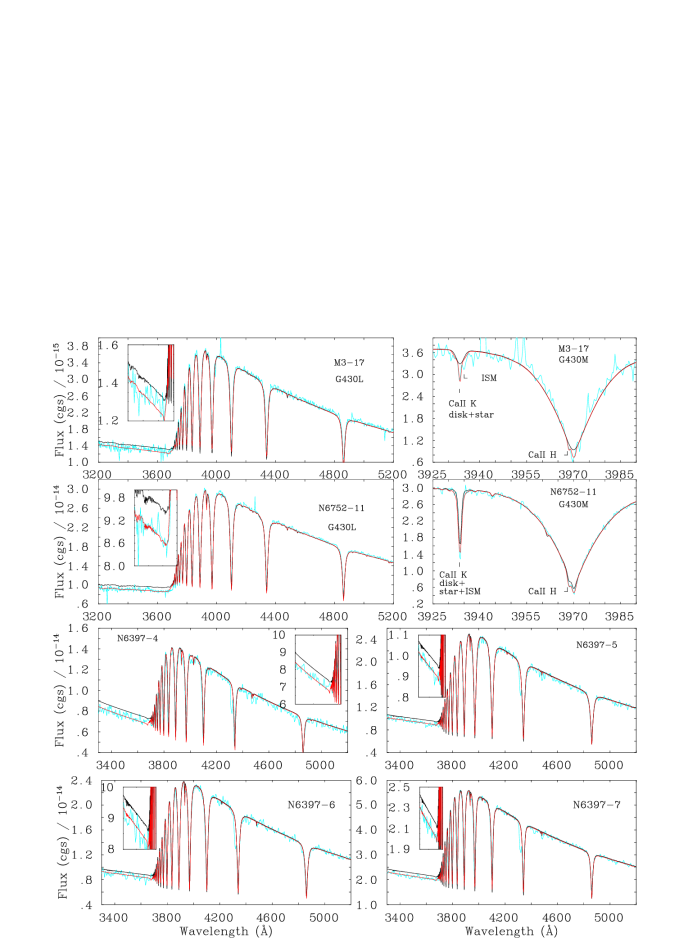
In order to verify that there are no systematic errors in the theoretical colors and, hence, to confirm that indeed there is no model that fits the data, we calculated NLTE models with the code TLUSTY (version 198; Hubeny & Lanz 1995). Explicit NLTE ions include H i, He i-ii, C i-iii and Fe i-iii. Additional opacity sources, such as that due to the ion H- and lines of other species are treated in LTE. Abundances and the microturbulent velocities are assigned the same values as for the LTE models. At these temperatures (700015000 K), the NLTE model continua and Balmer lines compare quite well with the LTE predictions. The NLTE spectral fits indeed confirm that there is no combination of model parameters that matches the data for these 6 stars. In Fig. 2 we present model fits for the six stars. The black lines represent the photospheric model spectra; the predicted jump is shallower than the observed data (blue lines) by about 10%. The red lines show the same models with additional absorption by a circumstellar disk (see below). For M 3-17 the wings of the Ca ii lines are broad and a = 200 km s-1 was adopted. The narrow core of the line is well fit with additional absorption from a disk. For NGC 6752-11 we adopted = 50 km s-1, but this is strictly an upper limit. For the other three stars, the lower resolution does not allow to estimate stellar rotation. No interstellar contamination is expected for M 3, because of its large heliocentric radial velocity.
Neither spectrum contamination by other stars nor reddening can explain this the Bamler observed jump discrepancy. Blending of two stars with different temperatures would move data points towards the upper part of the color-color diagrams (Fig. 1), because the hotter of the two stars contributes more flux to the blue part of the spectrum while the cooler one is a larger contributor to the red part. This results in the Paschen continuum becoming too red (values of the [4200]-[5450] color) for any given Balmer jump; exactly the opposite of what we observe. We adopted values of 0.016, 0.056 (Schlegel, Finkbeiner & Davis 1998) and 0.18 mag (Harris 1996), for M 3, NGC6752 and NGC 6397, respectively. If the reddening corrections were lower than the adopted values, the colors of our 6 stars would be closer to those of the models and the Balmer continua would be less discrepant. Rood et al. (1999) determined a reddening value for M 3 of mag, while Gratton et al. (2003) determined reddening values of 0.040 and 0.183 mag for NGC 6752 and NGC 6397, respectively. From the literature, we expect reddening values’ uncertainties no larger than 0.015 mag (NGC 6752) and 0.005 mag (M 3 and NGC 6397). A reddening smaller by 0.015 mag would eliminate the Balmer continuum discrepancy for NGC6752-11, while a reddening decrement of 0.005 mag would eliminate the discrepancy for NGC 6397-6. For the other four stars reddening decreases of 0.015 mag (M 3) and more than 0.020 mag (for NGC 6752 and NGC 6397) are required to reconcile data and models. Such relatively large reddening adjustments are not consistent with our knowledge of reddening in the respective clusters. Star-to-star reddening variability over spatial scales from (NGC 6397) to 10 (M 3 and NGC 6572) are not expected to be above a few percent of the mean cluster reddening (Thorval et al. 1997). In conclusion, while not categorically excluding reddening as a source of at least part of the discrepancy, we cannot dismiss the Balmer jump discrepancy on reddening grounds.
Radiative levitation might be suspected to be at the origin of the Balmer continuum discrepancy since it is known to results in large photospheric iron overabundances in horizontal-branch stars (Moehler et al. 2003). However, our tests show that the Balmer continuum level of the models is not affected significantly by an increase of the model iron abundance by factors of 4 to 12. An over-abundance by a factor of 4 can already be excluded for NGC6752-11, based on the STIS intermediate-resolution spectrum. There are no indications of metal overabundances in any of the 6 stars, suggesting that elemental diffusion is not the cause of the Balmer jump discrepancy.
We are therefore led to conclude that the data can be reconciled with the models only if we allow for absorption of Balmer continuum photons by an intervening layer of partly ionized material (Fig. 1, red lines). Stellar effective temperatures and surface gravities were determined by fitting the Paschen continuum and the Balmer lines. The Balmer jump is at this point poorly matched, with the models having a brighter Balmer continuum than the data. A simple absorption model was then calculated to determine the column density of the intervening material. An absorption model providing the necessary continuum absorption results in Balmer line core absorptions stronger than any we observe, if the stellar surface is completely covered by the intervening material. This suggests that the absorbing material might be distributed in a thin circumstellar disk. In Table 2 we list the fraction of stellar surface eclipsed by the disk for each straggler.
The disk also absorbs Ca II H&K line photons, and we derived Ca II column densities. Except for M 3, for which can separate the interstellar from the disk contribution because of a high radial velocity (–147.6 km s-1; Harris 1996; see Fig. 2), the limited spectral resolution of our data does not allow us to exclude that the Ca II absorption has an interstellar origin. The observed Ca ii K lines could be matched assuming an interstellar column, N(Ca ii) cm-2, that is consistent with columns measured toward sources in the Galactic halo (Smoker et al. 2003).
Finally, the stellar radii were obtained by scaling the models’ fluxes to the dereddened PSF photometry values (), while adopting = 15.23, 13.26 and 12.60 mag for M 3 (Harris 1996), NGC 6752 and NGC 6397 (Gratton et al. 2003), respectively. From the radii, effective temperatures and gravities, we determined the bolometric luminosities and the masses (5 out of 6 masses are convincingly larger than the clusters’ turn-off masses; this will be fully discussed in the context of the complete sample by De Marco et al. [2004]). Our results and their uncertainties are summarized in Table 2.
3 Discussion
From the Boltzmann equation, the disk electron temperatures must typically be larger than 9000 K in order to populate the first excited level of hydrogen. The derived column densities depend moderatly on the disk temperatures, which were assumed to be the same as the stellar effective temperatures. From the Saha equation, the hydrogen ionization fraction is 10-3 - 10-4, implying a collisionally-ionized disk. The ratio of the Ca II to H I column densities is typically 110-4, which is consistent with the stellar Ca/H abundance ratio when we account for the hydrogen ionization fraction and assume no dust depletion of calcium.
With a total H column density of 1025 cm-2 (Table 1), assuming a disk radius of 0.1 AU (larger disk radii should be rare in the crowded environments of GC centers), and a thickness of 0.03 AU derived from a covering factor of 20% and a stellar radius of 2.0 , from simple geomentry we obtain a total H density of 110-11 g cm-3 and a total mass of 210-8 . An increase of the disk radius increases the disk mass proportionally.
We suggest that most stragglers might have circumstellar disks. The disk pushes data points in the color-color diagram down (Fig. 1). Only those data points that shift outside the locus covered by the models will be recognized as stars with disks. For those stars whose disks do not change their colors enough to displace them outside the locus covered by the models, an alternative model (cooler and with lower gravity) will be found that fits the data. A method of detecting these disks might be by UV spectroscopy of low ionization metal line.
The disks implied by our analysis are irrevocably non-massive. Although typical SPH simulations could not be used to predict disks as light as these, the one-million-particle simulation of Sills et al. has particle masses as small as 10-10 and might have forecast the presence of disks as light as 10-8 . On the other hand, magneto-hydrodynamical transport of angular momentum, not included in the SPH code of Sills et al., might be important. More work is needed both observationally and theoretically to understand the presence and role of disks in blue straggler formation.
References
- Bessell et al. (1998) Bessell, M. S., Castelli, F., & Plez, B. 1998, A&A, 333, 231
- Bergbusch & VandenBerg (2001) Bergbusch, P. A., & VandenBerg, D. A. 2001, ApJ, 556, 322
- Gratton et al. (2003) Gratton, R. G., et al. 2003, A&A, 408, 529
- Harris (1996) Harris, W. E. 1996, AJ, 112, 1487
- Hills & Day (1976) Hills, J. G., & Day, C. A. 1976, ApJ, 17, 87
- Hubeny & Lanz (1995) Hubeny, I., & Lanz, T. 1995, ApJ, 439, 875
- Leonard & Livio (1995) Leonard, P. J. T., & Livio, M. 1995, ApJ, 447, 121
- Moehler et al. (2003) Moehler, S., Landsman, W.B., Sweigart, A.V., & Grundahl, F. 2003, A&A, 405, 135
- Paresce et al. (1991) Paresce, F., Meylan, G., Shara, M., Baxter, D., & Greenfield, P., 1991, Nature, 352, 297
- Rood et al. (1999) Rood, R. T., et al. 1999, ApJ, 523, 752
- Schlegel et al. (1998) Schlegel, D. J., Finkbeiner, D. P., & Davis, M. 1998, ApJ, 500, 525
- Sills et al. (2002) Sills, A., Adams, T., Davies, M. B., & Bate, M. R. 2002, MNRAS, 332, 49
- Saffer et al. (2002) Saffer, R. A., et al., 2002, ASP Conf. Ser., 263, 157
- Sandage (1953) Sandage, A. R. 1953, AJ, 58, 61
- Shara (2002) Shara, M. M., ed., 2002, Stellar Collisions, Mergers and their consequences, ASP Conf. Ser. 263
- Smoker et al. (2003) Smoker, J.V., et al. 2003, MNRAS, 346, 119
- Thorval et al. (1997) Thorval, S., Boissé, P., & Duvert G. 1997, A&A, 319, 948
| Star | RA & Dec (J2000) | Datasets |
|---|---|---|
| M3-17 | 13 42 10.6 +28 22 58.6 | O5GX130(10,20)aaThe star spectra are at y-pixel 772 and 103, respectively |
| N6397-4 | 17 40 42.3 -53 40 30.5 | Y3FJ010(B,C)T |
| N6397-5 | 17 40 42.2 -53 40 32.1 | Y3FJ010(L,M,N)T |
| N6397-6 | 17 40 42.4 -53 40 32.7 | Y3FJ010(P,Q)T |
| N6397-7 | 17 40 41.3 -53 40 25.5 | Y3FJ010(4,5)T |
| N6752-11 | 19 10 52.0 -59 59 07.0 | O5GX180(10,20)aaThe star spectra are at y-pixel 772 and 103, respectively |
| Parameter | M3-17 | NGC6752-11 | NGC6397-4 | NGC6397-5 | NGC6397-6 | NGC6397-7 |
|---|---|---|---|---|---|---|
| [mag] | 0.016 | 0.056 | 0.18 | 0.18 | 0.18 | 0.18 |
| [K] | 10 000 | 9000 | 13 000 | 10 200 | 10 000 | 10 500 |
| (g [cm s-2]) | 3.8 | 3.5 | 4.2 | 4.2 | 4.0 | 3.7 |
| [] | 2.4 | 3.4 | 1.0 | 1.9 | 1.9 | 2.7 |
| [] | 1.35 | 1.30 | 0.62 | 2.03 | 1.29 | 1.30 |
| [km s-1] | 20050 | 50 | ||||
| [mag] | 16.09 | 13.92 | 15.21 | 14.53 | 14.61 | 13.64 |
| [mag] | 13.87 | 15.36 | 14.66 | 14.71 | 13.79 | |
| [mag] | 16.06 | 13.94 | 15.40 | 14.59 | 14.63 | 13.82 |
| (N(H i)) | 20.8 | 21.7 | 19.8 | 20.9 | 21.0 | 20.7 |
| (N(Ca ii)) | 16.0 | 17.3 | 17.0 | 17.0 | 17.0 | 17.0 |
| covering fact. | 0.25 | 0.20 | 0.20 | 0.15 | 0.25 | 0.15 |
Note. — Uncertainties: =250 K; =0.1; The covering factor is uncertain by 0.05; The column densities are uncertain by 0.2 dex; Distances are assumed to be accurate to 10%, as is the compound uncertainty of scaling the stellar model flux to the data. The resulting uncertainty on the masses is thus typically 50%.