The SAURON project - III. Integral-field absorption-line kinematics of 48 elliptical and lenticular galaxies
Abstract
We present the stellar kinematics of representative elliptical and lenticular galaxies obtained with our custom-built integral-field spectrograph SAURON operating on the William Herschel Telescope. The data were homogeneously processed through a dedicated reduction and analysis pipeline. All resulting SAURON datacubes were spatially binned to a constant minimum signal-to-noise. We have measured the stellar kinematics with an optimized (penalized pixel-fitting) routine which fits the spectra in pixel space, via the use of optimal templates, and prevents the presence of emission lines to affect the measurements. We have thus generated maps of the mean stellar velocity , the velocity dispersion , and the Gauss–Hermite moments and of the line-of-sight velocity distributions. The maps extend to approximately one effective radius. Many objects display kinematic twists, kinematically decoupled components, central stellar disks, and other peculiarities, the nature of which will be discussed in future papers of this series.
keywords:
galaxies: bulges – galaxies: elliptical and lenticular, cD – galaxies: evolution – galaxies: formation – galaxies: kinematics and dynamics – galaxies: structure1 INTRODUCTION
We are carrying out a study of the structure of 72 representative nearby early-type galaxies and spiral bulges based on measurements of the two-dimensional (2D) kinematics and line-strengths of stars and gas with SAURON, a custom-built panoramic integral-field spectrograph for the William Herschel Telescope (WHT), La Palma. SAURON is based on the TIGER microlens concept (Bacon et al. 1995; see also Bacon et al. 2000), and is described in detail in Paper I (Bacon et al. 2001b). The objectives of the SAURON survey are summarized in Paper II (de Zeeuw et al. 2002), which also contains the definition and global properties of the sample. Here we present maps of the stellar kinematics for the 48 elliptical (E) and lenticular (S0) galaxies in the survey. The morphology and kinematics of the ionized gas, the line-strength distributions, similar measurements for the spiral galaxies in the sample, and higher spatial resolution integral-field observations obtained with OASIS on the Canada-France-Hawaii Telescope (CFHT) will be presented separately. The data and maps presented in this paper will be made available via the SAURON WEB page http://www.strw.leidenuniv.nl/sauron/.
2 Observations and data reduction
| Run | Dates | Clear |
|---|---|---|
| 1 | 14–20/02/1999 | 3.5/7 |
| 2 | 08–14/10/1999 | 4/8 |
| 3 | 27/03–03/04/2000 | 3.5/8 |
| 4 | 01–04/09/2000 | 3/3 |
| 5 | 14–25/03/2001 | 11.5/12 |
| 6 | 14–17/01/2002 | 3/4 |
| 7 | 10–19/04/2002 | 5/10 |
| 8 | 24–27/04/2003 | 2/4 |
2.1 Observing runs
We were allocated a total of 56 nights on the WHT, split into 8 runs over four years, to observe the complete SAURON representative sample of 72 objects. This substantial allocation was divided almost equally between the observing times of the United Kingdom and the Netherlands. Table 1 summarizes the dates and provides weather statistics. A total of 35.5 nights were clear. Run 1 followed soon after the commissioning period (February 1–5, 1999, see Paper I). SAURON is a visitor instrument, so each run was preceded by one or two days of configuring and calibrating the instrument, with help from the Isaac Newton Group staff. The first three runs were plagued by poor weather, and technical problems further hindered progress in Run 4. The installation of ULTRADAS (observing control software at the WHT) in the spring of 2001 improved the efficiency, which, combined with the exceptional weather statistics of Run 5 allowed us to make more rapid progress. A new volume-phase holographic grating (VPH) was installed for Run 8, resulting in a further increase in the efficiency of the spectrograph to a remarkable 20% end-to-end (atmosphere, telescope, detector).
| NGC | Run | T | NGC | Run | T | NGC | Run | T | NGC | Run | Texp | ||||
|---|---|---|---|---|---|---|---|---|---|---|---|---|---|---|---|
| (1) | (2) | (3) | (4) | (1) | (2) | (3) | (4) | (1) | (2) | (3) | (4) | (1) | (2) | (3) | (4) |
| 474 | 2 | 1 | 4x1800 | 3379 | 1 | 1 | 3x1800 | 4473 | 5 | 1 | 4x1800 | 5813 | 3 | 1 | 2x1800 |
| 524 | 4 | 1 | 2x1800 | 1 | 2 | 3x1800 | 5 | 2 | 4x1800 | 3 | 2 | 4x1800 | |||
| 4 | 2 | 4x1800 | 1 | 3 | 2x1800 | 4477 | 5 | 1 | 4x1800 | 3 | 3 | 4x1800 | |||
| 4 | 3 | 4x1800 | 3384 | 3 | 1 | 4x1800 | 5 | 2 | 4x1800 | 5831 | 5 | 1 | 1x1800 | ||
| 821 | 2 | 1 | 3x1800 | 3414 | 6 | 1 | 4x1800 | 4486 | 5 | 1 | 4x1800 | 5 | 1 | 1x1200 | |
| 2 | 2 | 3x1800 | 3489 | 5 | 1 | 4x1800 | 5 | 2 | 4x1800 | 5 | 2 | 1x1200 | |||
| 1023 | 2 | 1 | 4x1800 | 3608 | 1 | 1 | 4x1800 | 5 | 3 | 3x1800 | 5 | 2 | 2x1800 | ||
| 2 | 2 | 4x1800 | 4150 | 3 | 1 | 4x1800 | 4526 | 5 | 1 | 4x1800 | 5 | 3 | 1x1500 | ||
| 2549 | 1 | 1 | 4x1800 | 4262 | 6 | 1 | 4x1800 | 5 | 2 | 4x1800 | 5838 | 5 | 1 | 4x1800 | |
| 2685 | 5 | 1 | 4x1800 | 4270 | 6 | 1 | 4x1800 | 4546 | 7 | 1 | 4x1800 | 5845 | 5 | 1 | 4x1800 |
| 5 | 2 | 4x1800 | 4278 | 1 | 1 | 4x1800 | 4550 | 1 | 1 | 4x1800 | 5846 | 5 | 1 | 4x1800 | |
| 2695 | 6 | 1 | 4x1800 | 1 | 2 | 4x1800 | 4552 | 1 | 1 | 3x1800 | 5 | 2 | 4x1800 | ||
| 2699 | 5 | 1 | 4x1800 | 4374 | 5 | 1 | 4x1800 | 4564 | 3 | 1 | 4x1800 | 5 | 3 | 4x1800 | |
| 2768 | 5 | 1 | 4x1800 | 5 | 2 | 4x1800 | 4570 | 6 | 1 | 5x1800 | 5982 | 5 | 1 | 4x1800 | |
| 5 | 2 | 4x1800 | 5 | 3 | 4x1800 | 4621 | 5 | 1 | 4x1800 | 5 | 2 | 4x1800 | |||
| 2974 | 5 | 1 | 4x1800 | 4382 | 5 | 1 | 4x1800 | 5 | 2 | 4x1800 | 7332 | 2 | 1 | 4x1800 | |
| 5 | 2 | 4x1800 | 5 | 2 | 4x1800 | 4660 | 5 | 1 | 4x1800 | 7457 | 2 | 1 | 3x1800 | ||
| 3032 | 5 | 1 | 3x2100 | 4387 | 5 | 1 | 4x1800 | 5198 | 5 | 1 | 4x1800 | 2 | 1 | 1x1600 | |
| 3156 | 6 | 1 | 4x1800 | 4458 | 5 | 1 | 4x1800 | 5308 | 5 | 1 | 4x1800 | 2 | 1 | 1x1030 | |
| 3377 | 1 | 1 | 4x1800 | 4459 | 5 | 1 | 4x1800 | 2 | 2 | 4x1800 | |||||
| 5 | 2 | 4x1800 |
Notes: (1) NGC number. (2) Run number (see Table 1). (3) Pointing number. (4) Exposure time, in sec.
The SAURON sample of 48 E and S0 galaxies is representative of nearby bright early-type galaxies ( ; mag). As described in Paper II, it contains galaxies in each of the E and S0 subclasses, equally divided between ‘cluster’ and ‘field’ objects (the former defined as belonging to the Virgo cluster, the Coma I cloud, and the Leo I group, and the latter being galaxies outside these clusters), uniformly covering the plane of ellipticity versus absolute blue magnitude . Tables A1 and A2 in Paper II provide basic information on the objects.
We used the low resolution mode of SAURON, giving a field of view of , fully sampled by 1431 square lenses in size, each of which produces a spectrum. Another 146 lenses sample a small region about from the field center for simultaneous observation of the sky background. The wavelength range 4800–5380 Å is covered at Å spectral resolution (FWHM, ) with a sampling of Å per pixel. This range includes a number of important stellar absorption lines (e.g. H, Mg, Fe) and potential emission lines (e.g. H, [O iii], [N i]).
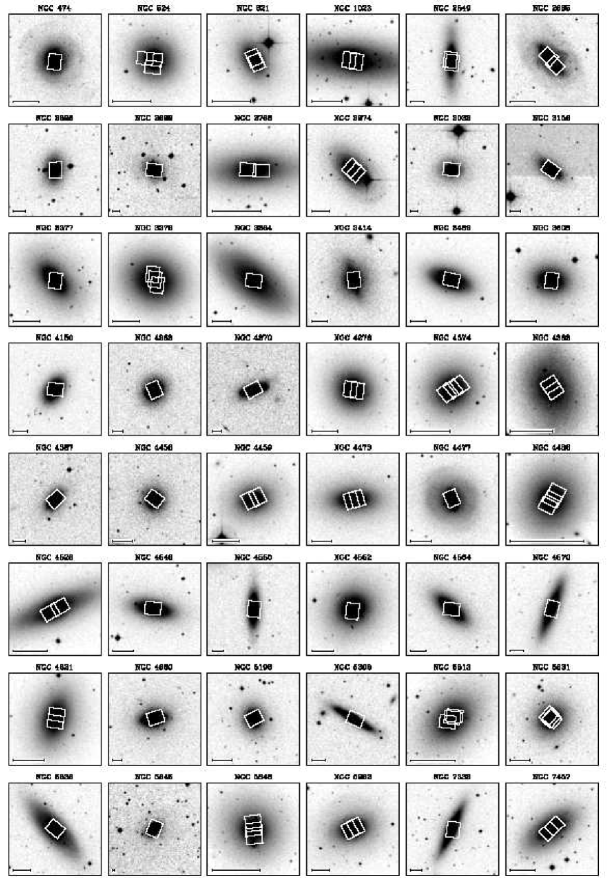
Each galaxy field was typically exposed for s, each dithered by a small non-integer number of lenses to avoid systematic errors due to e.g., bad CCD regions. In about one third of the cases, we constructed mosaics of two or three pointings to cover the galaxy out to about one effective radius , or, for the largest objects, out to . The footprints of these pointings are shown overlaid on -band Digital Sky Survey images in Figure 1. For each of the 48 galaxies, Table 2 lists the run(s) in which it was observed, and the exposure times for the individual pointings. Note that Run 8 was used to complete the sample of early-type spirals, the data of which will be presented in a future paper of this series. Arc lamp exposures were taken before and after each 1800s exposure in order to track flexures and provide a wavelength calibration. We also obtained data for a number of velocity, line-strength and flux standard stars throughout each night, for calibration purposes.
2.2 Data reduction
We reduced the SAURON observations with the dedicated XSAURON software developed at CRAL and described in Paper I. The steps include bias and dark subtraction, extraction of the spectra using a fitted mask model, wavelength calibration, low frequency flat-fielding, cosmic-ray removal, homogenization of the spectral resolution over the field, sky subtraction, and flux calibration. The wavelength calibration is accurate to Å ( ).
2.3 Merging and binning
We merged multiple exposures and mosaiced different fields by truncating the wavelength domain to a common range, registering the exposures using reconstructed images, and combining the spectra (as well as the noise spectra) with optimal weights and (re)normalisation. During this process, we resampled the datacubes to a common spatial scale of , reorienting them to have the North up and East left, and correcting for the effect of atmospheric refraction (as in Emsellem et al. 1996).
Because a minimum signal-to-noise ratio () is required to reliably measure stellar kinematics, we spatially binned the data cubes using an adaptive scheme developed by Cappellari & Copin (2003). In this approach, the spectra are coadded by starting from the highest lenslet, and accreting additional lenslets closest to the current bin centroid. A new bin is started each time the target is reached. The resulting bin centroids are then used as starting points for a centroidal Voronoi tessellation (see, e.g., Du et al., 1999), ensuring compact non-overlapping bins and a uniform in faint regions. We imposed a minimum of per spectral resolution element for the kinematical measurements presented here.
2.4 Determination of the point spread function
We determined the point spread function (PSF) of each merged exposure by comparing the reconstructed SAURON intensity distribution with HST/WFPC2 images. The SAURON PSF is well-described by the sum of two circular Gaussians whose parameters are determined by minimizing the difference between the WPFC2 image (convolved by these Gaussians) and the SAURON reconstructed image (Bacon et al., 2001a). The result is valid in the central region where the overlap between individual exposures is maximum. The derived seeing values are listed in Table 3. WFPC2/F555W images were favoured as the F555W filter corresponds more closely to the SAURON spectral domain. WFPC/F814W images were however used for about a third of the galaxies presented here, for which the F555W filter was not available. HST imaging does not exist for two objects in the E/S0 sample, namely NGC 2695 and NGC 4262, and for another two, NGC 4387 and NGC 7332, only WFPC1 data is available. For these galaxies, we favoured the estimates of the PSF width provided by the seeing monitor at WHT. In most cases, SAURON undersamples the seeing.
| NGC | Type | Vsyst | Vbary | Source | Seeing | |
|---|---|---|---|---|---|---|
| (1) | (2) | (3) | (4) | (5) | (6) | (7) |
| 474 | S00(s) | 2319 | 0.9 | F814W | 1.9 | 0 |
| 524 | S0+(rs) | 2353 | -30.0 | F555W | 1.4 | 0 |
| 821 | E6? | 1722 | 7.6 | F555W | 1.7 | 30 |
| 1023 | SB0-(rs) | 614 | 14.6 | F555W | 1.4 | 270 |
| 2549 | S00(r)sp | 1069 | -12.5 | F702W | 1.7 | 0 |
| 2685 | (R)SB0+pec | 883 | -20.8 | F555W | 1.3 | 322 |
| 2695 | SAB00(s) | 1831 | 10.9 | WHT | 2.0 | 9 |
| 2699 | E: | 1864 | -17.3 | F702W | 1.3 | 270 |
| 2768 | E6: | 1359 | -18.9 | F555W | 1.4 | 5 |
| 2974 | E4 | 1886 | -14.3 | F555W | 1.4 | 326 |
| 3032 | SAB00(r) | 1559 | -20.6 | F606W | 1.5 | 270 |
| 3156 | S0: | 1541 | 18.8 | F814W | 1.6 | 61 |
| 3377 | E5-6 | 690 | 5.0 | F555W | 2.1 | 0 |
| 3379 | E1 | 916 | 4.8 | F555W | 1.8 | 270 |
| 3384 | SB0-(s): | 737 | -17.6 | F555W | 1.8 | 270 |
| 3414 | S0 pec | 1472 | 16.9 | F814W | 1.4 | 193 |
| 3489 | SAB0+(rs) | 702 | -8.5 | F814W | 1.1 | 84 |
| 3608 | E2 | 1228 | 5.6 | F555W | 1.5 | 0 |
| 4150 | S00(r)? | 219 | -8.9 | F814W | 2.1 | 270 |
| 4262 | SB0-(s) | 1371 | 25.7 | WHT | 2.6 | 30 |
| 4270 | S0 | 2333 | 27.3 | F606W | 2.0 | 124 |
| 4278 | E1-2 | 631 | 9.7 | F555W | 1.9 | 0 |
| 4374 | E1 | 1023 | 2.8 | F814W | 2.2 | 45 |
| 4382 | S0+(s)pec | 742 | -1.8 | F555W | 2.7 | 309 |
| 4387 | E | 568 | 3.4 | WHT | 1.3 | 320 |
| 4458 | E0-1 | 683 | 2.3 | F555W | 1.6 | 60 |
| 4459 | S0+(r) | 1200 | -1.8 | F814W | 1.5 | 34 |
| 4473 | E5 | 2249 | 0.2 | F555W | 1.9 | 24 |
| 4477 | SB0(s):? | 1350 | -2.1 | F606W | 2.1 | 39 |
| 4486 | E0-1+pec | 1274 | 2.5 | F555W | 1.0 | 70 |
| 4526 | SAB00(s) | 626 | 0.8 | F555W | 2.8 | 37 |
| 4546 | SB0-(s): | 1051 | -8.7 | F606W | 1.8 | 274 |
| 4550 | SB00:sp | 413 | -28.1 | F555W | 2.1 | 0 |
| 4552 | E0-1 | 351 | 16.2 | F555W | 1.9 | 0 |
| 4564 | E | 1149 | -2.6 | F702W | 2.1 | 270 |
| 4570 | S0 sp | 1780 | 28.1 | F555W | 1.7 | 353 |
| 4621 | E5 | 456 | 3.5 | F555W | 1.6 | 89 |
| 4660 | E | 1089 | 3.4 | F555W | 1.6 | 294 |
| 5198 | E1-2: | 2531 | -1.1 | F702W | 1.5 | 304 |
| 5308 | S0- sp | 1985 | -5.0 | F555W | 2.4 | 74 |
| 5813 | E1-2 | 1947 | 15.6 | F555W | 1.7 | 270 |
| 5831 | E3 | 1656 | 21.1 | F702W | 1.6 | 325 |
| 5838 | S0- | 1340 | 20.7 | F814W | 1.6 | 57 |
| 5845 | E: | 1474 | 20.5 | F555W | 1.5 | 344 |
| 5846 | E0-1 | 1710 | 19.6 | F555W | 1.4 | 284 |
| 5982 | E3 | 2935 | 1.4 | F555W | 1.2 | 34 |
| 7332 | S0 pec sp | 1206 | -13.4 | WHT | 1.1 | 0 |
| 7457 | S0-(rs)? | 845 | -9.0 | F555W | 1.3 | 320 |
Notes: (1) NGC number. (2) Hubble type (RC3: de Vaucouleurs et al. 1991) (3) Estimate of the heliocentric systemic velocity in (see Sect. 3). (4) Mean barycentric correction applied to the merged datacubes (in ). (5) Source for the seeing determination (see text) (6) Seeing, full width at half maximum in arcsec. (7) Position angle, in degrees, of the vertical (upward) axis in the maps shown in Figs. 4a-4l.
2.5 Stellar kinematics
Most of the galaxies in this sample are contaminated by significant emission lines of e.g., H, the [O iii]4959,5007 or [N i]5198,5200 doublets. This causes problems for techniques working in Fourier space, e.g. the Fourier Correlation Quotient (FCQ, Bender 1990) or the Cross Correlation Fitting (CCF, Statler 1995) techniques, as they do not permit direct masking of specific spectral regions. Such methods can obviously make use of continuous spectral regions not or weakly affected by emission lines. However, considering the short spectral domain provided by SAURON, and the significant fraction of galaxies found to exhibit the emission lines which punctuate this region, these techniques are not well suited to these data. For this reason we opted for the use of a direct pixel-fitting (PXF) routine to extract the kinematics, allowing emission-line regions to be easily masked (e.g., van der Marel, 1994; Cappellari & Emsellem, 2004, and references therein). We emphasize that all results obtained with this new implementation are fully consistent with the early results presented in Paper II.
2.5.1 Penalized pixel fitting with optimal templates
We derive the line-of-sight velocity distribution (hereafter LOSVD) parametrized by a Gauss-Hermite function (van der Marel & Franx, 1993; Gerhard, 1993) for each spectrum using the PXF routine: the algorithm finds the best fit to a galaxy spectrum (rebinned in ) by convolving a template stellar spectrum with the corresponding LOSVD. This provides the mean velocity and the velocity dispersion , as well as the higher order Gauss-Hermite moments and , which quantify the asymmetric and symmetric departures of the LOSVD from a pure Gaussian (related to the skewness and kurtosis respectively). Although this appears as a conceptually simple procedure, there are two critical issues (not specific to SAURON) to carefully consider to obtain robust and reliable kinematic measurements.
- Optimal templates:
-
Although robust against the presence of emission lines, PXF is sensitive to template mismatch, in contrast to CCF and FCQ which minimize the coupling between different absorption features by restricting the analysis to the main peak of the cross correlation between the template and the galaxy spectra. The use of PXF thus requires templates which match closely the galaxy spectrum under scrutiny. The derivation of optimal stellar templates must be conducted for every individual spectrum (as galaxies may e.g. exhibit significant metallicity or age gradients within the SAURON field of view). This is achieved via the use of an extensive stellar library spanning a large range of metallicities and ages. We primarily included 19 spectra from the library of single-metallicity stellar population models of Vazdekis (1999), and added 5 spectra from the Jones stellar library (from which Vazdekis’ models are built; Jones 1997) to provide spectra with strong Mg indices. This also requires the inclusion of additive Legendre polynomials to adapt the continuum shape of the templates.
- Penalized pixel fitting:
-
When measuring the Gauss-Hermite moments of the LOSVD up to , undersampling becomes important when the observed dispersion is less than about 2 pixels (equivalent to around 120 for SAURON). Below this dispersion a very high is required to accurately measure the Gauss-Hermite parameters. At our minimum , the data are therefore unable to significantly constrain all the parameters simultaneously in the undersampled regime, and the scatter in the measurements increases dramatically. In this situation one usually wants to reduce the parametric form of the LOSVD to a simple Gaussian. We therefore used the penalized pixel-fitting (hereafter pPXF) method developed by Cappellari & Emsellem (2004) to perform this biasing of the solution towards a Gaussian in a statistically motivated and automatic way, as a function of both the of the spectra, and the observed .
We implemented both the template optimization and the penalization directly into our PXF routine. This works for each individual galaxy spectrum as follows. The direct pixel fitting is a non-linear least-squares problem, for the parameters of the LOSVD, which is solved using a sequential quadratic programming method including bounds (NAG routine E04UNF). At each iteration we find the best fitting linear combination of the stellar templates (with positive weights) convolved with the corresponding LOSVD. This includes the additive polynomials and provides the optimal template for that specific set of kinematic parameters. The residual vector between the observed spectrum and the convolved optimal spectrum is then derived and the penalization term is added to obtain a ‘perturbed’ vector of residuals , which is fed into the nonlinear optimization routine.
The perturbed vector has the form , where is an adjustable parameter of order unity, is the integrated squared deviation of the LOSVD from its best fitting Gaussian (van der Marel & Franx, 1993), and is a robust estimate of the standard deviation of the residuals. The qualitative interpretation of the perturbation can be illustrated by noting that for , an amplitude of 0.1 for or (10% deviation from a Gaussian) requires an improvement of at least 0.5% of the unperturbed to be accepted by the optimization routine as a decrease of the perturbed residuals . Setting provides a non-penalized PXF routine. After extensive testing we adopted a value of , which makes sure the bias is always small compared to the measurement errors, when and . See Cappellari & Emsellem (2004) for details on this pPXF technique.
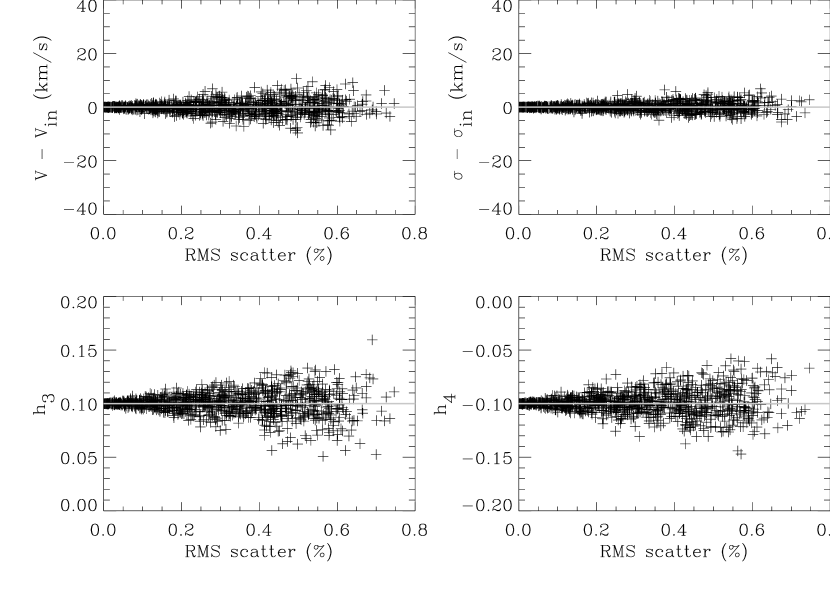
We estimated errors by a Monte-Carlo method in which the kinematic parameters are derived from many realizations of the input spectrum obtained by adding Poissonian noise to a model galaxy spectrum. Figure 2 summarizes the results from such simulations. The significant damping of and towards zero is visible when , but as noted above, this damping effect decreases with increasing and becomes almost negligible for , as we have in the center of most of our galaxies. For a of 60, the errors on , , and are 4 , 5 , 0.03 and 0.03 respectively for , and 8 , 7 , 0.02 and 0.02 respectively for . At higher , the errors scale roughly inversely proportional to . These estimates are only lower limits since they do not account for the effect of template and continuum mismatch (Appendix B.3). Error maps will be made available with the public data release.

2.5.2 The robustness of the kinematic measurements
In order to assess the robustness of the method described above, we conducted an extensive series of tests. We first carefully inspected the fits of the observed spectra obtained for a number of galaxies and these were always found to be excellent (see Appendix B.2 for some illustrations). We checked that the kinematic measurements were not affected by the details of the input library.
Most galaxies required a Legendre polynomial of degree 6 for the pixel fitting. For a few galaxies we had to impose a higher degree (10) to properly fit the spectral shape. We verified that this did not artificially bias the kinematic measurements, even the more sensitive higher order Gauss–Hermite moments and . We also found that applying either multiplicative or additive polynomials led to perfectly consistent results.
All tests were performed with two completely independent implementations of the pPXF method and both gave indistinguishable results. The stellar kinematics of all 48 galaxies was also extracted using FCQ in combination with the gas-cleaning procedure described in Paper II. For galaxies not severely affected by gas emission the two methods produced fully consistent results (see Section B.1).
2.5.3 Comparison with published kinematics
We have already shown in Paper II that the SAURON stellar and gas kinematics are consistent with published data. To have a more global view of the sample, we performed a comparison between the central stellar velocity dispersion from the SAURON data and from published values. We made use of three main sources which include a significant overlap with the SAURON target list, namely the 7 Samurai (Davies et al. 1987), the weighted averaged values compiled by Faber et al. (1997) and the compilation of data gathered from papers by Prugniel and Simien and available via the Hypercat111http://www-obs.univ-lyon1.fr/hypercat/ on-line catalog (Prugniel & Simien 1996). Our measurements were derived by averaging (luminosity-weighted) dispersion values within a circular aperture with a radius of , but imposing a minimum aperture of ( pixels). A linear regression applied to the combined dataset provides a slope of and an average residual of . The average residuals for each individual dataset are all consistent with zero and with the scatter expected from the quadratically summed error bars (see Fig. 3): for the 7 Samurai, for Faber et al. (1997) and for the data of Prugniel & Simien (1996). There is no measurable trend for sub-samples defined either for or . This comparison demonstrates that our (velocity dispersion) measurements do not seem to suffer from any detectable systematics.

3 Observed kinematics
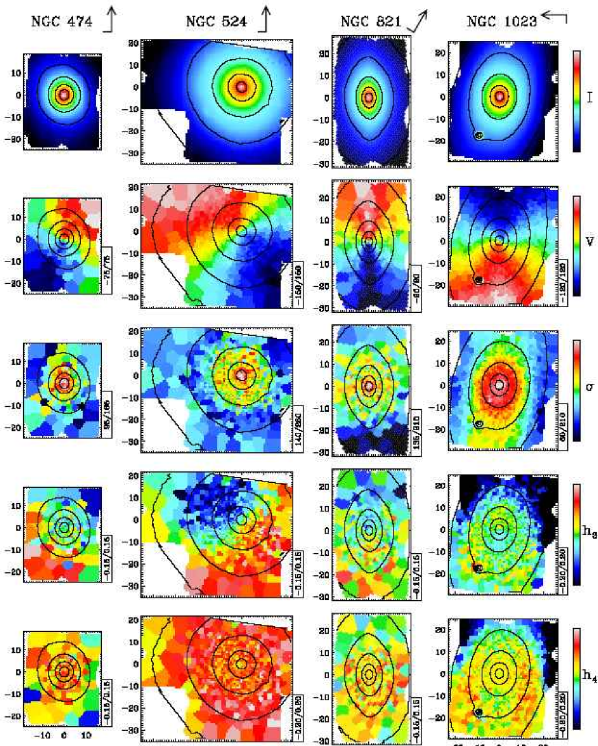
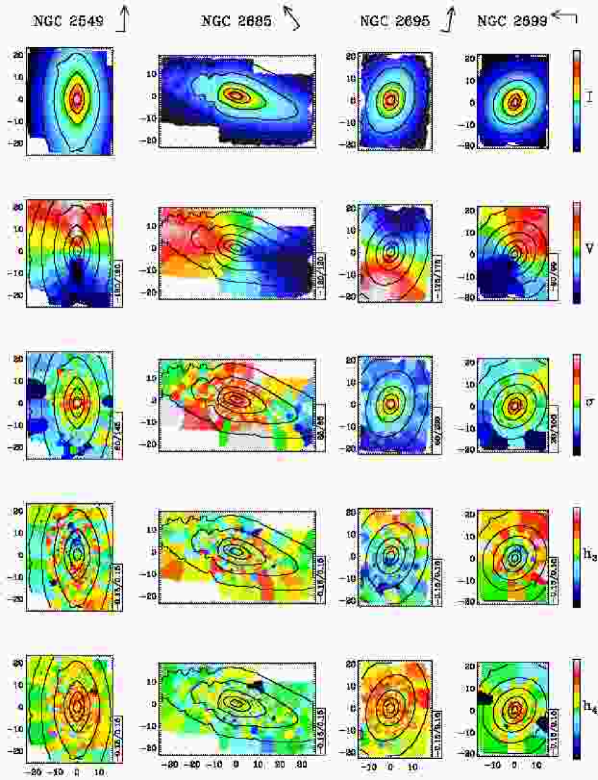
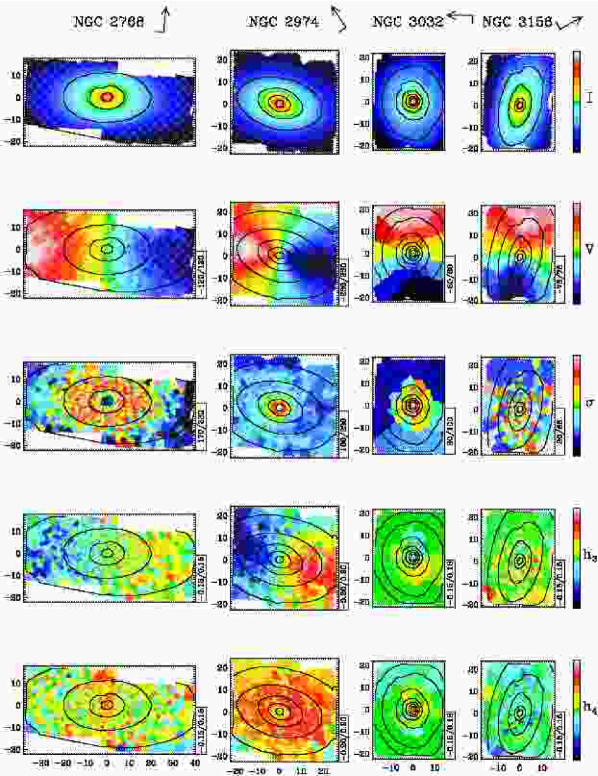
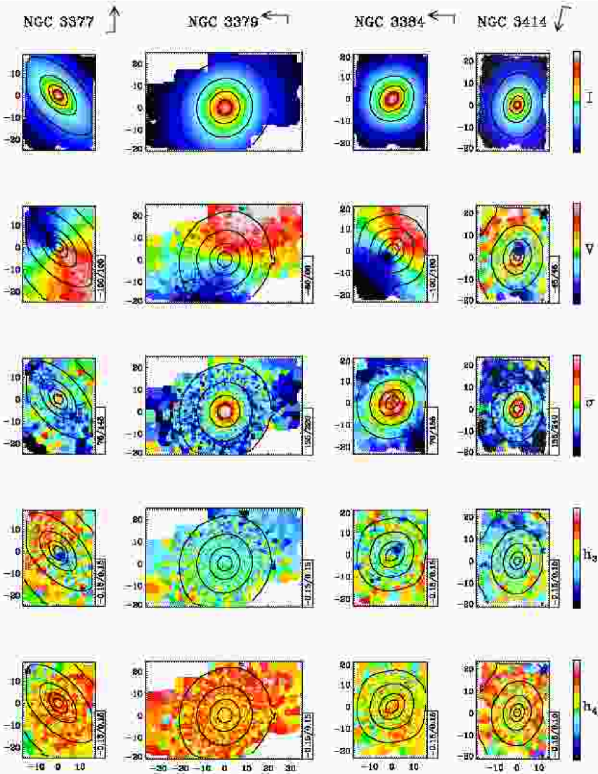
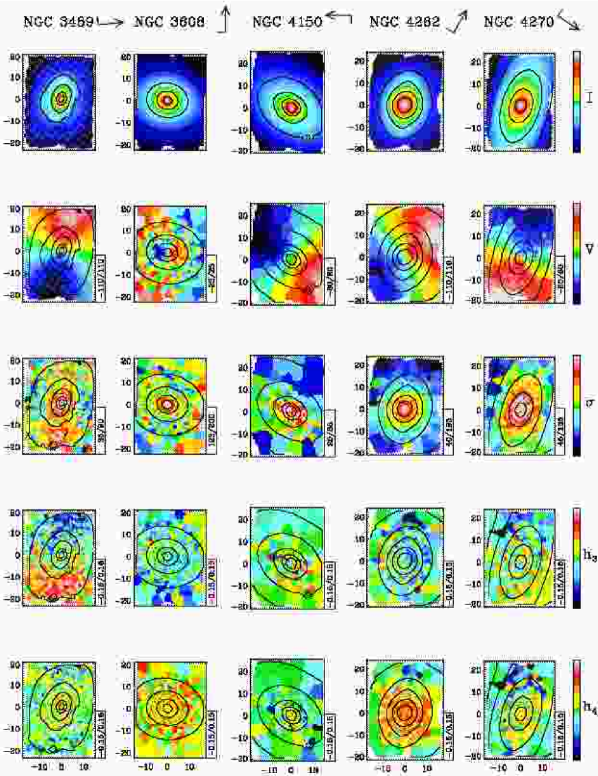
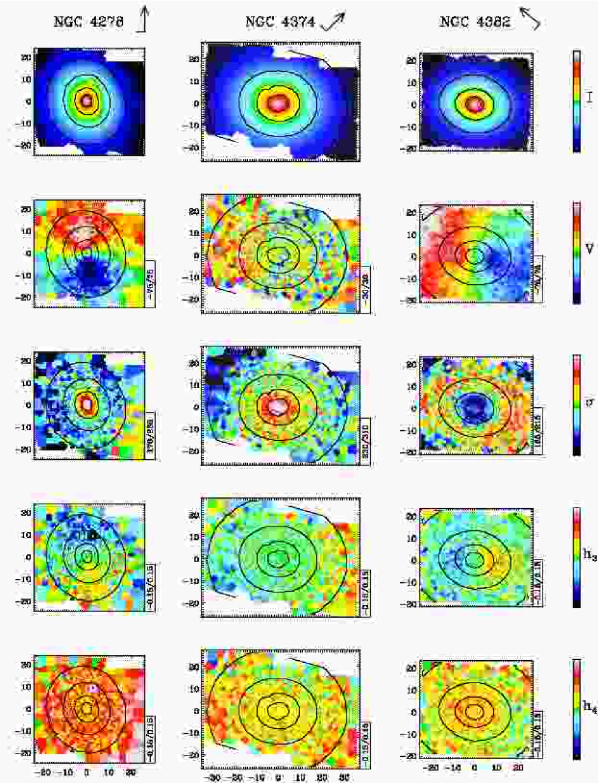
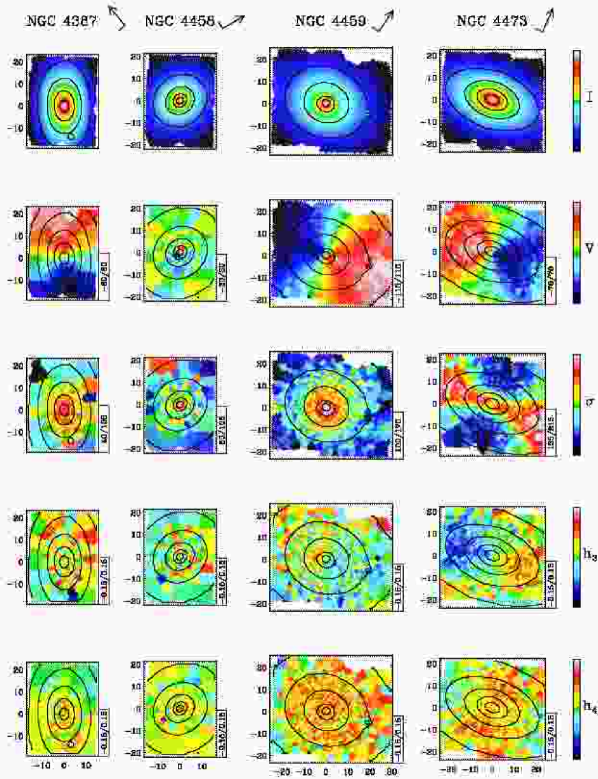
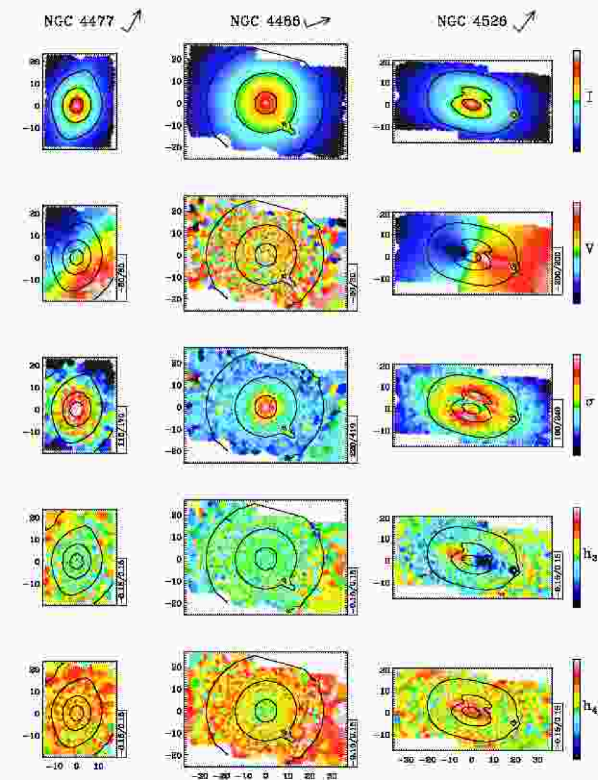
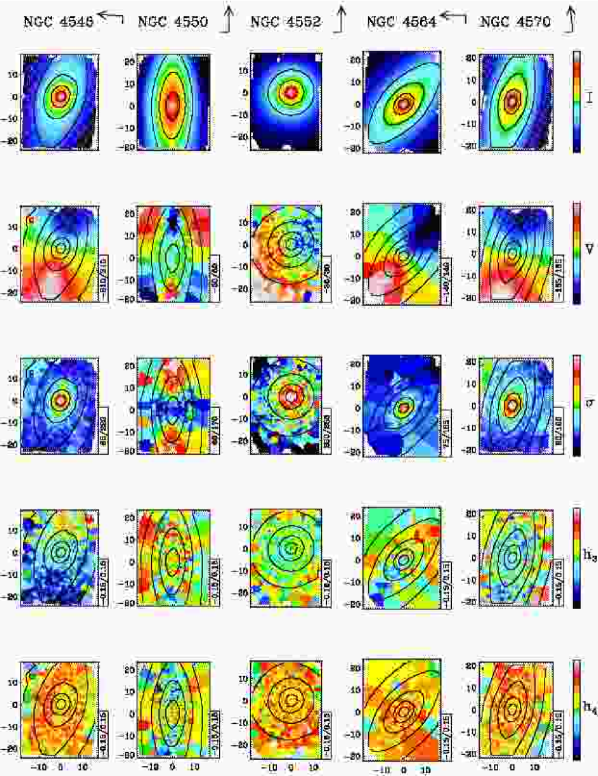
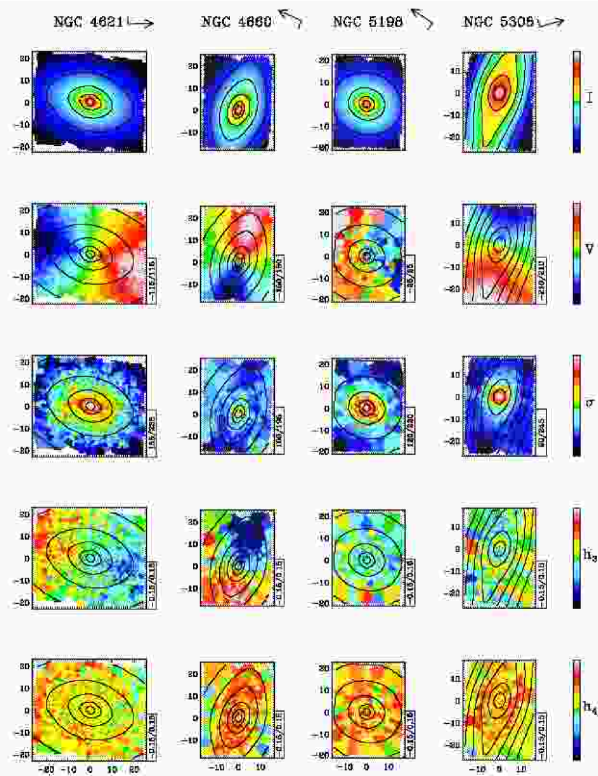
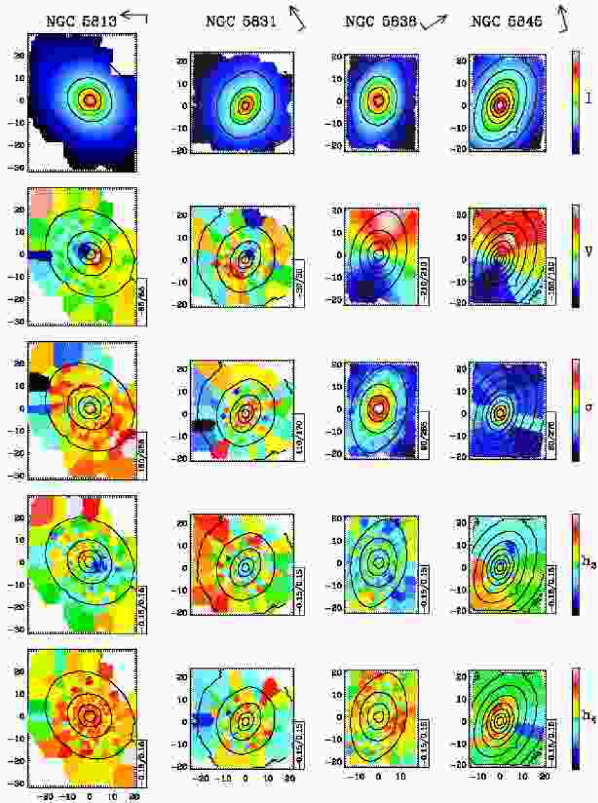
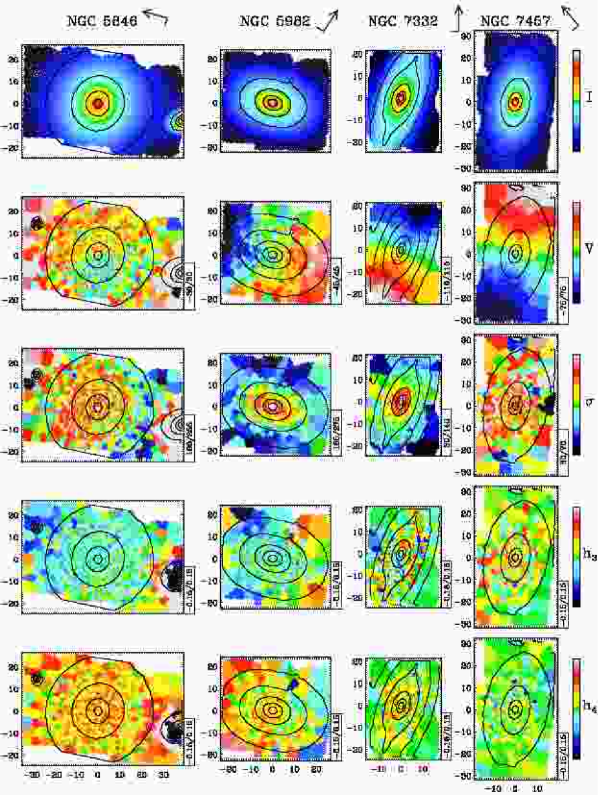
Figures 4a-4l display maps of the absorption-line kinematics of the 48 objects, all plotted on the same angular scale. Not counting multiple exposures, and taking into account overlap of mosaiced exposures, these maps correspond to a total of about 130000 galaxy spectra (about 32000 after adaptive binning). The maps are displayed according to increasing NGC number. In each case we show the total intensity reconstructed from the SAURON spectra, the mean stellar velocity , the velocity dispersion , as well as the Gauss–Hermite moments and , as derived from the pPXF routine. Mean velocities are with respect to estimated heliocentric systemic velocities, the values of which are provided (corrected for the barycentric motion) in Table 3.
The maps display a wealth of structures. Most galaxies in this E/S0 sample show a significant amount of rotation. Some galaxies exhibit isovelocity contours steeply rising towards the photometric major-axis and also tend to show elongated or dumbbell shaped fields, for example NGC 821, NGC 2549, NGC 3377, NGC 3384, NGC 4526, NGC 4660, NGC 5308 and NGC 5845. Other objects have strongly misaligned photometric and kinematic axes, indicative of a non-axisymmetric structure (e.g., a bar). This includes NGC 474, NGC 2699, NGC 3384, NGC 4262 and NGC 4477. Some objects display an increase in along the photometric major-axis associated with a flattening or turnover of the mean velocity gradient along the same axis, for example NGC 4550 and NGC 4473. Kinematically decoupled components (KDCs), showing either a twist in the nuclear kinematic axis or a central velocity field clearly distinct from the rest of the galaxy, are evident in a number of maps, for example NGC 3414, NGC 3608, NGC 4458, NGC 5198, NGC 5813, NGC 5831, NGC 5982, and are detected at smaller (apparent) scales in NGC 4150, NGC 4382, NGC 4621, NGC 7332 and NGC 7457. Some of these were known previously, others are new. Appendix A contains a brief description of these structures, including references to previous long-slit work on these objects. The kinematics presented here will be analysed and discussed in detail in subsequent papers of this series.
4 Concluding remarks
The maps presented in this paper are the result of the first survey of the stellar kinematics of nearby early-type galaxies with an integral-field spectrograph. This unique dataset demonstrates that early-type galaxies display significant and varied structure in their kinematic properties, reinforcing the preliminary evidence shown in Paper II, and the hints provided by earlier long-slit spectroscopy. The present SAURON maps demonstrate that 2D coverage is a prerequisite to properly understand the dynamics of nearby galaxies.
The maps shown here constitute only part of the information contained in the SAURON spectra. The morphology and kinematics of the emission-line gas, as well as maps of the various line-strengths derived from the same observations will be presented in future papers.
Acknowledgements
We thank Kambiz Fathi, Jesus Falcón-Barroso, Marc Sarzi and Glenn van de Ven for their help and support at different stages of this work. It is a pleasure to thank the Isaac Newton Group staff, in particular Rene Rutten, Tom Gregory and Chris Benn, for enthusiastic and competent support on La Palma. The SAURON project is made possible through grants 614.13.003 and 781.74.203 from ASTRON/NWO and financial contributions from the Institut National des Sciences de l’Univers, the Université Claude Bernard Lyon I, the Universities of Durham and Leiden, the British Council, PPARC grant ‘Extragalactic Astronomy & Cosmology at Durham 1998–2002’, and the Netherlands Research School for Astronomy NOVA. This project made use of the LEDA database: http://leda.univ-lyon1.fr/. MB acknowledges support from NASA through Hubble Fellowship grant HST-HF-01136.01 awarded by Space Telescope Science Institute, which is operated by the Association of Universities for Research in Astronomy, Inc., for NASA, under contract NAS 5-26555. MC acknowledges support from a VENI grant awarded by the Netherlands Organization for Scientific Research. The Digitized Sky Surveys were produced at the Space Telescope Science Institute under U.S. Government grant NAG W-2166. The images of these surveys are based on photographic data obtained using the Oschin Schmidt Telescope on Palomar Mountain and the UK Schmidt Telescope.
References
- Afanasiev & Sil’chenko (2002) Afanasiev V. L., Sil’chenko O. K., 2002, AJ, 124, 706
- Alonso et al. (2003) Alonso M. V., Bernardi M., da Costa L. N., Wegner G., Willmer C. N. A., Pellegrini P. S., Maia M. A. G., 2003, AJ, 125, 2307
- Bacon et al. (2000) Bacon R., Emsellem E., Copin Y., Monnet G., 2000, in van Breugel W., Bland-Hawthorn J., eds, ASP Conf. Ser. 195, Imaging the Universe in Three Dimensions. ASP, San Francisco, 173
- Bacon et al. (2001a) Bacon R., Emsellem E., Combes F., Copin Y., Monnet G., Martin P., 2001a, A&A, 371, 409
- Bacon et al. (1995) Bacon R. et al., 1995, A&AS, 113, 347
- Paper I (2001b) Bacon R. et al., 2001b, MNRAS, 326, 23 (Paper I)
- Bender (1990) Bender R., 1990, A&A, 229, 441
- Bender et al. (1994) Bender R., Saglia R. P., Gerhard O. E., 1994, MNRAS, 269, 785
- Bertola et al. (1995) Bertola F., Cinzano P., Corsini E. M., Rix H.-W., Zeilinger W. W., 1995, ApJL, 448, L13
- Bettoni & Galletta (1997) Bettoni D., Galletta G., 1997, A&AS, 124, 61
- Blakeslee et al. (2001) Blakeslee J. P., Lucey J. R., Barris B. J., Hudson M. J., Tonry J. L., 2001, MNRAS, 327, 1004
- Bower et al. (2001) Bower G. A. et al., 2001, ApJ, 550, 75
- Burbidge & Burbidge (1959) Burbidge E. M. & Burbidge G. R., 1959, ApJ, 130, 20
- Busarello et al. (1996) Busarello G., Capaccioli M., D’Onofrio M., Longo G., Richter G., Zaggia S., 1996, A&A, 314, 32
- Cappellari & Copin (2003) Cappellari M., Copin Y., 2003, MNRAS, 342, 345
- Cappellari & Emsellem (2004) Cappellari M., Emsellem E., 2004, PASP, 116, 138
- Caon, Macchetto & Pastoriza (2000) Caon N., Macchetto D., Pastoriza M. 2000, ApJS, 127, 39
- Carollo, Danziger & Buson (1993) Carollo C. M., Danziger I. J., Buson L., 1993, MNRAS, 265, 553
- Cinzano & van der Marel (1994) Cinzano P., van der Marel R. P., 1994, MNRAS, 270, 325
- Copin, Cretton & Emsellem (2004) Copin Y., Cretton N., Emsellem E., 2004, A&A, 415, 889
- Davies (1981) Davies R.L., 1981, MNRAS, 194, 879
- Davies & Birkinshaw (1988) Davies R. L., Birkinshaw M. 1988, ApJS, 68, 409
- Davies et al. (1983) Davies R. L., Efstathiou G., Fall S. M., Illingworth G., Schechter P. L., 1983, ApJ, 266, 41
- Davies et al. (1987) Davies R. L., Burstein D., Dressler A., Faber S. M., Lynden-Bell D., Terlevich R. J., Wegner G., 1987, ApJS, 64, 581
- Debattista, Corsini & Aguerri (2002) Debattista V. P., Corsini E. M., Aguerri J. A. L., 2002, MNRAS, 332, 65
- de Vaucouleurs et al. (1991) de Vaucouleurs G., de Vaucouleurs A., Corwin H. G., Buta R. J., Paturel G., Fouque P., 1991, Volume 1-3, XII, Springer-Verlag Berlin Heidelberg New York,
- Paper II (2002) de Zeeuw P. T., et al., 2002, MNRAS, 329, 513 (Paper II)
- Du et al. (1999) Du Q., Faber V., Gunzburger M., 1999, SIAM Review, 41, 637
- Efstathiou, Ellis & Carter (1980) Efstathiou G., Ellis R. S., Carter D., 1980, MNRAS, 193, 931
- Efstathiou, Ellis & Carter (1982) Efstathiou G., Ellis R. S., Carter D., 1982, MNRAS, 201, 975
- Emsellem et al. (1996) Emsellem E., Bacon R., Monnet G., Poulain P., 1996, A&A, 312, 777
- Faber et al. (1997) Faber, S. M. et al., 1997, AJ, 114, 1771
- Falcón-Barroso et al. (2003) Falcón-Barroso J., Balcells M., Peletier R.F., Vazdekis A., 2003, A&A, 405, 455
- Falcón-Barroso et al. (2004) Falcón-Barroso J. et al., 2004, MNRAS, in press (astro-ph/0402225)
- Fisher (1997) Fisher D., 1997, AJ, 113, 950
- Fisher, Illingworth & Franx (1994) Fisher D., Illingworth G., Franx M., 1994, AJ, 107, 160
- Fried & Illingworth (1994) Fried J. W., Illingworth G. D., 1994, AJ, 107, 992
- Gebhardt et al. (2000) Gebhardt K. et al., 2000, AJ, 119, 1157
- Gerhard (1993) Gerhard O. E., 1993, MNRAS, 265, 213
- Halliday et al. (2001) Halliday C., Davies R. L., Kuntschner H., Birkinshaw M., Bender R., Saglia R. P., Baggley G., 2001, MNRAS, 326, 473
- Hau, Balcells & Carter (1996) Hau G. K. T., Balcells M., & Carter D., 1996, IAU Symp. 171: New Light on Galaxy Evolution, 171, 388
- Hau, Carter & Balcells (1999) Hau G. K. T., Carter D., Balcells M., 1999, MNRAS, 306, 437
- Jarvis et al. (1988) Jarvis B. J., Dubath P., Martinet L., Bacon R., 1988, A&AS, 74, 513
- Jedrzejewski & Schechter (1988) Jedrzejewski R., Schechter P. L., 1988, ApJL, 330, L87
- Jedrzejewski & Schechter (1989) Jedrzejewski R., Schechter P. L., 1989, AJ, 98, 147
- Jones (1997) Jones L. A., 1997, Ph.D. thesis, Univ. North Carolina, Chapel Hill
- Joseph et al. (2001) Joseph C. L. et al., 2001, ApJ, 550, 668
- Kormendy (1984) Kormendy J., 1984, ApJ, 287, 577
- McDermid et al. (2004) McDermid R. et al., 2004, Astron. Nachr., 325, 100
- Michard (1999) Michard R., 1999, A&AS, 137, 245
- Neistein et al. (1999) Neistein E., Maoz D., Rix H.-W., Tonry J. L., 1999, AJ, 117, 2666
- Peletier & Christodoulou (1993) Peletier R. F. & Christodoulou D. M., 1993, AJ, 105, 1378
- Peletier et al. (1990) Peletier R. F., Davies R. L., Illingworth G. D., Davis L. E., Cawson M., 1990, AJ, 100, 1091
- Pellegrini, Held & Ciotti (1997) Pellegrini S., Held E. V., Ciotti L., 1997, MNRAS, 288, 1
- Peterson (1978) Peterson C. J., 1978, ApJ, 222, 84
- Pinkney et al. (2003) Pinkney J. et al., 2003, ApJ, 596, 903
- Prugniel & Simien (1996) Prugniel P., Simien F., 1996, A&A, 309, 749
- Rix & White (1992) Rix H.-W., White S. D. M., 1992, MNRAS, 254, 389
- Rix, Carollo & Freeman (1999) Rix H.-W., Carollo C. M., Freeman K., 1999, ApJL, 513, L25
- Rix et al. (1992) Rix H.-W., Franx M., Fisher D., Illingworth G., 1992, ApJL, 400, 5
- Sargent et al. (1978) Sargent, W. L. W., Young P. J., Lynds C. R., Boksenberg A., Shortridge K., Hartwick F. D. A., 1978, ApJ, 221, 731
- Scorza & Bender (1995) Scorza C., Bender R., 1995, A&A, 293, 20
- Seifert & Scorza (1996) Seifert W., Scorza C., 1996, A&A, 310, 75
- Schechter & Gunn (1979) Schechter P. L., Gunn J. E., 1979, ApJ, 229, 472
- Sil’chenko (1999) Sil’chenko O. K., 1999, AJ, 117, 2725
- Sil’chenko (2000) Sil’chenko O. K., 2000, AJ, 120, 741
- Sil’chenko et al. (2002) Sil’chenko O. K., Afanasiev V. L., Chavushyan V. H., Valdes J. R., 2002, ApJ, 577, 668
- Sil’chenko et al. (2003) Sil’chenko O. K., Moiseev A. V., Afanasiev V. L., Chavushyan V. H., Valdes J. R., 2003, ApJ, 591, 185
- Simien & Prugniel (1997a) Simien F., Prugniel P., 1997a, A&AS, 126, 15
- Simien & Prugniel (1997b) Simien F., Prugniel P., 1997b, A&AS, 126, 519
- Simien & Prugniel (2000) Simien F., Prugniel P., 2000, A&AS, 145, 263
- Simien & Prugniel (2002) Simien F., Prugniel P., 2002, A&A, 384, 371
- Statler (1995) Statler T., 1995, AJ, 109, 1371
- Statler & Smecker-Hane (1999) Statler T. S., Smecker-Hane T., 1999, AJ, 117, 839
- Turnbull, Bridges & Carter (1999) Turnbull A. J., Bridges T. J., Carter D., 1999, MNRAS, 307, 967
- van den Bosch & Emsellem (1998) van den Bosch F. C., Emsellem E., 1998, MNRAS, 298, 267
- van den Bosch, Jaffe & van der Marel (1998) van den Bosch F. C., Jaffe W., van der Marel R. P., 1998, MNRAS, 293, 343
- van der Marel (1994) van der Marel R. P., 1994, MNRAS, 270, 271
- van der Marel & Franx (1993) van der Marel R. P., Franx M., 1993, ApJ, 407, 525
- Vazdekis (1999) Vazdekis A., 1999, ApJ, 513, 224
- Wagner, Bender & Moellenhoff (1988) Wagner S. J., Bender R., Moellenhoff C., 1988, A&A, 195, L5
- Wernli, Emsellem & Copin (2002) Wernli F., Emsellem E., Copin Y., 2002, A&A, 396, 73
Appendix A Description for individual galaxies
Here we briefly comment on the structures observed in the SAURON maps of the E/S0 sample presented in this paper. A thorough and quantitative assessment of these structures will be carried out in subsequent papers. Independently derived velocity and velocity dispersion maps for NGC 3379, NGC 3384, NGC 4550 and NGC 7457 were presented and discussed in Afanasiev & Sil’chenko (2002), Sil’chenko et al. (2002) and Sil’chenko et al. (2003).
- NGC 474:
- NGC 524:
- NGC 821:
- NGC 1023:
-
This is an example of an SB0 galaxy showing anti-correlated with inside , and correlated outside (Bower et al., 2001). There is a strong twist of the zero velocity curve near the center. Stellar kinematics has been previously published by Simien & Prugniel (1997b), Neistein et al. (1999), Sil’chenko (1999), including multiple long-slit data parallel to the major-axis (Debattista, Corsini & Aguerri, 2002). The and maps show significantly negative values on the western side of the galaxy which are not observed by Debattista, Corsini & Aguerri (2002). The cause for this discrepancy is not known, so these features should be confirmed.
- NGC 2549:
-
The central high dispersion region is elongated along the photometric minor-axis, due to the contribution of a rapidly rotating component (see also Neistein et al., 1999; Simien & Prugniel, 1997b; Seifert & Scorza, 1996), exemplified by the isovelocities pinched together along the photometric major-axis, and the correspondingly large values.
- NGC 2685:
-
The kinematics of this famous object (the Helix galaxy; Burbidge & Burbidge, 1959; Peletier & Christodoulou, 1993) are strongly perturbed by extinction due to polar dust lanes on its North East side. The velocity dispersion in the center displays a double peak structure (Simien & Prugniel, 1997b; Hau, Carter & Balcells, 1999).
- NGC 2695:
-
This galaxy shows a high amplitude in in the central 7″, anti-correlated with the mean velocity which has pinched isocontours. The long-slit data of Simien & Prugniel (1997a) contains a hint of this central kinematical structure.
- NGC 2699:
-
The kinematical major-axis in the central region is misaligned from the photometric major-axis. The mean velocity map shows a rapidly rotating component with a local maximum at about 5″ from the centre: within this region, departs significantly from zero and is anticorrelated with . There is a weak hint of such a decoupled structure in the data of Simien & Prugniel (2000).
- NGC 2768:
-
This galaxy shows a rather cylindrical velocity field, with a shallow gradient across the rotation axis (Fried & Illingworth, 1994). There is a pronounced dip in the central dispersion field, also clearly present in the data of Simien & Prugniel (1997b). Significant dust extinction is present north of the center (Michard, 1999).
- NGC 2974:
- NGC 3032:
-
This dusty galaxy shows mild rotation and low dispersion values.
- NGC 3156:
- NGC 3377:
-
The zero velocity curve is slightly misaligned with the photometric minor-axis of the galaxy (Paper I; Copin, Cretton & Emsellem 2004), giving the modest minor-axis rotation observed in the long-slit study of Halliday et al. (2001), and the dispersion map shows a clear elongation along the photometric minor-axis of the galaxy.
- NGC 3379:
- NGC 3384:
-
The dispersion map exhibits a dumbbell-like shape, coincident with a rapidly rotating component in the central 5″ (Fisher, 1997; Busarello et al., 1996), with a strong anticorrelation signature in . The velocities are nearly cylindrical in the outer part of this galaxy classified as SB0 (Paper II). Our map shows a slight dip at the centre, consistent with the long-slit profile of Fisher (1997). Our map is consistent with being positive everywhere, in contrast to the measurements of Pinkney et al. (2003).
- NGC 3414:
-
A central counter-rotating component is visible in the velocity map of this peculiar galaxy (Arp 162), with the field showing a corresponding sign reversal just outside this kinematically decoupled structure. The decoupled nature of this central component has not been previously reported in the literature, although long-slit data exist (Bertola et al., 1995).
- NGC 3489:
-
The photometry is perturbed by dust extinction. The effect is not evident in the kinematic maps although it may explain the local increase in the dispersion map at about 15″ West from the centre (Caon, Macchetto & Pastoriza, 2000). Inside 4″ the opening angle of the iso-velocities decreases, indicating a fast rotating structure. decreases inwards, with a turn over at a radius of about 4″, inside of which it shows a small increase.
- NGC 3608:
- NGC 4150:
-
The dispersion map exhibits a double peaked structure along the major-axis, which corresponds to a region where the velocity gradient flattens out. A closer look at the central 5″ reveals the presence of a counter-rotating structure.
- NGC 4262:
-
This strongly barred galaxy has a remarkably regular velocity field, the long-axis of the bar being clearly misaligned with the kinematic minor-axis. changes sign twice along the major-axis.
- NGC 4270:
-
At large radii, the velocity field is close to cylindrical. Inside 10″ the opening angle of the iso-velocity contours decreases, with a corresponding increase in the amplitude. The velocity curve in the central 5″ is flat (Simien & Prugniel, 1997a).
- NGC 4278:
-
This galaxy shows fairly regular kinematics, with the mean velocity decreasing at radii larger than 10″ along the major-axis (Schechter & Gunn, 1979; Davies & Birkinshaw, 1988). The central dispersion peak is elongated along the major-axis. The map reveals relatively high positive values everywhere except inside 6″ where it drops significantly, consistent with the long-slit data published by van der Marel & Franx (1993), but not with Bender et al. (1994).
- NGC 4374:
-
The velocity map is consistent with everywhere in the SAURON field (Davies, 1981), except for a very weak large-scale gradient and a rotation pattern in the central 3″. With NGC 4278 and NGC 4486, this is among the galaxies in the SAURON E/S0 sample with the highest relative contribution from emission lines.
- NGC 4382:
-
The velocity field is nearly cylindrical in the outer part. It exhibits a strong twist inwards, with the signature of a decoupled component in the central 2″, where there is also a sign reversal in (Bender et al., 1994). A clear counter-rotation is visible from higher resolution OASIS maps (McDermid et al., 2004). The dispersion shows a remarkably strong depression in the central 8–10″, clearly seen in Fisher (1997). There is a ring of positive values at about 8″, hinted in the long-slit data of Bender et al. (1994).
- NGC 4387:
- NGC 4458:
-
The KDC is clearly visible in the SAURON velocity map of this galaxy (see Halliday et al., 2001), and the velocity outside 5″ is consistent with being equal to zero.
- NGC 4459:
-
The small opening angle of the iso-velocities in the central 10″ corresponds to a region where is anti-correlated with , and has a rather high amplitude (see Peterson, 1978).
- NGC 4473:
-
The velocity dispersion field exhibits a complex morphology, with a region of high dispersion along the major-axis which widens at larger radii, and a central drop inside 3″, not observed in Bender et al. (1994). The widening in the dispersion map is particularly significant outside 10″ where the mean velocity is observed to decrease outwards. This also corresponds to a region of lower .
- NGC 4477:
-
The SAURON field of view zooms in on the bar of this galaxy where the kinematic and photometric major-axis are misaligned and the velocity field shows a significant twist of its zero velocity curve within the central 4″ and nearly cylindrical rotation outside. Jarvis et al. (1988) noticed the existence of considerable minor-axis rotation as well as a flat velocity dispersion profile with a central dip which is not visible in our data.
- NGC 4486:
- NGC 4526:
-
This S0 object has a prominent dust disc which is not only visible in the reconstructed SAURON image, but also influences the observed kinematics. The dumbbell shape in the dispersion map is due to a fast rotating stellar component, well visible in the velocity map. The data of Pellegrini, Held & Ciotti (1997) also shows the drop in velocity between 10″and 20″, which corresponds to this component. reverses sign at about 20″ along the major-axis.
- NGC 4546:
-
The velocity field of this barred galaxy displays a regular rotation pattern (Bettoni & Galletta, 1997), anticorrelated with .
- NGC 4550:
-
This object has two counter-rotating stellar disks of similar mass (Rix et al. 1992) which, at the spectral resolution of SAURON, produce a large region with a near zero mean velocity and a dispersion increasing outwards along the major-axis. Note the extraordinary decoupling revealed by SAURON, the outer disk being counter-rotating with respect to the main body of the galaxy further away from the equatorial plane, also noticed by Afanasiev & Sil’chenko (2002). is significantly lower outside 5″ along the major-axis.
- NGC 4552:
-
We detect weak rotation in this galaxy and a corresponding weak correlated field (Bender et al., 1994). The zero velocity curve is significantly twisted.
- NGC 4564:
- NGC 4570:
- NGC 4621:
-
This object is another case showing indication for a disk-like component with strong anticorrelation between and (Bender, 1990; Bender et al., 1994). A counter-rotating component is also detected inside 2″, previously discovered with adaptive optics assisted integral-field spectroscopy (Wernli, Emsellem & Copin, 2002).
- NGC 4660:
-
The velocity map shows the superposition of two rapidly rotating components: an inner one inside 5″ and a thicker structure outside 7″. This galaxy was used by Bender et al. (1994) as a prototype for discy ellipticals, due to its pointed isophotal shape and the strong anticorrelated with .
- NGC 5198:
-
The velocity field reveals a central KDC, rotating nearly perpendicularly with respect to the outer body, both being misaligned with respect to the photometric axes of the galaxy. A “suspect” central velocity profile was noticed by Jedrzejewski & Schechter (1989).
- NGC 5308:
-
This is a typical case of a close to edge-on disk galaxy showing a rapidly rotating component (Seifert & Scorza, 1996) and a double sign reversal in . The central dispersion structure is box-shaped.
- NGC 5813:
-
A galaxy with a well-known KDC (Efstathiou, Ellis & Carter, 1980, 1982; Kormendy, 1984; Bender et al., 1994) evident in the SAURON velocity map (see Paper II). The galaxy has negligible rotation at larger radii, and shows weak evidence for minor-axis rotation. The dispersion field also shows an unusual ring-like depression at about 5″ from the center.
- NGC 5831:
- NGC 5838:
-
This boxy galaxy is a strong rotator, with a double sign reversal in . Minor-axis spectra of Falcón-Barroso et al. (2003) show a small amount of rotation, very probably due to the extinction produced by a dust lane most prominent on the South-West side within 3″ of the centre.
- NGC 5845:
-
The velocity field of this galaxy shows two distinct peaks on each side, at about 2″ and 8″ from the center. These features are barely detected in the long-slit data of Simien & Prugniel (2002). The central kinematically decoupled structure corresponds to a lower dispersion and a peak in .
- NGC 5846:
-
This is an example of a giant elliptical with a very low (but present) rotation (Carollo, Danziger & Buson, 1993), and a high central dispersion. The SAURON field of view includes a foreground star and a companion (NGC 5846A) North and South of its nucleus, respectively. is high everywhere, confirming the trend observed by Bender et al. (1994).
- NGC 5982:
-
The SAURON data confirm the presence of a KDC first detected by Wagner, Bender & Moellenhoff (1988). The SAURON maps reveal that the central rotation axis seems to be nearly perpendicular to the rotation of the main body, the central structure following this orientation.
- NGC 7332:
-
Another strongly boxy galaxy with a KDC (counter-rotating) in the central 3″ (see Falcón-Barroso et al., 2004), and a high central dispersion region elongated along the major-axis (see also data by Fisher, Illingworth & Franx, 1994; Seifert & Scorza, 1996; Simien & Prugniel, 1997b; Sil’chenko, 1999).
- NGC 7457:
-
The velocity map exhibits a nearly cylindrical rotation, as well as a central counter-rotating structure (see also data by Simien & Prugniel, 1997b).
Appendix B Tests of the kinematics extraction
B.1 Comparison of pPXF with FCQ
In Fig. 5l we show a comparison between the stellar kinematics recovered via FCQ and our pPXF technique (see Sect. 2.5.1). We illustrate this with the case of NGC 4473 which is free of (detected) emission lines (see Fig. 6l). In Fig. 5l we present the major (left panels) and minor-axis (right panels) profiles for the first four extracted parameters, namely , , and . The agreement between the FCQ (crosses with error bars) and pPXF (solid lines) methods is excellent except for a slight discrepancy observed in the profiles. FCQ tends to provide values systematically lower than pPXF. Although this offset depends significantly on the continuum subtraction procedure (e.g., degree of polynomial) and the spectral domain (including the region around H or not) used in FCQ, we could not fully reconcile the FCQ and pPXF measurements. This difference in the measurements may be related to the negative bias in the determination of via FCQ, when the LOSVD is not well sampled, noticed by Joseph et al. (2001) (see their Fig. 13) and in Pinkney et al. (2003).

B.2 Examples of resulting fits
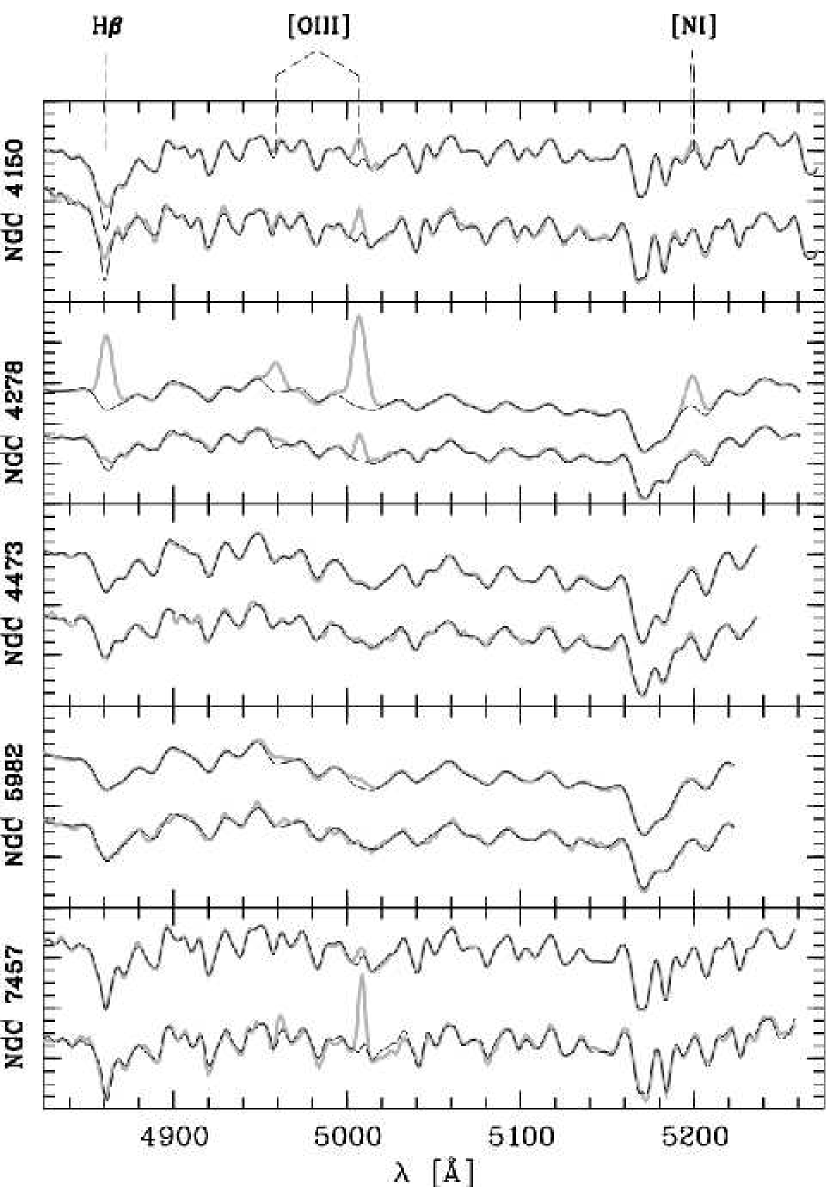
Here we present a few illustrative examples of spectral fits obtained using the pPXF and optimal fitting procedure described in Sect. 2.5. Figure 6l displays the results obtained for five galaxies in the SAURON E/S0 sample, probing a range in absolute luminosity, absorption-line depths and degree of contamination by emission lines:
-
•
NGC 4150 which has rather deep H absorption lines and some contribution from emission lines,
-
•
NGC 4278 which shows very significant emission line contamination,
-
•
NGC 4473, an intermediate luminosity elliptical with no detected emission lines,
-
•
NGC 5982 as the brightest galaxy in the SAURON E/S0 sample, and
-
•
NGC 7457 for a case of a low dispersion galaxy with detected emission.
In each case, we present a central spectrum as well as a spectrum at a radius of about 10″ (chosen to lie at 45°from the photometric major-axis). As mentioned in Sect. 2.5, all fits are excellent, with local discrepancies between the fitted and observed spectra emphasizing the presence of emission lines (H, [O iii], [N i]). The use of an individual optimal template spectrum for each SAURON spectrum is crucial as line depths can vary significantly within the SAURON field of view. These plots demonstrate the flexibility of our procedure.
B.3 Template mismatch
The effect of template mismatch is difficult to quantify, as galaxy spectra are a complex (luminosity-weighted) mix of different stellar populations with different velocity distributions. We can however perform some simple tests by examining the change in the measured stellar kinematics as we perturb the spectral shape of either the stellar template or the galaxy spectrum.
We performed this in a way similar to the procedure described by Rix & White (1992). We first chose an optimal template representative of the ones obtained for the galaxies in the E/S0 SAURON sample. We added a random Gaussian perturbation to that template before convolving it with a LOSVD parametrized as a Gauss-Hermite series to simulate a ‘galaxy’ spectrum. In contrast to what is done in Rix & White (1992), we preferred not to add any additional Poissonian noise, to isolate the sole effect of template mismatch. We then retrieved the kinematic parameters with our pPXF routine (see Sect. 2.5.1) to finally compare the extracted and input values. This is repeated for many different Monte Carlo realizations of the perturbation.
In Figure 7l, we show such a comparison for an input velocity of , a dispersion of , and . The plots show the retrieved kinematics versus the RMS of the residual mismatch between the simulated ‘galaxy’ spectrum and the best fitting model. The maximum uncertainty in the retrieved kinematic parameters increases almost linearly with the scatter in the fit. In the case of the SAURON data presented in this paper, we measured (on the highest spectra where template mismatch dominates over Poissonian noise), a typical residual mismatch in the fit of about 0.4% RMS , with a maximum value of 0.55%. The above test then indicates an upper limit to any systematic error on and of , although in practice our actual error is likely to be significantly lower than this maximum.