Molecular gas in the galaxy M 83 ††thanks: Based on observations collected with the Swedish-ESO Submillimetre Telescope at the European Southern Observatory, La Silla, Chile
We present the kinematics of the molecular gas in the barred spiral galaxy M 83 (NGC5236). The study is based on 12CO(=1–0 and 2–1) observations with the Swedish-ESO Submillimetre Telescope (SEST). Iso-velocity maps of the entire optical disk, 10 10 or 13 13 kpc, are produced. They show the pattern of an inclined, rotating disk, but also the effects of streaming motions along the spiral arms. A dynamical mass of about 6 1010 M⊙ is estimated by fitting the rotation curve of an exponential disk model to these data. The gas constitutes about 13% of the disk mass. The pattern speed is determined from the residual velocity pattern The locations of various resonances are discussed. The molecular gas velocity dispersion is determined, and a trend of decreasing dispersion with increasing galactocentric radius is found. A total gas (H2+H i+He) mass surface density map is presented, and compared to the critical density for star formation of an isothermal gaseous disk. The critical density is exceeded in the spiral arms, but not in the interarm regions. The locations of Giant Molecular Associations (GMAs) and H ii regions are consistent with this scenario of dynamically induced star formation.
Key Words.:
Galaxies: individual: (M83; NGC5236) - Galaxies: spiral - Galaxies: kinematics and dynamics - Galaxies: structure - Galaxies: ISM - Radio lines: galaxies1 Introduction
The kinematics of the gas in a galaxy provides fundamental clues to its dynamics and evolution. An excellent probe of the kinematics of disk galaxies is the molecular gas (as traced by e.g. CO radio line emission). Since the molecular gas is collisional, the random motions are reduced and the disk is dynamically cooled. Because of this the molecular gas is able to respond, both quickly and strongly, to changes in the gravitational potential. Atomic hydrogen is also a tracer which is often used, but since the scale height of H i is relatively large compared to that of the molecular gas it is less sensitive to the dynamics in the disk, and more affected by forces not confined to the disk plane (e.g., shock waves from supernova explosions). Also, the centers of galaxies usually show very little H i emission. Starforming regions give rise to a number of emission lines in the optical regime that can be used to trace the motion of the disk. However, since the kinematics of these regions are affected by the starformation process it can be difficult to interpret such data. Also, the high extinction in starforming regions further complicates matter.
The molecular gas kinematics is also an important probe of the star formation process. A spiral density wave is an efficient mechanism for concentrating atomic and molecular hydrogen in spiral features, but in order to initiate the star formation, the disk also needs to be compressed in the vertical direction. In this smaller-scale process, dissipative processes like cloud-cloud collisions, interaction with the galactic magnetic field, and the Jeans instability help enhancing the density. Once a certain threshold density is reached, massive star formation is initiated since the velocity dispersion no longer can neutralize the self-gravity of the gaseous disk (Toomre, 1964; Kennicutt, 1989).
Two large surveys of the kinematics of spiral galaxies using CO radio line emission have recently been completed: “BIMA SONG” done with the BIMA interferometer (Regan et al., 2001; Helfer et al., 2003) and “The Virgo High-Resolution CO Survey” done with the Nobeyama interferometer (Sofue et al., 2003). Both surveys noted that some galaxies have a “twin-peaks” distribution of the molecular gas in the center, and it is suggested that this is a result of molecular gas agglomeration at the inner Lindblad resonance. More results on the kinematics will come in subsequent papers from these groups. Many other galaxies have been observed in CO with interferometers and among the most detailed studies of the global kinematics are studies done on M 100 with the IRAM interferometer (Garcia-Burillo et al., 1998) and one on M 51 with the OVRO interferometer (Aalto et al., 1999). In M 100 the kinematics of the molecular gas was modeled using a hydrodynamic code, and it was shown that the stellar bar and the spiral pattern have a common pattern speed, while the nuclear bar is rotating significantly faster. In M 51 the authors found streaming motions of very high velocities (60–150 km s-1) and that two pattern speeds coexist - one main mode and a second due to the interaction with NGC 5195.
Detailed studies done with single-dish telescopes of the dynamics of nearby galaxies with low inclinations are rare. The most well-studied galaxy is M 51, which has been observed in CO radio line emission with the Onsala 20m (Rydbeck et al., 1985), the IRAM 30m (Garcia-Burillo et al., 1993a), and the Nobeyama 45m telescope (Kuno et al., 1995; Kuno & Nakai, 1997). The last group showed that the gaseous disk is gravitationally unstable in the arms, but not in the inter-arm regions, and that the deviations from circular motion seen in the gas are in accordance with density-wave theory.
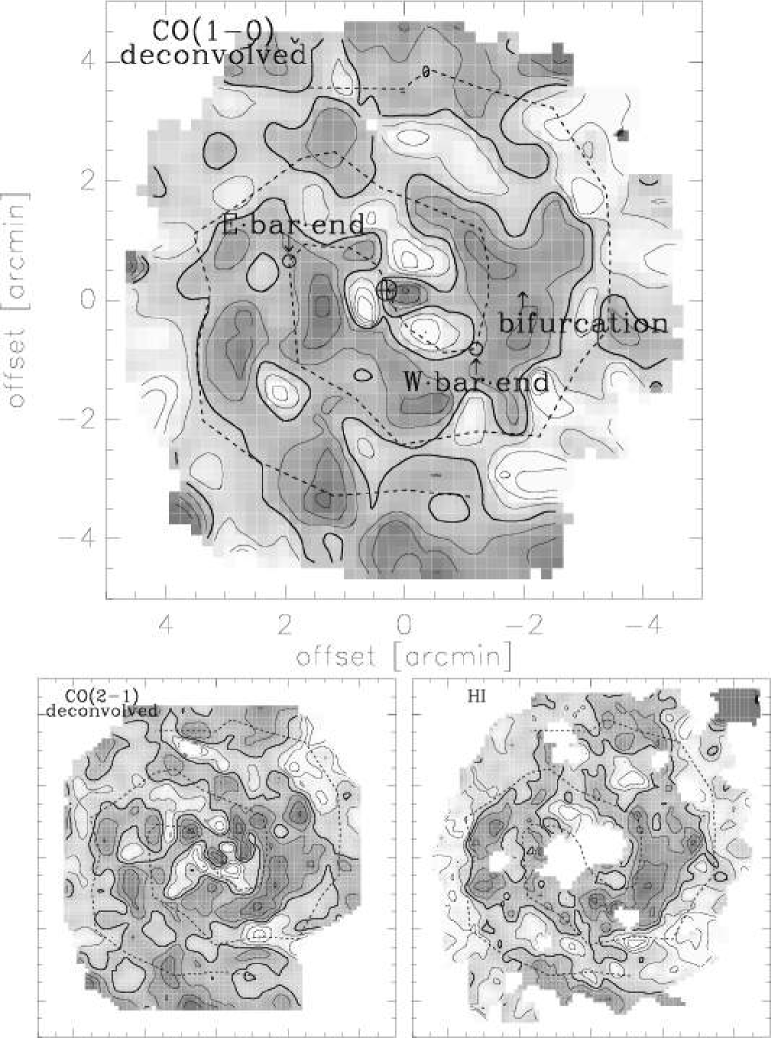
The kinematics of M 83 has been observed using many tracers. In particular, CO radio line data results have been presented by several authors; see Lundgren et al. (2004) (Paper I) for a summary of CO observations of M 83. Combes et al. (1978) produced the first CO rotation curve based on data in 7 positions. Position-velocity diagrams of the nuclear region along the minor and major axes have been published by Handa et al. (1990), Israel & Baas (2001), and Dumke et al. (2001). Petitpas & Wilson (1998) presented channel maps of the central , and discussed inner Lindblad resonances and gas flow along the bar. Lord & Kenney (1991) used the OVRO interferometer to observe the eastern arm of M 83 in the CO(=1–0) line. They presented channel maps and discussed the relation between CO, H, and H i. The same authors also observed the western bar end (Kenney & Lord, 1991), and they discussed, among other things, orbit crowding. Rand et al. (1999) revisited the eastern arm, extended the map, and discussed streaming motions and disk stability. The most extensive work on the molecular gas kinematics prior to this paper was done by Crosthwaite et al. (2002), who mapped the disk in CO(=1–0 and =2–1) and presented a CO rotation curve, iso-velocity patterns, and velocity dispersion patterns covering the optical disk.
The velocity pattern in H i, both in the disk and in the H i envelope, and discussions of an H i warp have been presented in papers based on both interferometer data (Rogstad et al., 1974) and single-dish data (Huchtmeier & Bohnenstengel, 1981). Tilanus & Allen (1993) compared velocity information obtained from H i and H data, and discussed shocks, large scale H2 dissociation, and the relation between the dust and H i.
Comte (1981) and de Vaucouleurs et al. (1983) presented Fabry-Perot H observations of M 83. The latter group also discussed the pattern speed, the mass distribution, and the residual velocities.
In this paper, we present the kinematics of the molecular gas, as seen in the CO(=1–0) and CO(=2–1) lines, in the galaxy M 83. Two-dimensional velocity distribution and velocity dispersion maps are shown, and a rotation curve based on the assumption of an exponential disk mass distribution is derived. By subtracting the circular velocities from the observed data we get the residual velocities. Lastly, the location and formation of GMAs and the stability of the gaseous disk are discussed.
2 Observations
Our CO(=1–0 and 2–1) observations were presented in Paper I. The data cover the entire optical disk, and is sampled at intervals of 7–11. The spacing is small enough to facilitate the use of a mem-deconvolution technique. The data grid is oriented along the equatorial coordinate system and centered on the coordinates , , which is the optical center given by de Vaucouleurs et al. (1976). Since the grid spacing is small relative to the beam size, we can gain in S/N by convolving the raw data sets, without significantly affecting the angular resolution. The results in this paper are therefore based on convolved CO(=1–0) data (convolution kernel FWHM 20, final angular resolution 49), convolved CO(=2–1) data (kernel 15, resolution 27) and two mem-deconvolved CO(=1–0) and CO(=2–1) data sets with angular resolutions of 22 and 14, respectively. In order to compare data at the same angular resolution, data cubes with angular resolutions of 49 (based on the raw data sets) and 27 (based on the mem-deconvolved data sets) were produced. The CO(=2–1) data have been corrected for emission in the error beam. For a detailed description of the data, see Paper I.
| Morphological Typea | SAB(s)c |
|---|---|
| IR center:b | |
| R.A. (J2000) | |
| Decl. (J2000) | |
| LSR systemic velocity (opt)c | 506 km s-1 |
| Distanced | 4.5 Mpc |
| Position anglec | 45° |
| Inclinationf | 24° |
| Holmberg diameter (D0)e | 146 |
| e | 7.7 |
| g | 3.9 |
| a de Vaucouleurs et al. (1976); b Sofue & Wakamatsu (1994); c Comte (1981); d Thim et al. (2003); e Huchtmeier & Bohnenstengel (1981); f Talbot et al. (1979); g Lundgren et al. (2004) | |
3 Kinematics
3.1 Channel maps
In Fig. 1 channel maps ranging from 400 to 620 km s-1 of the mem-deconvolved CO(=1–0) data cube, where each map covers a velocity range of 15 km s-1, are shown. They show the expected overall pattern of an inclined, rotating disk. In addition, the arms are clearly resolved. On the global scale the most notable deviation from the expected is the outer arm on the NW side, which seems slightly offset from the expected velocity, an indication of streaming motions or a warp. The prominent central region is visible throughout the entire velocity range. The emission peak moves from (+9″,+2″) to (-4″,-8″) relative to the IR center (See Table 1) - a shift of 21″, which corresponds to 460 pc. These positions match within a few arcseconds the two nuclear components found by Petitpas & Wilson (1998) in their CO(=3–2 and 4–3) data.
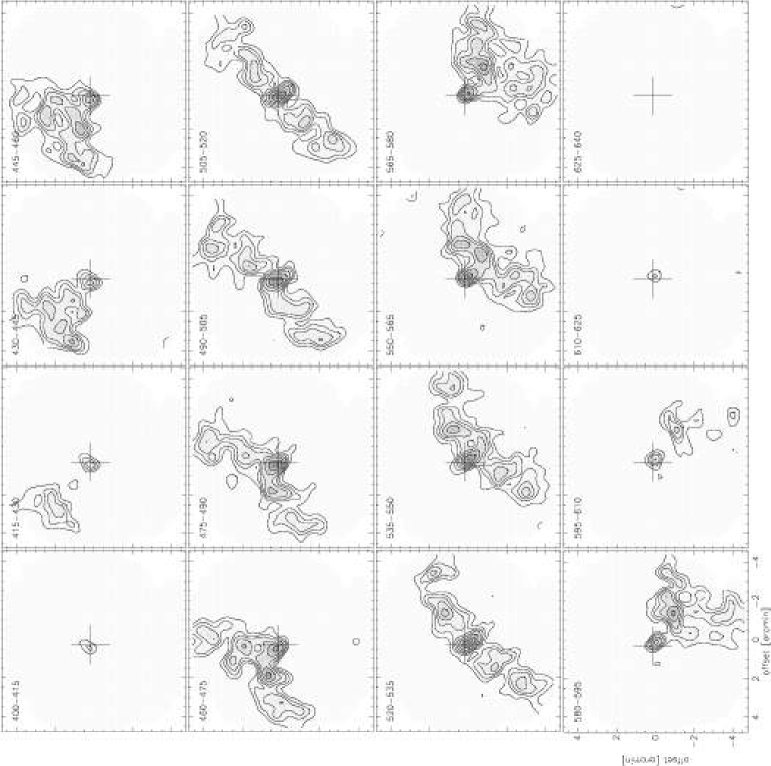
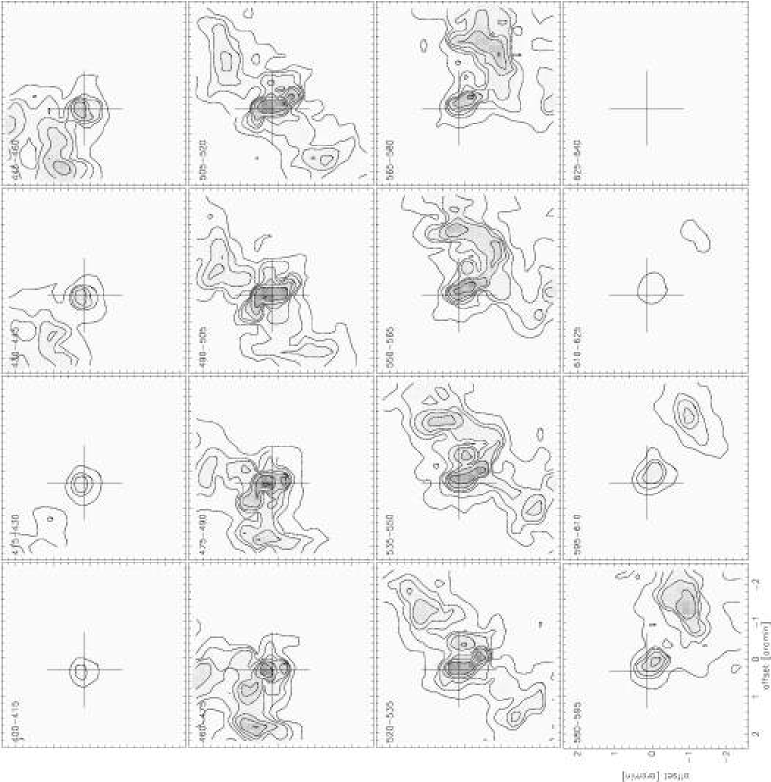
In Fig. 2 the same channel maps in the mem-deconvolved CO(=2–1) data cube are shown. In order to highlight the finer details provided by the better resolution in this data set, only the inner 140″140″ are shown. Here, the two central components are clearly resolved.
3.2 Rotation curve and kinematic fit
There exist many procedures for measuring the velocity of a spectral feature (see Sofue & Rubin (2001) for a recent review of methods). We chose the intensity-weighted-velocity method to be able to directly compare with results obtained using the same method applied to other velocity tracers, such as H and H i. For a galaxy with a low inclination, like M 83, most methods give almost identical rotation curves. However, in the nuclear region, where the velocity changes very fast with respect to the beam size, it is likely that the intensity-weighted-velocity method underestimates the true rotational velocity. In Section 3.5.1 we also derive the rotation curve using the envelope-tracing method (Sofue et al., 1997).
In each spectrum the “average” velocity is estimated by calculating the intensity-weighted velocity. In order to minimize the effect of baseline variations, a sliding-window technique was used, where at each position integration was performed inside a velocity window whose center and width depend on the position within the galaxy. We checked carefully that the window always covered all of the emission.
To obtain the best-fit circular velocities in the galaxy, the kinematic data have to be compensated for inclination, position angle, systemic velocity, and kinematic-center offset. In order to estimate the values of these parameters, a rotation curve is introduced to which the velocity data sets can be compared. Here we have chosen the theoretical rotation curve produced by an exponential disk potential. The circular velocities in such a disk are given by:
| (1) |
where is the total mass of the exponential disk, the disk scale length, and (Binney & Tremaine, 1987). and are the modified Bessel functions of the first and second kind, respectively.
We expect that the gas will not move in circular orbits in the bar region. Therefore, data obtained within 1′ of the nucleus were excluded in the fit. In order to minimize the influence of radial motions data from areas further away than from the major axis were also excluded. With this method it is not possible to determine the inclination angle, since the unique effects of variations of this parameter are seen as a changing opening angle of the iso-velocity contours along the minor axis111Along the major axis, an increase of inclination results in a higher rotation curve, which can also be interpreted as a larger disk mass – thus a degenerate problem.. We adopted an inclination angle of 24, which is in agreement with both the H i iso-velocity contours and optical isophotes (Comte, 1981). All other parameters were fitted simultaneously to the kinematic data sets obtained from the convolved CO(=1–0) and CO(=2–1) data cubes. The fitting errors were minimized using a Levenberg-Marquardt method (Press et al., 1992). We found that the kinematic center lies about SE of the IR center (see Table 1), but within the errors of the fit the two positions agree. The rotation curves derived for the south-western and north-eastern quadrants separately differed markedly in the inner 1′. This discrepancy disappeared when the kinematic offset parameters were fixed to match the location of the IR center. We fitted the remaining parameters, and the best-fit values (with errors) are given in Table 2. The same procedure was applied to the mem-deconvolved data sets, and the same results were obtained (within the errors). Our results agree closely with those obtained from the H i data by Tilanus & Allen (1993) (hereafter TA).
| CO(=1–0) | CO(=2–1) | |||
| Value | Error (1) | Value | Error (1) | |
| Kinematic center | IR center | fixed | IR center | fixed |
| Position angle | ||||
| Inclination | fixed | fixed | ||
| Systemic vel. (LSR) [km s-1] | 0.6 | 0.7 | ||
| Disk mass [ M⊙] | 5.9 | 0.7 | 6.2 | 0.8 |
| Disk scale length [kpc] | 2.7 | 0.2 | 2.9 | 0.2 |
The rotation curve fit results in a dynamical mass of 6 1010 . (Crosthwaite et al. (2002) derived a dynamical mass of 8 1010 (for a distance of 4.5 Mpc) using a Brandt model rotation curve.) The total mass of molecular and atomic hydrogen gas within the Holmberg limit (, see Paper I) constitutes about 9%2% of the estimated disk mass. Including helium the total gas mass is about 13% of the disk mass. This fraction depends somewhat on the choice of the inclination angle e.g., changing the inclination from 24 to 26 degrees increases the hydrogen gas fraction from 9% to 10%.
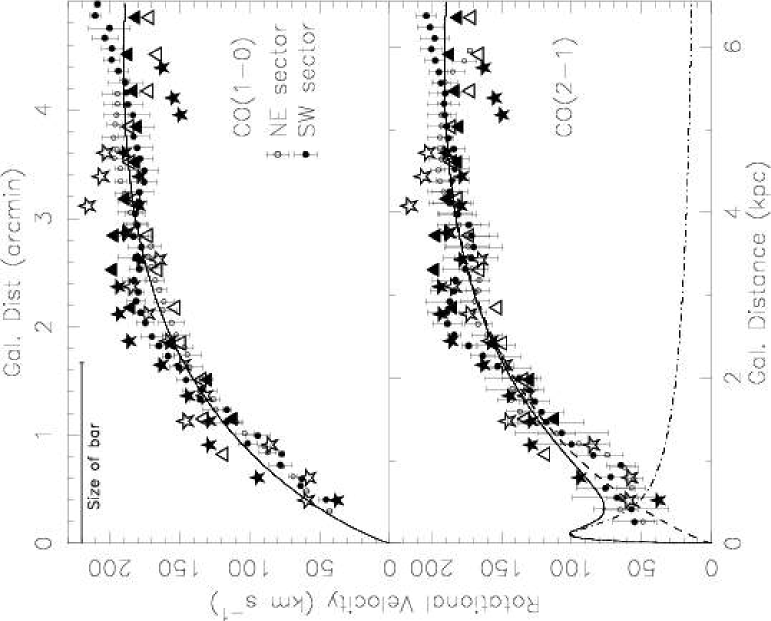
The circular velocities rise linearly (and slightly slower than the model rotation curve) in the central regions and level off at larger radii, upper panel in Fig. 3. In this figure we have for comparison also plotted circular velocities from H (de Vaucouleurs et al., 1983) and H i (TA). Inspection of position-velocity diagrams along the major axis (Fig. 9) indicates that there are substantial deviations from the rotation curve due to e.g. streaming motions (see Sect. 3.4).
Although not readily visible from the azimuthally-averaged rotation curve, a central component of relatively low mass may exist. Indeed, the position-velocity diagrams along the major axis, shown in Fig. 9, suggest a more rapidly rising rotation curve with a first maximum at 15. Adopting, as an example (and consistent with our estimate from the position-velocity diagrams in Sect. 3.5.1), an inner (nuclear) exponential disk222The type of mass distribution has relatively little effect on the behavior of the rotation curve as long as the scale length of the mass distribution is sufficiently small. with a mass of , and a disk scale length of 50 pc, and plotting the new rotation curve together with the circular velocities obtained from the deconvolved CO(=2–1) data set (lower panel in Fig. 3), it is clear that the effects of such a mass distribution can very well be hidden in our data. (The mass and the scale length of the outer disk remain the same.)
3.3 Resonances
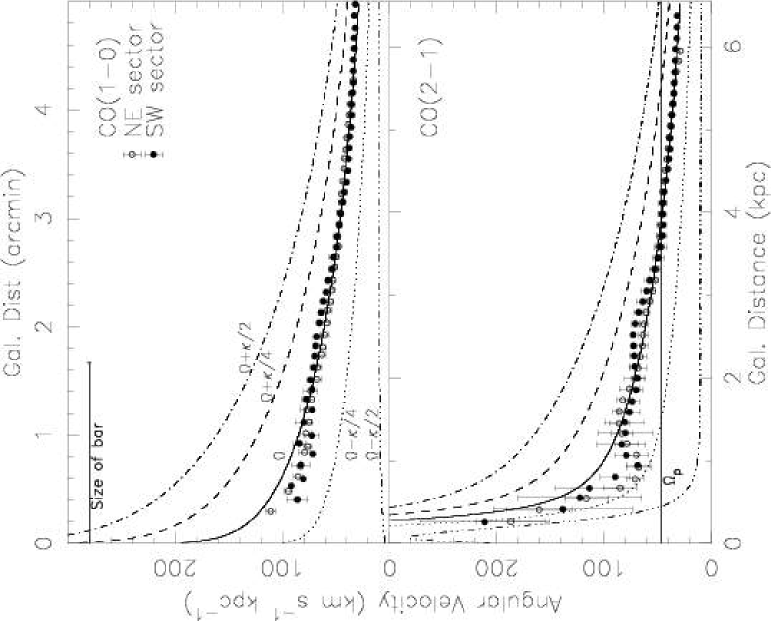
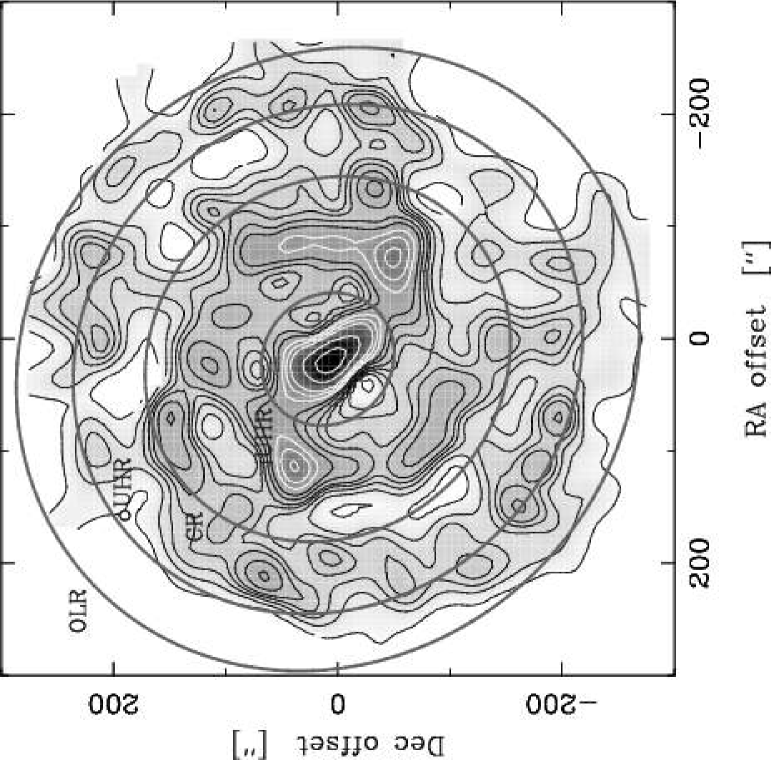
Objects orbiting the center of a galaxy oscillates radially in addition to their motion in circular or nearly-circular orbits. If the frequency of these radial oscillations, called the epicycle frequency (), is commensurate with the angular velocity of the bar and spiral arms, resonances occur. Depending on the conditions, the resonance can trap objects in a density wave or deplete a region. These resonances occur when (corotation, CR) or when , where is the number of arms (in this case 2), an integer number 1, the angular velocity of the gas and stars, and the pattern speed. The case = 1 results in the Lindblad resonances, while = 2 corresponds to the lowest order of the ultraharmonic resonances. In barred galaxies it is generally assumed that the bar and the spiral pattern rotate with a common pattern speed. In the following discussion, we will assume that the bar and the spiral arms have a common pattern speed of 47 km s-1 kpc-1 (see Sect. 3.4).
This results in a corotation radius (CR) of 170 (3.7 kpc), an outer UHR (oUHR) at 240 (5.2 kpc), and an outer Lindblad resonance (OLR) at 290 (6.3 kpc), Figs 4 and 5. The OLR corresponds to the scale of the optical and molecular gas disk.
While introducing a low-mass nuclear component has a negligible effect on the rotation curve, it has a noticeable effect on the angular-velocity diagram. In the case with the single-disk mass distribution (solid line in the upper panel in Fig. 4) there is no indication of an inner Lindblad resonance (ILR), which arises where . However, the CO emission at the nucleus of M 83 is split into two distinct components (Petitpas & Wilson (1998); Paper I), and it has been shown that the location (and existence) of a double nucleus of molecular gas in barred galaxies, is coincident with the location of an ILR (Kenney et al., 1992). In addition, Elmegreen et al. (1998) observed a nuclear ring in a color image of M 83. The radius of this ring is 9″ and the authors proposed that it coincides with the outer ILR (oILR). The disk plus central component model does allow for the existence of an ILR (lower panel in Fig. 4). In the example above with an inner disk mass of , the oILR would be located at a radius of . The possibility of an ILR is therefore not inconsistent with our data, but its exact location cannot be determined (nor can its existence with any certainty) due to the limited spatial resolution and grid spacing of our data.
Figure 4 indicates the presence of an inner Ultraharmonic Resonance (iUHR), where , at a radius of 6020 (1.30.4 kpc) (see also Fig. 5). (The distance from the nucleus to the iUHR is only about 5 smaller if the low-mass nuclear component is not present.) In this radial range in the SW part of the bar a very conspicuous horn-shaped feature can be seen in both our CO(=2–1) map (Fig. 7) and in H images. In the NE section of the bar there is an abrupt decrease of the H emission along the leading edge of the bar between the radii 45–55, and in the CO(=2–1) map the emission shows a sharp bend at this location. Furthermore, between radii 40 and 60, the CO(=2–1) intensity drops by a factor of about 4, and the corresponding drop in the CO(=1–0) intensity is about 2–3. It is possible that these features are the results of the interaction between gas and stars on square-shaped 4:1 orbits and material flowing along the leading edge of the bar towards the nucleus. Regan et al. (1999) offer another explanation: their SPH-modeling suggests that some gas that initially follow the dust lane on the leading edge of the bar will over-shoot the nuclear region and end up in the “spray region” on the opposite side of the bar in a region behind the dust lane. When this gas encounters gas flowing along the leading edge of the bar their trajectories will be more or less orthogonal to each other, and the interaction could have a strong impact on the gas flow in the dust lane, particularly if the gas feeding process is intermittent.
We note that the spiral pattern of M 83 appears to avoid the CR region. The spiral arms cross the CR region at (100,150) and (-80″) in the coordinate system of Fig. 5. The pitch angle increases abruptly when the arms approach the CR and decreases again on the other side of the CR region. Upon encountering the OLR, the pitch angle decreases and becomes negative. The spiral pattern shows here the characteristic dimpled shape of the 2:1 orbits that run in the retrograde sense in the rotating frame inside the OLR, e.g., Kalnajs (1991).
The decrease of the angular velocity around 40 (1 kpc) could be due to the effect of streaming motions in the bar. Gas on orbits, i.e. elongated orbits along the bar, will have a rotational velocity at the apex of the ellipse which is lower than that of gas on a circular orbit at the same radius. Hence, the will be lower. In the SW data, at galactocentric distances between 2 and 3 kpc, all measurements indicate deviations from circular motion. This can also be seen in the angular-velocity diagram: the NE sector shows a steady decrease of the angular velocity as a function of radius, while the SW sector has a region where the curve is more or less flat. This is the location of the western bar end, and we will discuss a possible explanation for this behavior in the next section.
3.4 Isovelocity maps and residual velocities
In Figs 6 and 7 the isovelocity contours obtained from the deconvolved CO(=1–0) and CO(=2–1) data sets, respectively, are plotted on grey-scale maps of the CO line emission in the respective transition. Both maps show the characteristic pattern of an inclined, rotating disk. Wiggles, indicating deviations from local circular motion, are present in the entire disk. Along the leading edge of the bar (see Fig. 7), the shape of the iso-velocity contours points towards lower circular velocities than expected. This is caused by non-circular motions due to the oval gravitational potential in the bar and/or a shock associated with the leading edge of the bar. At the center of the galaxy the iso-velocity contours are tilted by with respect to the minor axis, suggesting strong non-circular or out-of-plane motions (the former is expected in the presence of a strong bar). In CO we do not detect any strong evidence of the warp seen in H i (Rogstad et al., 1974; Huchtmeier & Bohnenstengel, 1981; Tilanus & Allen, 1993; Crosthwaite et al., 2002). This is not an unexpected result since a warp mainly affects regions outside the optical disk.
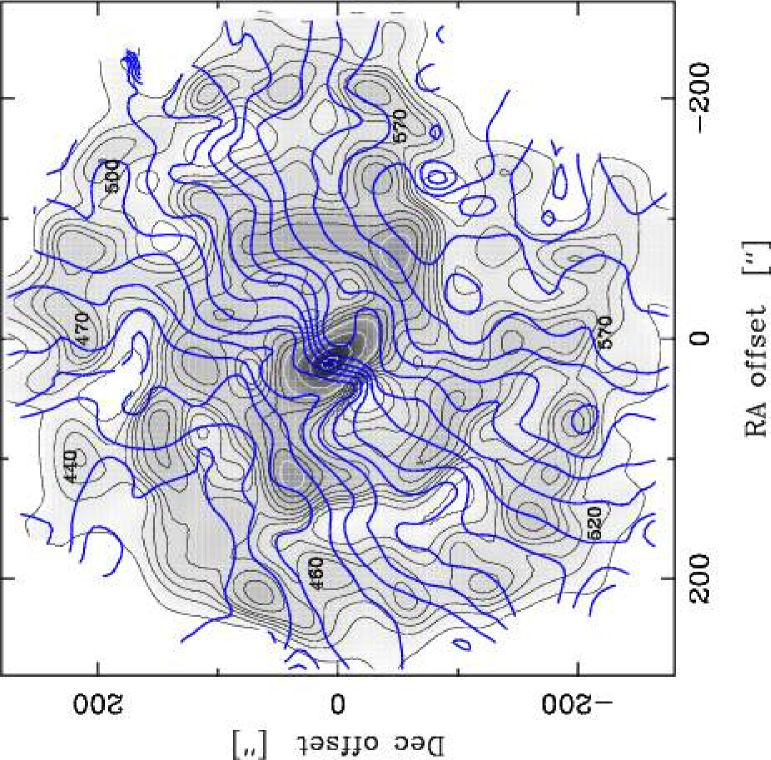
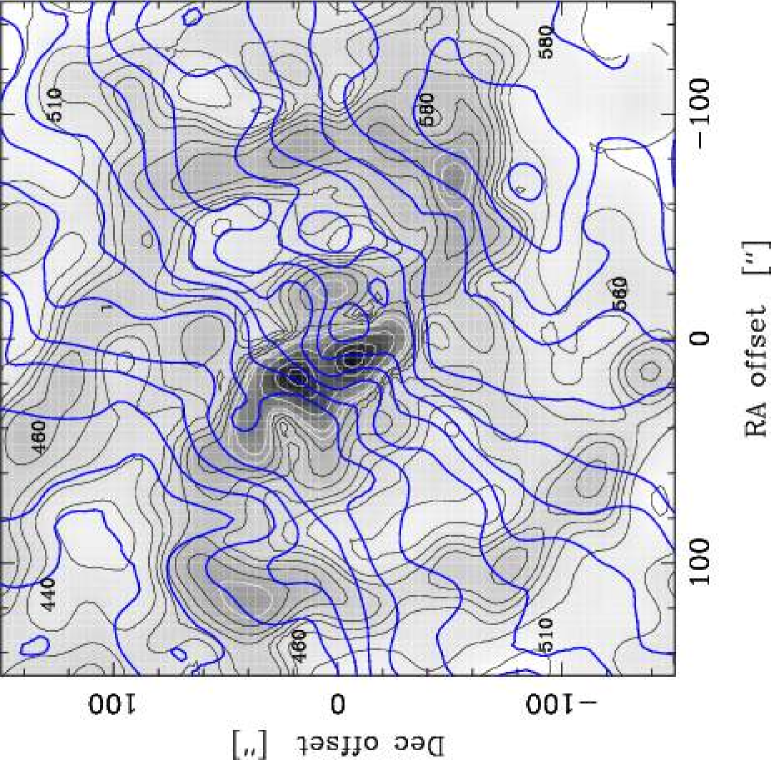
Displayed in Fig. 8 are the residual velocities, remaining after subtraction of the axi-symmetric-model velocity field, in the mem-deconvolved CO(=1–0) and CO(=2–1) data sets, as well as the H i data set from TA. In order to have comparable residual maps we subtracted the same axi-symmetric velocity field (the one obtained when fitting to the convolved CO(=1–0) data set). Also shown in these figures is a line marking the crest of the gas mass surface density along the spiral pattern, as obtained from the CO(=1–0) and CO(=2–1) images. The residuals seem to follow a spiral-shaped pattern in all maps. In general, the residual velocities in the different maps show a good resemblance: both in the total range (from to +20 km s-1) and in specific details, e.g., the large region with positive residuals 35 S of the center, and the bifurcation 25 W of the center. The H i map has a slightly better resolution (124), but our maps show in addition the residuals in the central region where the H i emission is absent. Some regions in the residual velocity maps show very sharp gradients, such as the end of the arm bifurcation to the west. These areas can be identified in the H i residual-velocity map as well. All of these regions coincide with areas in the disk with low mass surface density in both molecular and atomic hydrogen. Our interpretation is simply that the relatively low gas mass surface density in these regions is due to some mechanism, such as e.g. “shock focusing” (Lord & Kenney, 1991), that regulates how much gas can enter the region, and in the process skews the velocity distribution of the gas.
An interesting aspect of the residual-velocity pattern is that it may be used to find the pattern speed. The technique is called “geometric-phase technique”, and it is described in Canzian (1993). According to this method, the residual-velocity pattern goes from being a one-armed pattern to a three-armed pattern at the corotation radius in a two-armed spiral galaxy, where the pattern is driven by a spiral density wave (i.e., the pattern bifurcates at CR). On the western side there is such a bifurcation, but on the eastern side the situation is less clear. The galactocentric distance to the bifurcation on the western side is 160–180″ (3.5–3.9 kpc), i.e., at 1.6–1.8 ( is estimated as the radius where the isophotes in a K-band image become significantly influenced by the spiral arms). This is inconsistent with the results from early analytical calculations (Contopoulos & Grosbol, 1989), which show that corotation occurs just outside the end of the bar, and also larger than results from numerical SPH simulations (Athanassoula, 1992), which suggest a distance to the CR of 1.20.2 . Using Fig. 4 we deduce that the angular pattern speed of M 83 is about 40–55 km s-1 kpc-1. This is in excellent agreement with the value 509 km s-1 kpc-1 derived by Zimmer & Rand (2003) by applying the Tremaine-Weinberg method (Tremaine & Weinberg, 1984) to our CO(=1–0) data set.
3.5 Position-velocity diagrams
The position-velocity (PV) diagrams are obtained along the position angles 45° (major axis, left row in Fig. 9), and –45° (minor axis, right row in Fig. 9) across the IR center of the galaxy. We used the deconvolved CO(=1–0) and CO(=2–1) data sets, but the behavior is identical in the convolved data sets, however, with a lower angular resolution. We further assume in our interpretation that all motions take place in the plane of the galaxy (inclination 24°), and that the NW side is the near side.
3.5.1 Major axis
Along the major axis of the galaxy the CO(=1–0) PV-diagram crosses spiral arms twice, and there are velocity gradients over both arms. When compared to the expectations from density-wave-driven streaming motions in a disk with trailing arms, e.g., (Visser, 1980a; Canzian, 1993), the effect is most pronounced in the SW arm. Outside CR and outside the arm, the gas is slowed down in the azimuthal direction by the more rapidly moving spiral potential, while on the inside it is accelerated. In the PV-diagram this appears as an increase in velocity, above that of the rotation curve, before the arm and a decrease in velocity, below that of the rotation curve, beyond the arm (in the direction of increasing galactocentric radius; note that the exact location of the spiral potential minimum is somewhat uncertain and not necessarily coincident with the CO arms which are indicated in the figure). The total azimuthal velocity shift is about 15 km s-1, or about 35 km s-1 in the plane of the galaxy. This is comparable to the streaming motions observed in M 81 (Visser, 1980a, b; Adler & Westpfahl, 1996), but smaller than the ones observed in M 51 (Rydbeck et al., 1985; Garcia-Burillo et al., 1993b; Kuno & Nakai, 1997; Aalto et al., 1999). The situation is less clear-cut in the NE arm, but the behavior is not inconsistent with that of density-wave-driven streaming motions. One explaination for the lack of expected streaming signatures at the NE crossing might be due to its proximity to the CR radius. Here the gas is comoving with the gravitational potential and thus subject to strongly non-linear effects.
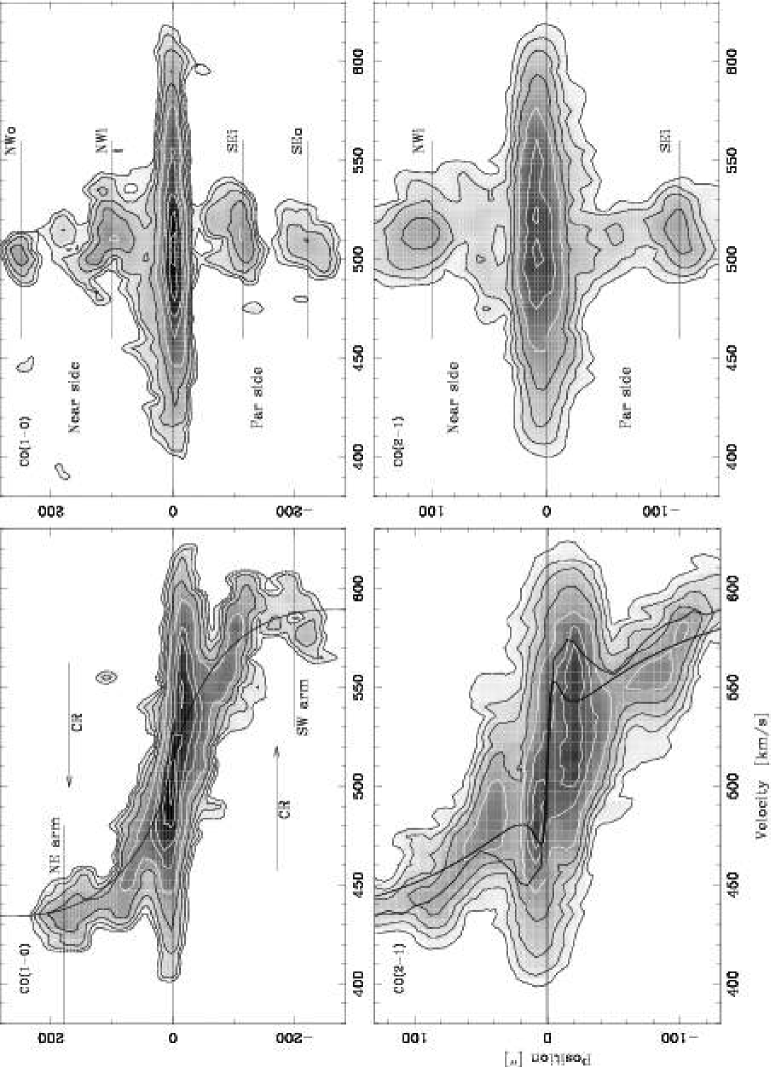
In the central region the velocity changes by about 50–75 km s-1 over 30 when crossing from the SW to the NE side of the nucleus (the effect is most pronounced in the CO(=2–1) map). If this motion lies in the plane of the galaxy, the rotation speed is 60–90 km s-1 at a distance of 15 (330 pc) from the nucleus. This suggests a much more rapidly rising rotation curve in the central region than the one obtained from the azimuthally-averaged data in Sect. 3.2, and the presence of a central mass component (as discussed in Sects 3.2 and 3.3). Assuming a rotational speed of 60 km s-1, the enclosed mass within 330 pc is about . The emission in this region is dominated by the two central components observed in e.g. CO(=3–2 and =4–3) by Petitpas & Wilson (1998), and in CO(=2–1) by us (Paper I). Note that the velocities of these concentrations, about 480 and 555 km s-1 in the CO(=2–1) map, are not symmetrical with respect to the systemic velocity, =510 km s-1). This can be explained by the fact that the two central components lie at different radial distances from the kinematical center. The result is also consistent with the CO(=1–0) PV-diagram of Handa et al. (1990), and the higher- CO line PV-diagrams of Israel & Baas (2001) and Dumke et al. (2001).
In the lower left panel of Fig. 9 we also show the rotation curve obtained using the envelope-tracing method to estimate velocities in a major-axis PV diagram (Sofue et al., 1997). The first step is to locate the terminal velocity (), i.e., the velocity at which the intensity is 20% of the peak intensity, for each radius (see e.g. Sofue & Rubin (2001) for details of the method). The circular velocity () is then calculated using
| (2) |
where is the velocity dispersion of the ISM, and is the velocity resolution of the observations. We used the radial distribution of the total velocity dispersion shown in Fig. 10 as an estimate of . The circular velocities obtained in this way are systematically higher than the ones obtained with the intensity-weighted-velocity method. The shape of the rotation curve is consistent with a massive central component. An even steeper rotation curve has been derived by Sofue et al. (1999) using this method on H i and CO data. The main reason for the difference lies in the higher spatial resolution of the latter observations. Finally, it should be noted that this rotation curve is obtained along the bar, which happens to lie along the major axis. In this region there may also be non-negligable motions perpendicular to the plane.
3.5.2 Minor axis
Along the minor axis the CO(=1–0) PV-diagram crosses the arms four times; denoted, starting from lower left, SEo (South-East outer), SEi (South-East inner), NWi, and NWo.
In the SEi and SEo crossings the behavior is once again as expected from density-wave-driven streaming motions. The gas is accelerated radially outwards inside the arms, and radially inwards outside the arms. The velocity shifts are about 15 km s-1, corresponding to about 35 km s-1 in the plane of the galaxy, i.e., consistent with the velocity shift estimated at the major axis NE crossing. In the NW part the situation is much more complicated. The NWo crossing may be affected by a warp of the plane as suggested by H i data (Tilanus & Allen, 1993). Between the NWo and NWi crossings there is gas with radial velocities approaching 75 km s-1 in the plane of the galaxy, both inwards and outwards, and this makes the interpretation of the NWi crossing more difficult. The gas moving inwards comes from an area slightly east of the minor axis, in a region where the arm bends sharply. Presumably this has an effect on the kinematics. In general, the gas is much more perturbed in the NW part.
3.6 Velocity dispersion
We estimate the velocity dispersion in the spectra by measuring their equivalent width, i.e., the velocity-integrated intensity divided by the peak intensity. This is converted to the standard, intensity-weighted, velocity dispersion, , by dividing the result with , i.e., the conversion constant for a Gaussian profile. Prior to the calculation of the velocity dispersions the spectra were smoothed to 5 km s-1 in order to minimize the impact of the noise. This also facilitates the comparison of data with different velocity resolutions.
Figure 10 shows the velocity dispersions of the CO(=1–0) and CO(=2–1) lines, at a resolution of 49, as a function of galactocentric radius. In the central region the lines are markedly broadened by the steeply rising rotation curve and bar-induced non-circular motions. In the disk there is a steady decrease of the velocity dispersion with increasing galactocentric radius, reaching a value of about 10 km s-1 at the edge of the optical disk. The dispersion of the CO(=2–1) lines is slightly higher than that of the CO(=1–0) lines, by about 0.5–1 km s-1 in the disk. This could possibly indicate the presence of several cloud components with slightly different physical characteristics.
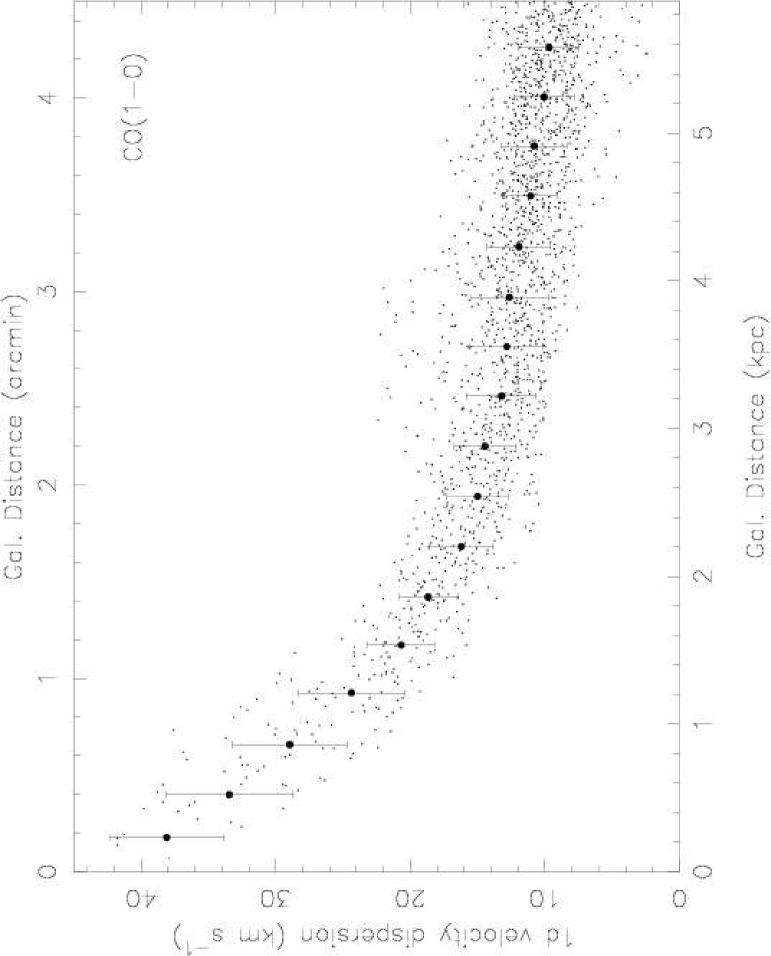
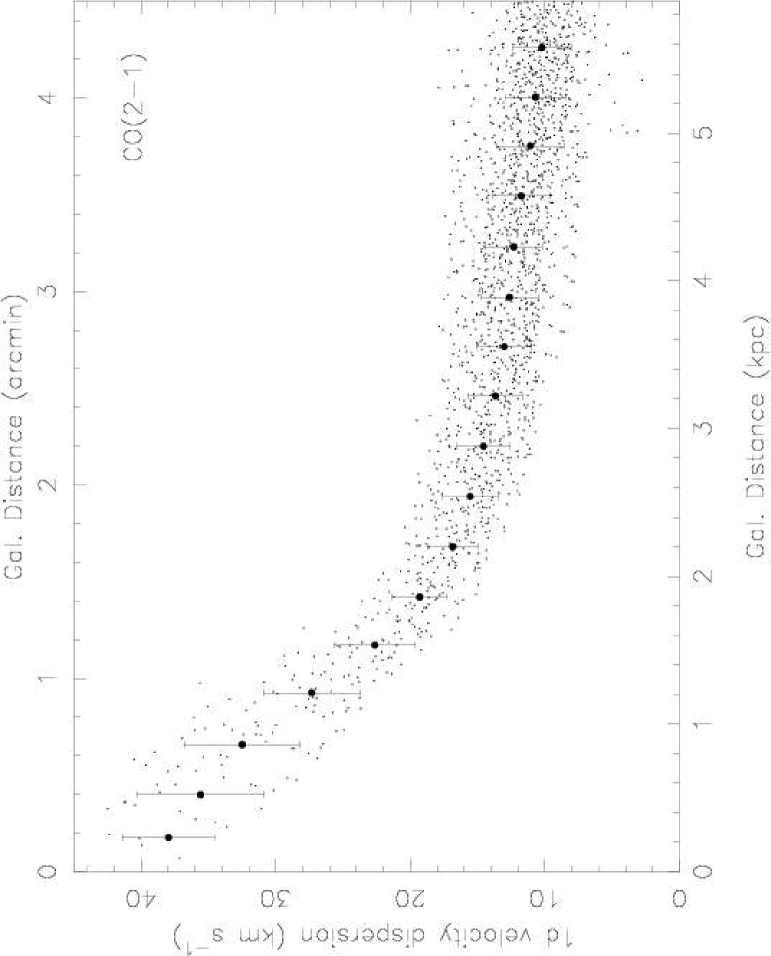
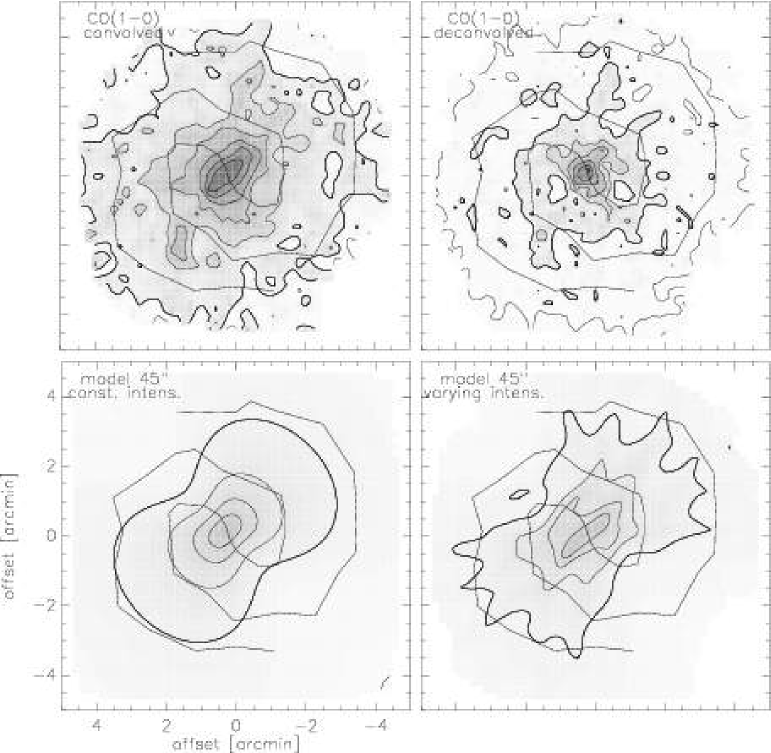
Before taking the decrease of the velocity dispersion in the disk with increasing galactocentric distance at face value, we need to evaluate the influence of the beam smearing on the velocity profiles. In the convolved CO(=1–0) data set (upper left map in Fig. 11), the pattern of high velocity dispersion is orthogonal to the bar, but in the deconvolved data set (upper right map in Fig. 11) the effect is not present. This suggests that this feature is only an effect of the beam coupling to the intensity distribution in a region where the local velocity and intensity changes within the beam are large. We made two simple models to show the impact of this effect. In the first model we assumed a flat intensity distribution in order to look at large-scale patterns, and in the second we took the intensity distribution from the peak intensity distribution in our deconvolved data set in order to show artifacts that may appear on smaller scales. In both models we assumed a fixed velocity dispersion of 8 km s-1 (see Sect. 4) and the velocity field generated by the rotation curve of the CO(=1–0) convolved data. We created two data cubes, convolved them with a HPBW of 45 and calculated the velocity dispersion in the spectra using our automated routine (see Paper I for details). These maps of the model velocity dispersions can be seen in the bottom row of Fig. 11. In both cases the velocity dispersion distribution is box-shaped and oriented with the “major axis” orthogonal to the bar. At the center the velocity dispersion reaches 20 km s-1 in both cases. The model spectra in the central region reproduce the shape of the observed spectra nicely. However, they underestimate observed velocity dispersion at the center (40 km s-1), which is not surprising given our simple assumptions of the intensity distribution, rotation curve, and low velocity dispersion in the nuclear region. In the model with the varying peak intensity, the elongation orthogonal to the bar is more pronounced. The explanation is that spectra in regions with low levels of emission, such as regions close to the bar (along the minor axis), are influenced by the velocity components in nearby regions with high levels of intensity. This effect is also present in various regions of the disk. The lack of emission between the GMAs (introduced in Sect. 4) and in the interarm regions leads here to an artificial broadening of the spectra. This results in iso-velocity-dispersion contours with fingers pointing outwards between the GMAs.
The fact that the artificial broadening of the spectra decreases with galactocentric radius indicates that beam smearing is responsible for at least some of the gradient in the the velocity dispersion in Fig. 10. Our models did not include streaming motions, which also will add to the observed velocity dispersion.
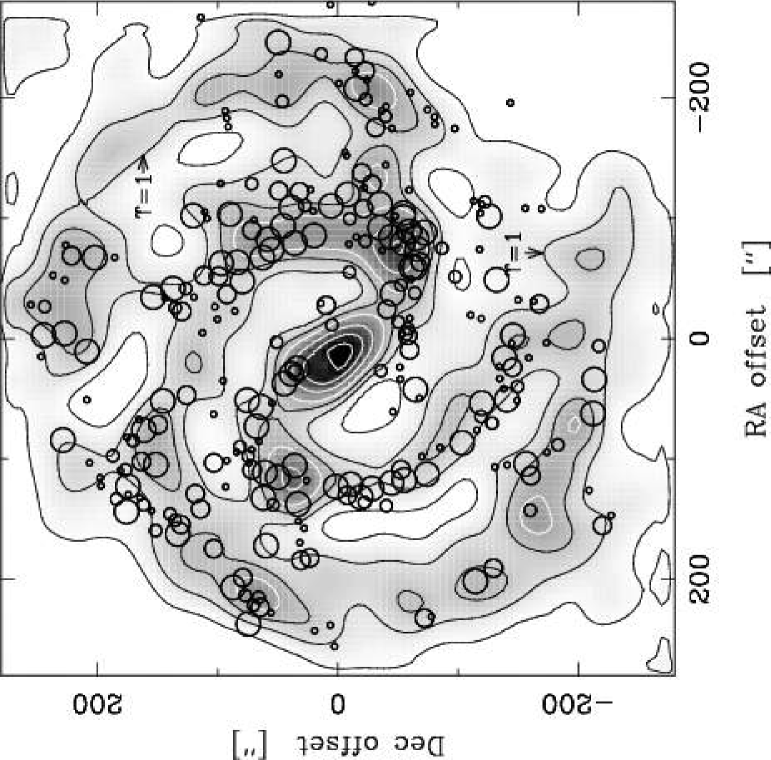
4 Disk instability
Along the spiral arms we find clumpy structures, which we interpret as Galactic Molecular Associations (GMAs). Figure 12 shows the locations of these structures on a grey-scale image of the total gas (H2+H i+He) mass surface density (). The locations of the GMAs have been estimated from the velocity-integrated CO(=1–0) emission in the mem-deconvolved data set. In some ambiguous cases we have used the peak intensity in the same data set. The H2 mass surface density is estimated from the velocity-integrated CO(=1–0) line intensity using a conversion factor () of 2.3 (K km s-1)-1 cm-2 (see Paper I). The H i data comes from TA. It was noted by TA that due to the lack of short-spacing information in the VLA observations only 55% of the atomic gas mass observed by Huchtmeier & Bohnenstengel (1981) with a single dish telescope was detected. In order to calculate the total gas mass surface densities, we have to compensate for the missing flux. The difference in atomic masses detected in these observations corresponds to an average atomic mass surface density of 2.6 M⊙ pc-2. Lacking information on how this mass is distributed in the galaxy, we take the simplest approach and add this constant mass surface density to the TA data. This is a minor correction, since the typical mass surface density in the GMAs are of the order 30 M⊙ pc-2. The final data are convolved and regridded to match the sampling of the CO data. The total gas mass also includes He, through a scaling of the total H i and H2 gas mass with 1.36.
The total gas mass of an individual GMA is typically 1–3 107 M⊙, and the distance between them are of the order 1 kpc. Similar structures have been observed in other galaxies, such as e.g. M 51 (Kuno et al., 1995). It is believed that structures like these are formed when the gaseous disk becomes unstable to axisymmetric perturbations, which happens when the mass surface density exceeds a critical density (Toomre, 1964; Kuno et al., 1995),
| (3) |
where is a dimensionless factor of order unity, the one-dimensional velocity dispersion of the ISM gas, and the epicyclic frequency given by
| (4) |
where is the angular velocity , and the center of the epicyclic motion (Binney & Tremaine, 1987). For a pure stellar or gaseous disk one expects = 1, but in a realistic gas/stellar disk the value should be 1 due to the instability introduced by the interaction between the two components (Jog & Solomon, 1984; Wang & Silk, 1994). Kennicutt (1989) studied the radial dependence of massive star formation and gas mass surface density in a number of galaxies and found that lies in the range 0.5–0.85. An improved study by Martin & Kennicutt (2001) gave = 0.69 (with some considerable scatter), assuming a gas velocity dispersion of 6 km s-1. In this paper we use = 0.65.
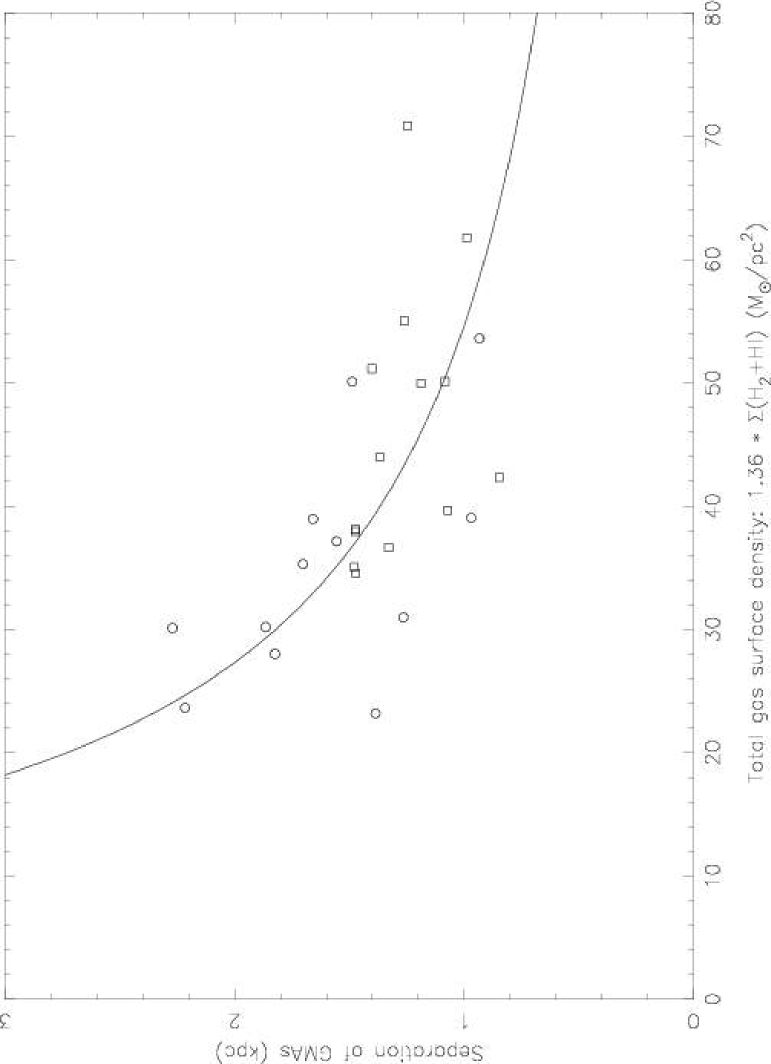
In a gravitationally unstable disk the GMAs are separated by a distance defined by the wavelength of the fastest growing mode in the gaseous disk (Elmegreen, 1994). This wavelength can be expressed as
| (5) |
Figure 13 shows the separation between the GMAs as a function of the average total gas mass surface density in the region. Also shown is the best fit of (5) to the data. The fit gives an average velocity dispersion of 7.8 () km s-1, only slightly lower than the values 9.3 km s-1 found for the H i gas in TA, and 8.0 km s-1 for the CO interferometer data in Rand et al. (1999), and in agreement with the lower envelope of the values in Fig. 11. This result also gives some credence to our estimates.
Elmegreen (1994) gives an expression for the characteristic mass of the GMAs as a function of velocity dispersion and mass surface density,
| (6) |
This mass agrees well with our GMA mass estimates in M 83, 1–3 107 M⊙.
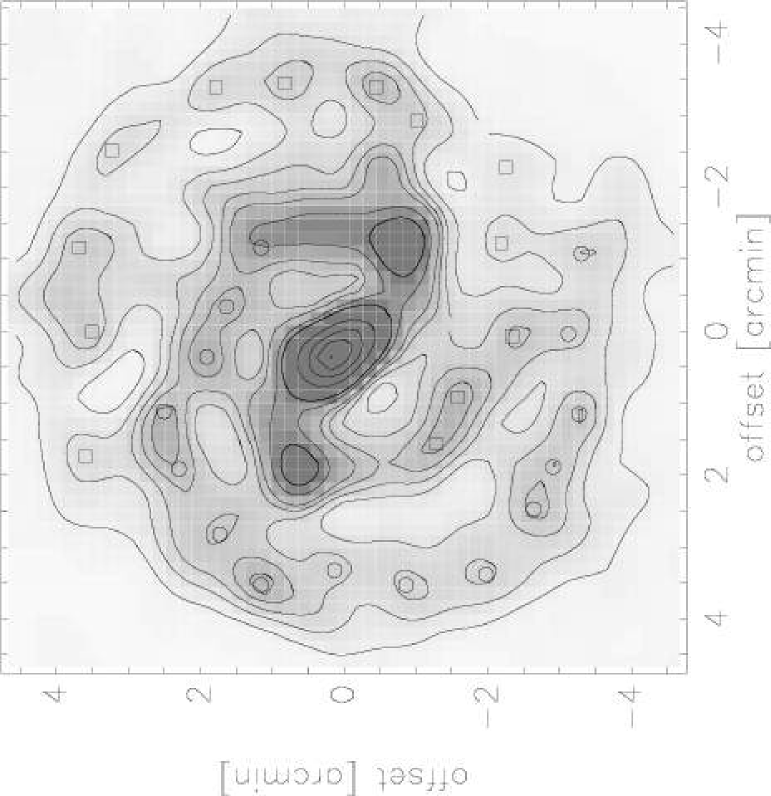
Using (3), setting = 7.8 km s-1, and using the rotation curve derived in Sect. 3, we have calculated the critical mass as a function of position in M 83. Figure 14 shows a map of the ratio . is below unity between the arms, hence these regions are stable against gravitational collapse. In the arms, is usually about 1–2 and the variation with galactocentric distance is small, as expected since star formation drives towards 1. The bar ends and the nucleus show values significantly larger than 1. These regions also have massive star formation, but the ratio is most likely overestimated since the velocity dispersion is higher than the adopted 7.8 km s-1 in these regions (especially close to the nucleus). Also, the true rotation curve is expected to be steeper than the one derived from our CO data, which would give a higher and therefore an increase of the critical density. The value of correlates nicely with the location of the H ii-regions, which are shown as circles in Fig. 14 (H ii data from Rumstay & Kaufman (1983)).
5 Conclusions
We have used CO radio line emission data to investigate the kinematics of the molecular gas over the entire optical disk of M83. We compare our data with that of other kinematical tracers, such as H and atomic hydrogen.
We find that:
i) The large scale velocity field is regular. Deviations from circular rotation in the disk is caused by streaming motions associated with a spiral density wave. In the center region the velocity field is strongly coupled to the barred potential.
ii) The kinematical center of the CO velocity field coincides with the IR nucleus of the galaxy. The dynamical mass of the galaxy within the Holmberg radius is found to be M⊙. The total gas mass, including H2, H i and He, makes up 13% of this mass.
iii) The rotation curve is symmetric and adequately fitted by an exponential mass distribution. The rotation curve derived from the CO emission agrees with those estimated from H and H i emission.
iv) Subtracting the global, rotational velocity field we find that the magnitude and pattern of the residual velocities of the CO line emission agree with those of H i. We also find that the CO residual velocity pattern bifurcates on the western side. This is expected for a pattern driven by a spiral density wave with a co-rotation radius at the galactocentric distance of the bifurcation. However, no strong bifurcation is found on the eastern side.
v) Position-velocity maps along the major and minor axes of M83 show velocity gradients across the spiral arms in agreement with density wave theory. The velocity shifts across the spiral arms are 35 km s-1 (corrected for inclination).
vi) The velocity dispersion in the disk appears to show a monotonic decline with galactocentric radii. Part, or all,of the decline can be attributed to a convolution of the velocity field and the finite telescope beam. The velocity dispersion of the CO(J=2-1) line emission is, however, systematically larger than that of the CO(J=1-0) line emission by 0.5–1 km/s.
vii) Several Giant Molecular Associations (GMAs) are identified along the spiral arms of M83. The separation of these GMAs depends on the velocity dispersion and the total gas surface density. Our derived CO velocity dispersions and estimated gas surface densities, together with the observed GMA separations, give a good fit to the expected wavelength of the fastest growing mode of a gravitationally unstable disk.
viii) The total gas surface mass density, derived from CO and H i measurements, is compared to the critical mass surface density as expected from a Toomre disk. We find that the observed gas surface mass density exceeds the Toomre value in the spiral arm regions, but not in the interarm regions. We also find that the number and sizes of H ii regions correlate well with the value of the ratio .
Acknowledgements.
We are very grateful toward the SEST staff for their support during observations and Swedish Natural Science Research Council for travel expenses support. We also wish to thank Remo Tilanus and Ron Allen for letting us use their H i data.References
- Aalto et al. (1999) Aalto, S., Hüttemeister, S., Scoville, N. Z., & Thaddeus, P. 1999, ApJ, 522, 165
- Adler & Westpfahl (1996) Adler, D. S. & Westpfahl, D. J. 1996, AJ, 111, 735
- Athanassoula (1992) Athanassoula, E. 1992, MNRAS, 259, 345
- Binney & Tremaine (1987) Binney, J. & Tremaine, S. 1987, Galactic dynamics (Princeton University Press)
- Canzian (1993) Canzian, B. 1993, ApJ, 414, 487
- Combes et al. (1978) Combes, F., Encrenaz, P. J., Lucas, R., & Weliachew, L. 1978, A&A, 67, L13
- Comte (1981) Comte, G. 1981, A&AS, 44, 441
- Contopoulos & Grosbol (1989) Contopoulos, G. & Grosbol, P. 1989, A&A Rev., 1, 261
- Crosthwaite et al. (2002) Crosthwaite, L. P., Turner, J. L., Buchholz, L., Ho, P. T. P., & Martin, R. N. 2002, AJ, 123, 1892
- de Vaucouleurs et al. (1976) de Vaucouleurs, G., de Vaucouleurs, A., & Corwin, H. G. 1976, Second Reference Catalogue of Bright Galaxies (RC2) (University of Texas Press)
- de Vaucouleurs et al. (1983) de Vaucouleurs, G., Pence, W. D., & Davoust, E. 1983, ApJS, 53, 17
- Dumke et al. (2001) Dumke, M., Nieten, C., Thuma, G., Wielebinski, R., & Walsh, W. 2001, A&A, 373, 853
- Elmegreen (1994) Elmegreen, B. G. 1994, in ASP Conf. Ser. 66: Physics of the Gaseous and Stellar Disks of the Galaxy, 61
- Elmegreen et al. (1998) Elmegreen, D. M., Chromey, F. R., & Warren, A. R. 1998, AJ, 116, 2834
- Garcia-Burillo et al. (1993a) Garcia-Burillo, S., Combes, F., & Gerin, M. 1993a, A&A, 274, 148
- Garcia-Burillo et al. (1993b) Garcia-Burillo, S., Guelin, M., & Cernicharo, J. 1993b, A&A, 274, 123
- Garcia-Burillo et al. (1998) Garcia-Burillo, S., Sempere, M. J., Combes, F., & Neri, R. 1998, A&A, 333, 864
- Handa et al. (1990) Handa, T., Nakai, N., Sofue, Y., Hayashi, M., & Fujimoto, M. 1990, PASJ, 42, 1
- Helfer et al. (2003) Helfer, T. T., Thornley, M. D., Regan, M. W., et al. 2003, ApJS, 145, 259
- Huchtmeier & Bohnenstengel (1981) Huchtmeier, W. K. & Bohnenstengel, H. . 1981, A&A, 100, 72
- Israel & Baas (2001) Israel, F. P. & Baas, F. 2001, A&A, 371, 433
- Jog & Solomon (1984) Jog, C. J. & Solomon, P. M. 1984, ApJ, 276, 114
- Kalnajs (1991) Kalnajs, A. J. 1991, in Dynamics of Disc Galaxies, 323
- Kenney & Lord (1991) Kenney, J. D. P. & Lord, S. D. 1991, ApJ, 381, 118
- Kenney et al. (1992) Kenney, J. D. P., Wilson, C. D., Scoville, N. Z., Devereux, N. A., & Young, J. S. 1992, ApJ, 395, L79
- Kennicutt (1989) Kennicutt, R. C. 1989, ApJ, 344, 685
- Kuno & Nakai (1997) Kuno, N. & Nakai, N. 1997, PASJ, 49, 279
- Kuno et al. (1995) Kuno, N., Nakai, N., Handa, T., & Sofue, Y. 1995, PASJ, 47, 745
- Lord & Kenney (1991) Lord, S. D. & Kenney, J. D. P. 1991, ApJ, 381, 130
- Lundgren et al. (2004) Lundgren, A. A., Wiklind, T., Olofsson, H., & Rydbeck, G. 2004, A&A, 413, 505
- Martin & Kennicutt (2001) Martin, C. L. & Kennicutt, R. C. 2001, ApJ, 555, 301
- Petitpas & Wilson (1998) Petitpas, G. R. & Wilson, C. D. 1998, ApJ, 503, 219
- Press et al. (1992) Press, W. H., Teukolsky, S. A., Vetterling, W. T., & Flannery, B. P. 1992, Numerical recepies in C: the art of scientific computing., 2nd edn. (Cambridge University Press)
- Rand et al. (1999) Rand, R. J., Lord, S. D., & Higdon, J. L. 1999, ApJ, 513, 720
- Regan et al. (1999) Regan, M. W., Sheth, K., & Vogel, S. N. 1999, ApJ, 526, 97
- Regan et al. (2001) Regan, M. W., Thornley, M. D., Helfer, T. T., et al. 2001, ApJ, 561, 218
- Rogstad et al. (1974) Rogstad, D. H., Lockart, I. A., & Wright, M. C. H. 1974, ApJ, 193, 309
- Rumstay & Kaufman (1983) Rumstay, K. S. & Kaufman, M. 1983, ApJ, 274, 611
- Rydbeck et al. (1985) Rydbeck, G., Hjalmarson, A., & Rydbeck, O. E. H. 1985, A&A, 144, 282
- Sofue et al. (2003) Sofue, Y., Koda, J., Nakanishi, H., et al. 2003, PASJ, 55, 17
- Sofue & Rubin (2001) Sofue, Y. & Rubin, V. 2001, ARA&A, 39, 137
- Sofue et al. (1997) Sofue, Y., Tutui, Y., Honma, M., & Tomita, A. 1997, AJ, 114, 2428
- Sofue et al. (1999) Sofue, Y., Tutui, Y., Honma, M., et al. 1999, ApJ, 523, 136
- Sofue & Wakamatsu (1994) Sofue, Y. & Wakamatsu, K. 1994, AJ, 107, 1018
- Talbot et al. (1979) Talbot, R. J., Jensen, E. B., & Dufour, R. J. 1979, ApJ, 229, 91
- Thim et al. (2003) Thim, F., Tammann, G. A., Saha, A., et al. 2003, ApJ, 590, 256
- Tilanus & Allen (1993) Tilanus, R. P. J. & Allen, R. J. 1993, A&A, 274, 707
- Toomre (1964) Toomre, A. 1964, ApJ, 139, 1217
- Tremaine & Weinberg (1984) Tremaine, S. & Weinberg, M. D. 1984, ApJ, 282, L5
- Visser (1980a) Visser, H. C. D. 1980a, A&A, 88, 159
- Visser (1980b) —. 1980b, A&A, 88, 149
- Wang & Silk (1994) Wang, B. & Silk, J. 1994, ApJ, 427, 759
- Zimmer & Rand (2003) Zimmer, P. & Rand, R. 2003, ApJ, Sumbitted