The diffuse light in simulations of galaxy clusters
Abstract
We study the properties of the diffuse light in galaxy clusters forming in a large hydrodynamical cosmological simulation of the CDM cosmology. The simulation includes a model for radiative cooling, star formation in dense cold gas, and feedback by SN-II explosions. We select clusters having mass and study the spatial distribution of their star particles. While most stellar light is concentrated in gravitationally bound galaxies orbiting in the cluster potential, we find evidence for a substantial diffuse component, which may account for the extended halos of light observed around central cD galaxies. We find that more massive simulated clusters have a larger fraction of stars in the diffuse light than the less massive ones. The intracluster light is more centrally concentrated than the galaxy light, and the stars in the diffuse component are on average older than the stars in cluster galaxies, supporting the view that the diffuse light is not a random sampling of the stellar population in the cluster galaxies. We thus expect that at least of the stars in a cluster may be distributed as intracluster light, largely hidden thus far due to its very low surface brightness.
Subject headings:
cluster: evolution, X-ray masses, diffuse light1. Introduction
The presence of diffuse ‘intracluster light’ in galaxy groups and clusters is now well established; observations by several groups provide estimates of the fraction of diffuse light and its distribution, using different techniques (see Arnaboldi 2003 for a review). The fraction of stars contained in this space-filling component seems to increase strongly with the density of the environment: from loose groups (, Castro-Rodriguez et al. 2003; Durrell et al. 2003) to Virgo-like ( 10%; Feldmeier et al. 2003; Arnaboldi et al. 2003) and rich clusters ( or higher; Gonzalez et al. 2000, Feldmeier et al. 2002; Gal-Yam et al. 2003). This correlation may represent an important clue for understanding the mechanisms that produce intracluster (IC) light and drive its evolution in the cluster environment.
Cosmological simulations of structure formation facilitate studies of the diffuse light and its expected properties. Dubinski (1998) constructed compound models of disk galaxies and placed them into a partially evolved simulation of cluster formation, allowing an evolutionary study of the dark matter and stellar components independently. Using an empirical method to identify stellar tracer particles in high-resolution dark matter (DM) simulations, Napolitano et al. (2003) studied a Virgo-like cluster, finding evidence of a young dynamical age of the intracluster component. The main limitations in these approaches is the restriction to collisionless dynamics.
In this Letter, we analyze for the first time the IC light formed in a cosmological hydrodynamical simulation including a self-consistent model for star formation. In this method, no assumptions about the structural properties of the forming galaxies need to be made, and the gradual formation process of the stars, as well as their subsequent dynamical evolution in the non-linearly evolving gravitational potential can be seen as a direct consequence of the CDM initial conditions. It is therefore of immediate interest whether this theoretical formation scenario makes predictions for IC light consistent with observations. Using a large volume of , we can furthermore study a statistically significant sample of clusters at , and analyze the correlations of properties of diffuse light with, e.g., cluster mass and X-ray temperatures.
2. Cosmological simulations
We analyze the large scale cosmological hydrodynamical simulation (LSCS) of a “concordance” CDM model (, , , , ) of Borgani et al. (2004, B04). It was carried out with the massively parallel Tree+SPH code GADGET (Springel et al. 2001), using DM particles and as many gas particles. For the periodic cube of size Mpc, the mass resolution was thus and ; the Plummer–equivalent softening length was kpc (at ). Besides gravity and hydrodynamics, the simulation accounts for star formation using a sub-resolution multi-phase model for the interstellar medium (Springel & Hernquist 2003), feedback from supernovae explosions (including the effect of galactic outflows), radiative cooling of the gas (assuming zero metallicity) and heating by a photo–ionizing, uniform, time–dependent UV background (Haardt & Madau 1999).
Clusters are identified at using a standard friends-of-friends algorithm, with a linking length of times the mean DM inter-particle separation. We identified 117 clusters with . Cluster centers were placed at the position of the most bound particle belonging to each group. X–ray temperatures and masses were evaluated at the radius , which encloses an average density of times the critical density. A detailed study of the X–ray properties of our clusters, together with a full description of the numerical simulation can be found in B04.
This cosmological simulation shows an encouraging agreement with some of the most important observed X-ray cluster properties. However, there are also a number of discrepancies that remain unaccounted for, as in other comparable numerical work. For instance, the observed radial temperature profiles in the cluster centers are not reproduced, and the fraction of collapsed baryonic mass (“cold” gas and stars) appears still too large. While it is likely that the resolution of these problems will require an improved treatment of the intracluster gas physics, nonetheless this simulation represents a useful tool to study the physical properties of the diffuse light.
2.1. Presence of diffuse light
For all clusters identified in the cosmological simulation, we analyze the stellar distribution in the cluster volume. To compare with surface brightness measurements, we compute the projected density of stars by integrating along a line-of-sight (LOS). We then extract the 2D–radial profile of each cluster centered on its most bound particle, computing density profiles in 100 shells for the star component from to . A stacked profile is obtained by averaging the shell densities with the same radius over all clusters. For each cluster, the stars in galaxies other than the cD or brightest cluster galaxies (BCGs) are not included.
For the galaxy identification we use the publicly available package SKID (Stadel 2001 111 http://www-hpcc.astro.washington.edu/tools/skid.html) to identify self–bound gas and star particle groups within individual clusters. We selected a scale of kpc, comparable to our physical force resolution, as the typical SKID length–scale . SKID groups together particles lying near local maxima of the density field, as determined using DM, star and gas particles. Then those star and gas particles which have a total energy , where is the kinetic energy and the local gravitational energy, are removed from each group. All particles in a sphere of radius are considered for evaluating the gravitational energy. We discarded groups having less than 32 star particles.
We then look for a halo stellar component in the stacked 2D profile, following Schombert (1986), by checking whether the average radial surface brightness profile curves upward in a diagram, over significant intervals in . We fit a Sersic law to the inner parts of the stacked surface brightness profile, in a range of radii from the center out to a radius where the surface density is about one third of the central value. The result is shown in Fig. 1: a light excess to the inner Sersic profile is evident for radii . The deviation at large of the stacked surface brightness profile from the Sersic’s law is interpreted as being due to an extensive luminous halo. In observed cDs this occurs at kpc, which is smaller than our measured value. Previous studies of cluster evolution (Dubinski 1998, Napolitano et al. 2003) produced clusters with BCGs whose density profile followed a de Vaucoleurs’ law at all radii. In our simulations, where gas, stars and DM particles are followed self-consistently during structure formation, cD halos do form.
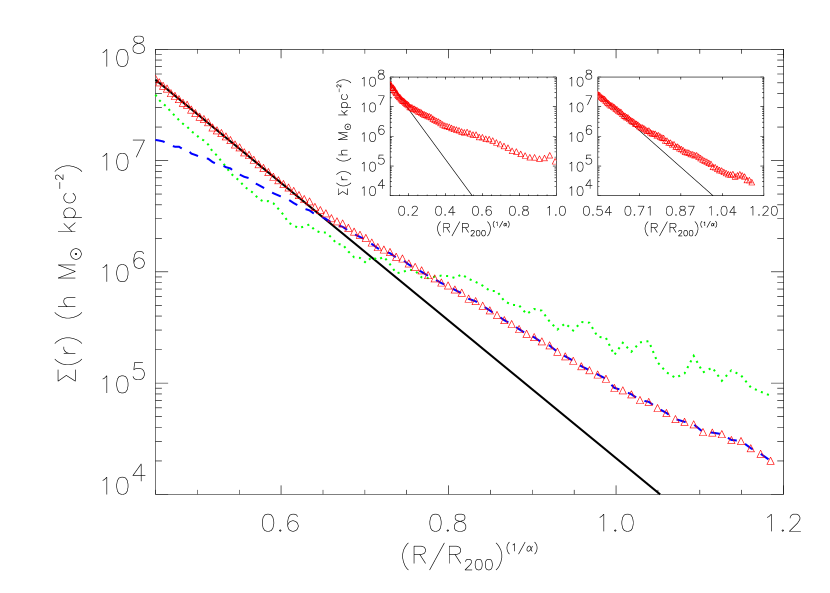
According to Dressler (1979) and Kormendy (1980) the upturn in the cD surface brightness plot, indicating the additional luminous halo, would occur at the projected radius where the stars become unbound from the central elliptical galaxy and orbit in the cluster potential. The velocity dispersion profile would then rise at the radius where the change of slope takes place. A similar effect is observed in NGC 1399, a nearby cD galaxy (Arnaboldi et al. 1994, Napolitano et al. 2002).
In a cosmological simulation, we have the phase space information for all particles; thus, we can study the dynamical behavior of those particles which populate the outer halo of cD galaxies. We will refer to all star particles grouped to any substructures by SKID as “bound”, while the others will be named “unbound”. The distinction between stars bound to a galaxy and unbound stars is workable except for the cluster center, where the most bound IC stars and the stars of the central cD fall in the same part of phase-space.
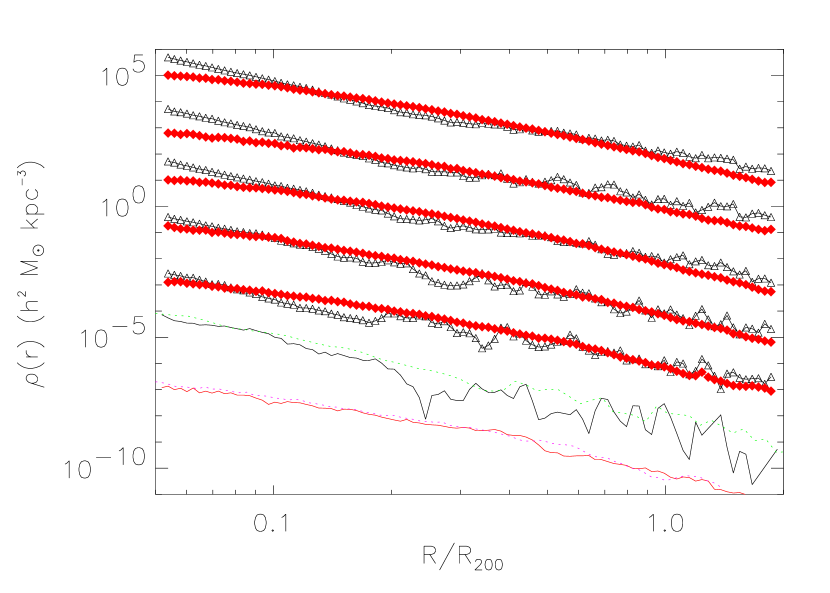
Once the stellar particles in a given cluster are flagged, we build up the global 3D radial profiles for the “bound” and the “unbound” stars. Then we group all the clusters in classes with different X-ray temperature, and derive the average 3D stellar density profiles for the “bound” and “unbound” components. Fig. 2 shows that the “unbound” stars have a shallower radial profile than the “bound” component, in the range of radii from to . These stars are responsible for the additional light detected in cD halos, and build up the diffuse light in our clusters.
3. Properties of diffuse light
The size of our simulated volume allows us to study the physical properties of the IC stellar light in clusters statistically, and explore their dependence on the total mass and/or the X-ray temperatures of clusters. For all the clusters selected in our database, we evaluate the logarithmic slope of the 3D profiles in a range of radii around , where is the cluster radius where . In the radial interval , the profile slopes for the diffuse stars are in the range (-1, -3), while the profile slopes for the “bound” stars are in the range (-3,-5). Here the diffuse component has a shallower slope than the “bound” stars belonging to the central cD. At larger radii, the “bound” stars are those in cluster galaxies, and they become dominant over the more centrally concentrated IC light, see Fig. 1 and Fig. 2.
We also investigated whether any trends are present with cluster mass, either for the slope or for , but no significant trend was detected.
Another relevant quantity is the fraction of diffuse vs. total mass in stars: this quantity is a function of the cluster mass, with the more massive clusters having a larger fraction of IC light, see Fig. 3. We found that the amplitude of the correlation between the fraction of diffuse vs. total stellar mass depends on the value of the SKID length parameter , but the slope of this correlation is almost unchanged when changes. This is connected with the difficulty of separating the stars in the cD from the IC stars near the cluster center. Large values of increase the number of stars in galaxies, but the fraction of unbound stars never drops to zero. In the most extreme case we tested ( kpc), only few of our 117 clusters drop to . These objects are in the low–mass range ().
We checked that kpc ensures a clear dynamical separation between “bound” and “unbound” stars. The “unbound” stars have a 3D velocity dispersion comparable to that of the DM particles, while “bound” particles have a smaller velocity dispersion. Typical values for the most massive cluster in our LSCS are kms-1, kms-1 at kpc.
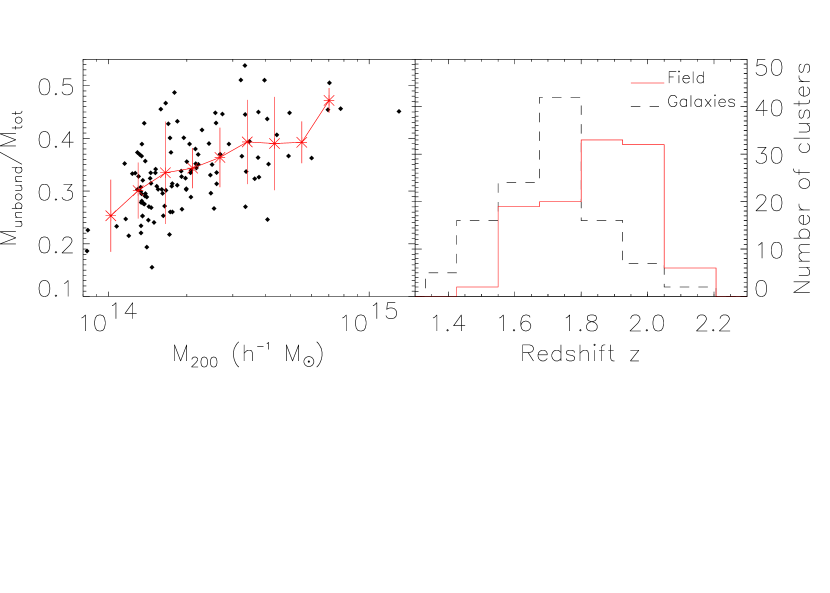
The simulation also records the age of formation of each star particle. In Fig. 3 we investigate the age distribution of the IC stellar components: stars in the diffuse component formed from their parent gas particles at an earlier average redshift (), than “bound” stars (), with no evidence for a dependence on cluster mass. Our cosmological simulation predicts that the stars in the IC component are older.
Two numerical effects can influence our results: the numerical resolution, and the parameter for substructure identification. To study the first effect, we simulated a cluster with total mass , and a mass resolution increased by a factor 3 and 10 respectively (R3 and R10 runs, here below). Softening was rescaled as . Initial conditions for these simulations were generated using the “zoomed initial conditions” technique (Tormen et al. 1997), which increases the resolution in the cluster Lagrangian region while maintaining a coarse sampling of the surrounding structures to account for their tidal field. We find that the amplitude and slopes of the density profiles for both bound and unbound stars are almost unchanged at radii as large as kpc (see Fig. 2). The lower resolution in our simulation may lead to an enhancement of the unbound population because of numerical over-merging. However, when we increase the resolution by a factor 10 in mass and in force, the fraction does not change substantially: we find in LSCS, for R3, and for R10 for the same cluster, suggesting that the numerical resolution has only a small effect. Moreover, a recent analysis of simulations of clusters having similar resolution to our R3 (Sommer–Larsen et al. 2004), has independently confirmed the value reported here.
The SKID length parameter does influence the behaviour of both “bound” and “unbound” components in a number of expected trends, i.e., the mass of the cD galaxy and the value of increase. However, even when kpc, the fraction of IC light is not smaller than in the less massive clusters. Among those values that we checked, kpc ensures the best dynamical separation between the two stellar components at the cluster centers.
4. Discussion
We used a cosmological simulation of to study the statistical properties of the IC light in clusters of galaxies and the dependence of its physical properties on cluster mass and X-ray temperature. These predictions can be tested against known properties of cD halos and used to plan observational tests to understand the physical properties of IC light.
The presence of the IC component is evident when the whole distribution of stars in the simulated clusters is analysed in a way similar to Schombert’s (1986) photometry of BCGs. Galaxies at the center of our simulated clusters have surface-brightness profiles which turn strongly upward in a plot. This light excess can be explained as IC stars orbiting in the cluster potential. Integrating its density distribution along the LOS, the slopes from our simulations are in agreement with those observed for the surface brightness profiles of the diffuse light in nearby clusters. In the Coma cluster, Bernstein et al. (1995) parametrize the surface brightness as and find that the diffuse light is best fit by . In the Fornax cluster, the surface brightness profile of the cD envelope of NGC 1399 follows a power law of the form with (Bicknell et al. 1989).
At large cluster radii, the surface brightness profile of the IC light appears more centrally concentrated than the surface brightness profile of cluster galaxies (see Fig. 1 and Fig. 2). From the simulations we also obtained the redshifts at which the stars formed: those in the IC component have a distribution which differs from that in cluster galaxies, see Fig. 3. The “unbound” stars are formed earlier than the stars in galaxies. The prediction for an old stars’ age in the diffuse component agrees with the HST observation of the IRGB stars in the Virgo IC field, e.g. Gyr (Durrell et al. 2002), and points toward the early tidal interactions as the preferred formation process for the IC light. The different age and spatial distribution of the stars in the diffuse component indicate that it is a stellar population that is not a random sampling of the stellar populations in cluster galaxies.
The more massive clusters have the largest fraction of diffuse light (Fig. 3). It is for cluster masses . Our simulations may thus explain the low inferred star-formation efficiency in clusters vs. less massive structures (David 1997). If only the bound stellar mass is accounted for in the ratio of the total cluster stellar mass vs. cluster gas mass in our LSCS, then this ratio decreases from groups to rich clusters. The observational trend would then be reproduced in the simulation. Similarly, the disagreement found between the amount of stars produced in clusters in our LSCS and in observed clusters (see B04) is less severe, if an IC component is present in real clusters and has been systematically neglected when evaluating their internal stellar mass budget.
The main result of this work is that large cosmological hydrodynamical simulations are in qualitative agreement with the observed properties of diffuse light in galaxy clusters. A quantitative assessment will require additional numerical efforts and more observations. A detailed study of the dynamical history of the unbound stellar population in our simulation will be presented in a forthcoming work.
References
- Arnaboldi et al. (2003) Arnaboldi, M. et al. 2003, AJ, 125, 514
- Arnaboldi (2003) Arnaboldi, M. 2003, ASP Conf. Series, 217 in press (astro-ph/0310143)
- Arnaboldi et al. (1994) Arnaboldi, M., Freeman, K. C., Hui, X., Capaccioli, M., & Ford, H. 1994, ESO Messenger, 76, 40
- Bernstein et al. (1995) Bernstein, G. M., Nichol, R. C., Tyson, J. A., Ulmer, M. P., & Wittman, D. 1995, AJ, 110, 1507
- Bicknell et al. (1989) Bicknell, G. V., Bruce, T. E. G., Carter, D., & Killeen, N. E. B. 1989, ApJ, 336, 639
- (6) Borgani, S., Murante, G., Springel, V., Diaferio, A., Dolag, K., Moscardini, L., Tormen, G., Tornatore, l., & Tozzi, P., 2004, MNRAS, 348, 1078
- Castro-Rodriguez et al. (2003) Castro-Rodriguez, N., et al. 2003, A&A, 405, 803
- David (1997) David, L.P. 1997, ApJ, 484, L11
- Dressler (1979) Dressler, A. 1979, ApJ, 236, 351
- Dolag et al. (2004) Dolag, K., Jubelgas, M., Springel, V., Borgani, S., & Rasia, E., 2004, ApJ, submitted
- Dubinsky (1998) Dubinski, J. 1998, ApJ, 502, 141
- Durrell et al. (2002) Durrell, P., et al. 2002, ApJ, 570, 119
- Durrell et al. (2003) Durrell, P., et al. 2003, ASP Conf. Series, 217 in press (astro-ph/0311130)
- Feldmeier et al. (2002) Feldmeier, J.J., et al. 2002, ApJ, 575, 779
- Feldmeier et al. (2003) Feldmeier, J.J., et al. 2003, ApJS, 145, 65
- Ferguson et al. (1998) Ferguson, H., Tanvir, N. R., & von Hippel, T. 1998, Nature, 391, 461
- Gal-Yam et al. (2003) Gal-Yam, A., et al. 2003, AJ, 125, 1087
- Gonzalez et al. (2000) Gonzalez, A.H., et al. 2000, ApJ, 536, 561
- Kormendy (1980) Kormendy, J. 1980. ESO workshop on Two dimentional Photometry, ed. P. Crane & K. Kjar (Leiden:Sterrenacht Leiden) 191
- Haardt & Madau (1999) Haart, F., & Madau, P. 1999, ApJ, 461, 20
- Napolitano et al. (2003) Napolitano, N.R., et al. 2003, ApJ, 594, 172
- Napolitano et al. (2002) Napolitano, N.R., Arnaboldi, & M., Capaccioli, M. 2002, A&A, 383, 791
- Schombert (1986) Schombert, J. 1986, ApJS, 60, 603
- (24) Sommer–Larsen, J., Romeo, A.D., & Portinari, L., MNRAS, submitted, astro-ph/0403282
- (25) Springel V., & Hernquist L., 2003, MNRAS, 339, 289
- (26) Springel, V., Yoshida, N., & White, S.D.M., 2001, NewA, 6, 79
- (27) Stadel, J., 2001, Ph.D. Thesis, Washington
- (28) Tormen, G., Bouchet, F. R., & White, S.D.M., 1997, MNRAS, 286, 865
- (29) Tormen, G., Moscardini, L., & Yoshida, N., 2004, MNRAS, in press (astro-ph/0304375)