Mc Neil’s Nebula in Orion: The Outburst History11affiliation: Based on observations obtained at the Llano del Hato National Astronomical Observatory of Venezuela, operated by CIDA for the Ministerio de Ciencia y Tecnología, and at the Fred Lawrence Whipple Observatory of the Smithsonian Institution, USA
Abstract
We present a sequence of I-band images obtained at the Venezuela 1m Schmidt telescope during the outburst of the nebula recently discovered by J.W. McNeil in the Orion L1630 molecular cloud. We derive photometry spanning the pre-outburst state and the brightening itself, a unique record including 14 epochs and spanning a time scale of years. We constrain the beginning of the outburst at some time between Oct. 28 and Nov. 15, 2003. The light curve of the object at the vertex of the nebula, the likely exciting source of the outburst, reveals that it has brightened magnitudes in about 4 months. The time scale for the nebula to develop is consistent with the light travel time, indicating that we are observing light from the central source scattered by the ambient cloud into the line of sight. We also show recent FLWO optical spectroscopy of the exciting source and of the nearby HH 22. The spectrum of the source is highly reddened; in contrast, the spectrum of HH 22 shows a shock spectrum superimposed on a continuum, most likely due to reflected light from the exciting source reaching the HH object through a much less reddened path. The blue portion of this spectrum is consistent with an early B spectral type, similar to the early outburst spectrum of the FU Ori variable V1057 Cyg; we estimate a luminosity of . The eruptive behavior of the McNeil nebula source, its spectroscopic characteristics and luminosity, suggest we may be witnessing an FU Ori event on its way to maximum. Further monitoring of this object will decide whether it qualifies as a member of this rare class of objects.
1 Introduction
Last February 9, 2004, the discovery of a new nebula, roughly 12’ south of the reflection nebula NGC 2068 (M78) in the L1630 molecular cloud of the Orion star-forming complex was announced by McNeil (2004). The region surrounding the newly revealed object contains a number of pre-main sequence stars, as well as Herbig-Haro objects HH 22 and HH 23 (Eislöeffel & Mundt, 1997). The IRAS source 05436-0007 (Clark, 1991) is located at the vertex of the new nebula, but was not identified by him as a young object. The 2MASS images show an extremely red source at this position (J05461313-0006048), but no object is visible at optical wavelengths in Palomar Observatory Sky Survey plates. More recently, dust continuum imaging of this region by Lis, Menten & Zylka (1999) revealed several sources at 350 and m. They suggest that their source LMZ 12, spatially coincident with IRAS 05436-0007, is a Class 0 source with , and the probable exciting source of HH 23, located north of the new nebula.
This new nebula was made widely known by B. Reipurth’s announcement in the Star Formation Newsletter No. 136111http://www.ifa.hawaii.edu/reipurth/newsletter.htm. In a follow up study Reipurth & Aspin (2004) indicate that the object brightened by magnitudes in the near infrared, and that its optical and K-band spectra show a certain resemblance with EXors. On the other hand, the object may be undergoing an FU Ori type eruption, which would imply a larger variation in brightness and a longer period at maximum light (Herbig 1977). To discriminate between these possibilities both pre-outburst and post-outburst observations are needed.
We report here optical images, photometry and spectroscopy of the McNeil Nebula, previous to its brightening, and during the outburst itself. These observations span 5 years, with a particularly good coverage of the time when the outburst started. The observations were obtained during a sensitive optical variability study spanning most of the Orion OB1 Association (Briceño et al. 2001).
2 Observations and Data Analysis
Our large scale photometric variability study of the Orion OB1 association (see Briceño et al. [2001] for details) has been carried out with the QuEST camera on the 1m Schmidt telescope at the Llano del Hato National Astronomical Observatory in Venezuela (see Baltay et al. [2002] for details of the instrument). The camera consists of 16 (in a array) front illuminated CCDs with pixels, although only three rows of 4 CCDs are presently operational; the plate scale is /pix. The instrument is optimized to work in drift-scan mode along strips of the sky, wide, at constant declination. Each row of 4 CCDs is fitted with a different filter. The equivalent exposure time (the time an object takes to cross a chip at ) is 140s.
The region we have been monitoring since January 1999 is centered at , and spans the range of to . We used one V and two I filters to cover the three good rows of CCDs. Given the location of the source of McNeil’s nebula (), and because the V filter is located in the westernmost part of the array, we detected the nebula only in the I band at the very end of most scans.
We were able to recover the nebula in 19 observations on 14 different nights, from January 9, 1999 to January 28, 2004 (Table 1). We obtained an additional I-band observation on February 26, 2004 with the 4Shooter CCD Mosaic camera installed on the SAO 1.2m telescope on Mt. Hopkins, Arizona. Thus, our dataset spans 1874 days and includes the period when the nebula began to brighten up. All observations were obtained at an airmass of , and the seeing ranged from arcsec. The reduction and processing of the Schmidt data was done with custom made automated software (see Vivas et al. [2004] for details) that produces magnitudes and accurate positions for all point sources in the region, including a variability flag. The 4Shooter images were processed using custom IDL routines.
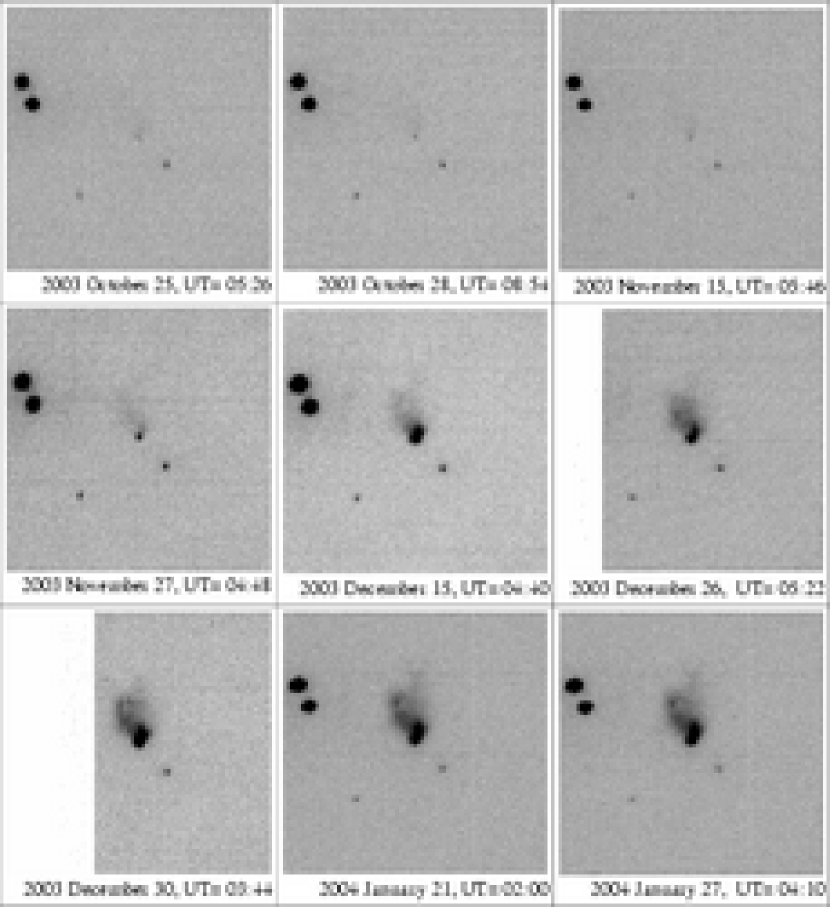
In Fig. 1 we show a sequence of I-band images obtained between Oct.25, 2003 and Jan.26, 2004 at Llano del Hato. A faint source is barely visible in Oct. 2003, and it begins to brighten up significantly between Nov 15 and 23, 2003, when the nebula begins to be barely detectable to the NW. The nebula exhibits significant brightening and evolution from this date on, while the source at its vertex continues to get brighter. By Jan.20, 2004 the object had mostly reached the state it revealed in the discovery and subsequent images.
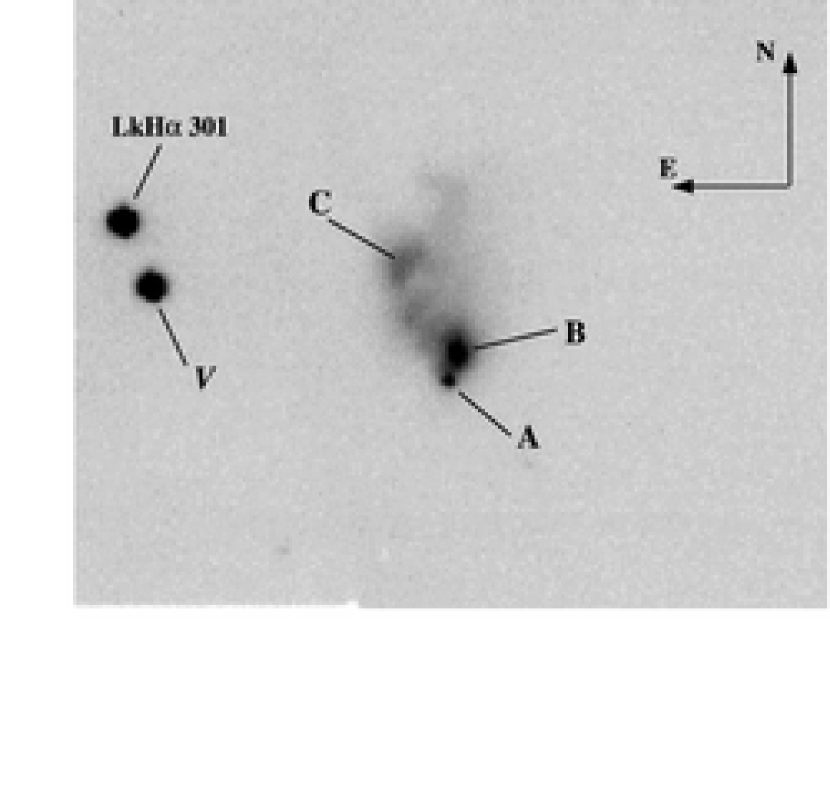
In order to measure the brightness of the new nebula and its apparent source, we selected 14 reference stars calibrated as secondary standards with Landolt (1992) fields, with magnitudes =12 - 16 and colors V- 1.4 - 3.9; these stars are located near the nebula () and have on average 25 measurements spanning 5 years, showing no significant variability over that time frame, thus making them robust comparison stars. We could not use our automated software for the new observations of the nebula because it does not handle photometry of extended objects. Thus, we used standard IRAF222IRAF is distributed by the National Optical Astronomy Observatories, which are operated by the Association of Universities for Research in Astronomy, Inc., under cooperative agreement with the National Science Foundation. routines to perform differential photometry in several parts of the nebula. We measured three different positions within the nebula: A, B and C, shown in Fig. 2; these were defined as offsets from the star labeled in Fig. 2 (). In this way, we were able to measure early images when the nebula was barely detected or not seen at all. Because our images had FWHM , we used an aperture radius= (for comparison stars and locations on the nebula). The region we call A is centered on the nebula vertex, located W, and S from star . In all images this object looks like a point source.333 Because of the large aperture our measurements include nebulosity inmediately surrounding this object. Aspin (2004), private communication, measured the source at the vertex through a much smaller aperture () on Gemini North GMOS images taken on UT Feb. 03, 2004 through a SDSS i’ filter, and found a 1.2 magnitude difference with respect to our Feb. 26, 2004 value. Our second aperture (B) was centered on the nebulosity just north of the star. Its location is W, S from . Finally, the third aperture (C) was placed on top of the object HH 22, which also brightened during the event (see Fig. 1), centered at W, N of . Since the region immediately surrounding the apertures is filled with nebulosity we could not use an annulus to measure the sky brightness. Instead, the sky was measured by taking the average value of small boxes (3x3 pixels) in 10-12 different locations outside and near the nebula.
In Fig. 3 we show the resulting light curve of A, B, and C. Our data suggest that even in its ”quiescent” phase, with a mean magnitude , source A is variable on time scales of a few years at the 0.7 mag level, with an extreme range of mags (the nebular structure is not visible in our pre-outburst images); this is consistent with reports of this object appearing in an image from 1966, although rather fainter than at present (Tytell, 2004). By the time of our first 2003 observations on Oct. 25 and 28, source A had brightened by mags compared to Jan. 2003. But the more dramatic rise in brightness occurred sometime after Oct. 28 and before Nov. 15, when it was 1.8 mag brighter than its mean level. We measured a total increase of magnitudes in about 4 months. Source B closely traces the behavior of A after Oct. 2003, but is on average 0.6 mags fainter and its brightness does not increase significantly until Nov. 27, a delay of roughly 18 days respect to A. Source C, spatially coincident with HH 22, is close to our detection threshold of until Dec.15, when it is clearly visible at . This represents a delay of days with respect to source A. Finally, our most recent data from Feb.26, 2004, strongly suggests that the rate of brightening has diminished. If we assume a distance of 400 pc as for HH 22 and 23 (Anthony-Twarog, 1982), and consider the separations A-B= (0.016 pc) and A-C= (0.071 pc), we derive a light travel time of 19 days between A and B, and 85 days between A and C. This is consistent with the delays inferred from the light curve in Fig.2, and indicates that we are observing light scattered into the ambient cloud, possibly coming out through a cavity opened in the embedded source’s envelope.
Optical spectra were obtained the night of Feb.18. 2004 at positions A and C of the new nebula, using the 1.5 meter telescope of the Whipple Observatory with the FAST Spectrograph (Fabricant et al., 1998), equipped with the Loral CCD. The spectrograph was set up with a 300 groove grating and wide slit (oriented at PA = 90∘), yielding 3400 Å of spectral coverage centered at 5500 Å and a resolution of Å. The spectra were reduced and wavelength calibrated using the standard IRAF routines. The effective exposure time at each slit position was 1200s. The spectra were corrected for the relative system response using the IRAF sensfunc task and observations of spectrophotometric standard stars.
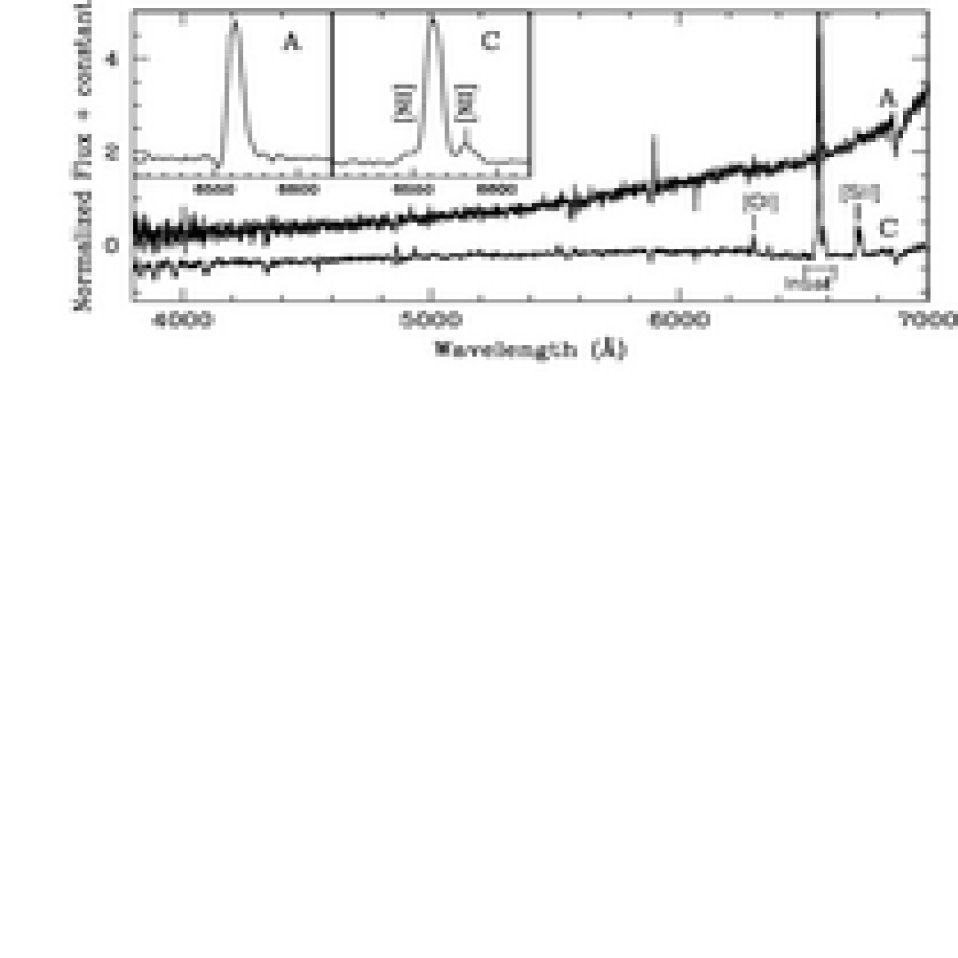
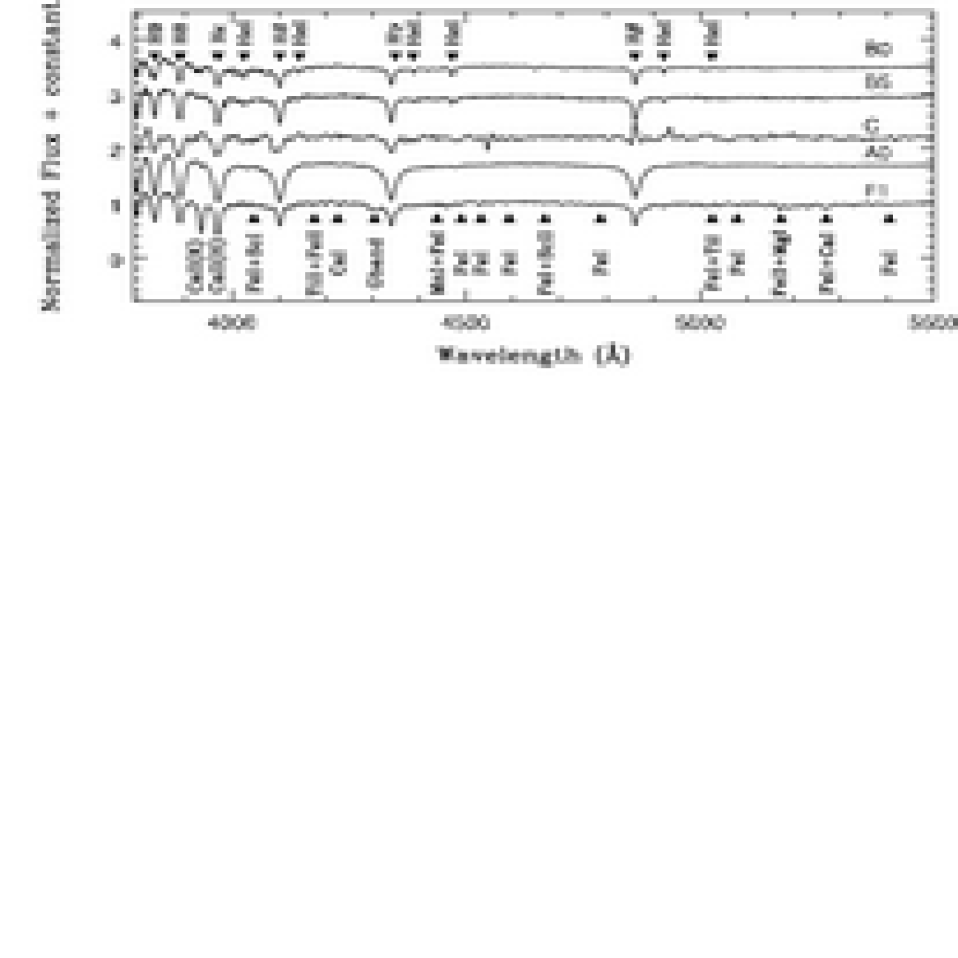
Spectra of A and C are shown in the upper panel of Fig. 4. The spectrum of A corresponds to a heavily reddened source, in agreement with the derived from 2MASS JHKs colors; depending upon the spectral type (see below) and reddening law adopted, the continuum in the visual range suggests , which may be underestimated since there may be a significant scattered light component. The most conspicuous feature is strong emission at H. In contrast, the spectrum of C is much flatter, indicating much less reddening; it also exhibits a number of forbidden lines, in particular [OI] 6300, 6363Å; [SII] 6716, 6730 Å; [NII] 6548, 6583 Å; and emission in H and H. The blue portion of the spectrum of C shows the higher Balmer lines in absorption; in the lower panel of Fig. 4, we compare with spectroscopic standards. The strength of the Balmer lines is consistent with either an early B or an early F type, as shown in the figure. However, the absence of the G band and the weakness of Ca II K favor an early B spectrum.
We suggest that we have here a situation similar to the case of the embedded FU Ori object L1551, where the optical spectrum of the object was obtained by observing its light reflected by the nearby HH 102 (Mundt et al. 1985). If the line of sight from A to C has been cleared out by the outflow which created HH 22 at the wind-cloud interaction region, then the spectrum of A that reaches C is much less reddened than that in Earth’s direction. The spectrum of C consists of an emission line spectrum, arising mostly in situ from the shock front(s), plus the reflected, lightly reddened spectrum of A. Thus, the spectrum of C gives us direct information of the spectrum of the driving source, which in the blue appears to be close to that of an early B star.
3 Discussion
The behavior of the McNeil nebula is reminiscent of the early evolution of the outbursts of FU Ori and V1057 Cyg (Herbig 1977). The optical (red) rise of McNeil, mag in about a third of a year, is not much different than the early rise of these two objects, prototypical of the FUor class; moreover, the rise time of another FUor, V1515 Cyg, was much longer, indicating that the rate of brightening is not a universal quality among these objects. Like the McNeil object, V1057 Cyg initially showed a P Cygni profile on strong H emission (see inset in Figure 4), evolving into stronger (blue-shifted) absorption later on. Strong absorption in the upper Balmer lines was also present in spectra of V1057 Cyg, classified as B3 by (Welin, 1971). However, the lack of He I lines lead Herbig to assign an approximate type of early A (Herbig 1977). Herbig also noted the presence of wide emission at the Ca II resonance lines, which lead to a very weak Ca II 3933 Å absorption; this is also consistent with our optical spectra.
The eruptive behavior suggests that this may be an FU Ori object on its way to maximum, or possibly a member of the so-called class of EXors (Herbig 1977), which exhibit similar or smaller increases in optical brightness but last shorter periods of time. Continued monitoring should better help distinguish between these possibilities. Given the small number of objects in the FUor and EXor classes, it may be that there exists a continuum of outburst behavior which will be filled in by the discovery of additional objects. We note that at its recent brightness of , assuming , a distance of 400 pc, and adopting an A0 spectral type as a compromise between the range of spectral types we inferred before, the system luminosity is (and would be higher if the intrinsic spectrum is earlier); this large luminosity is more similar to FUors than EXors.
The eruptive mechanism of FUors, and likely also that of EXors, is thought to be rapid outbursts in disk accretion (Hartmann & Kenyon 1996), possibly driven by the pile up of material in a disk due to rapid protostellar envelope infall (Kenyon & Hartmann 1991). The estimated bolometric luminosity and a SED like that of a Class 0 source (Lis, Menten & Zylka, 1999) is consistent with the pre-outburst object being a low-mass protostar. This object looks more similar to FU Oris, which are often highly embedded (Hartmann & Kenyon 1996) than EXors, which seem to be much less extincted. This very interesting source warrants further monitoring to help determine its true nature.
References
- Anthony-Twarog (1982) Anthony-Twarog, B.J. 1982, AJ, 87, 1213
- Baltay et al. (2002) Baltay, C. et al. 2002, PASP, 114, 780
- Briceño et al. (2001) Briceño, C. et al. 2001, Science, 291, 93
- Clark (1991) Clark, F.O. 1991, ApJS, 75, 611
- Eislöeffel & Mundt (1997) Eislöeffel, J. & Mundt, R. 1997, AJ, 114, 280
- Fabricant et al. (1998) Fabricant D., Cheumets P., Caldwell N., and Geary J., 1998, PASP, 110, 79.
- Hartmann & Kenyon (1996) Hartmann, L. & Kenyon, S.J. 1996, ARA&A, 34, 207
- Herbig (1977) Herbig, G. H. 1977, ApJ, 217, 693
- Landolt (1992) Landolt, A. 1992, AJ, 104, 340
- Lis, Menten & Zylka (1999) Lis, D.C., Menten, K.M., Zylka, R. 1999, ApJ, 527, 856
- McNeil (2004) McNeil, J.W. 2004, IAUC, 8284, 1
- Mundt et al. (1985) Mundt, R., Stocke, J., Strom, S. E., Strom, K. M., & Anderson, E. R. 1985, ApJ, 297, L41
- Tytell (2004) Tytell, D. 2004, http://skyandtelescope.com/news/, Feb. 19, 2004
- Reipurth & Aspin (2004) Reipurth, B. & Aspin, C. 2004, ApJ, in press
- Strom, Strom, & Kinman (1974) Strom, K. M., Strom, S. E., & Kinman, T. D. 1974, ApJ, 191, L93
- Vivas et al. (2004) Vivas, A.K. et al. 2004, AJ, 127, 1158
- Welin (1971) Welin, G. 1971, Inf. Bull. Var. Stars, No. 581.

| UT Date | Scan No. | UT | JD | Source A | |
|---|---|---|---|---|---|
| yyyy mm dd | h:mm:ss | () | |||
| 1999 01 09 | 528 | 6:18:43 | 2451187.7630 | 18.44 | 0.11 |
| 1999 12 18 | 503 | 4:10:58 | 2451530.6743 | 20.27 | 0.52 |
| 1999 12 18 | 504 | 6:39:32 | 2451530.7775 | 19.89 | 0.42 |
| 2002 11 01 | 503 | 8:05:18 | 2452579.8370 | 18.69 | 0.45 |
| 2002 11 01 | 504 | 9:35:02 | 2452579.8993 | 18.82 | 0.41 |
| 2003 01 29 | 511 | 0:38:00 | 2452668.5264 | 18.79 | 0.12 |
| 2003 10 25 | 550 | 5:26:15 | 2452937.7266 | 17.99 | 0.08 |
| 2003 10 28 | 501 | 8:54:00 | 2452940.8708 | 17.91 | 0.08 |
| 2003 11 15 | 500 | 5:46:19 | 2452958.7405 | 17.34 | 0.07 |
| 2003 11 15 | 501 | 6:28:19 | 2452958.7697 | 17.40 | 0.07 |
| 2003 11 27 | 501 | 4:48:12 | 2452970.7001 | 16.85 | 0.03 |
| 2003 11 27 | 502 | 5:31:12 | 2452970.7300 | 16.87 | 0.03 |
| 2003 11 28 | 511 | 4:48:12 | 2452971.7001 | 16.71 | 0.07 |
| 2003 11 28 | 512 | 5:34:12 | 2452971.7321 | 16.72 | 0.04 |
| 2003 12 15 | 501 | 4:40:00 | 2452988.6944 | 15.38 | 0.02 |
| 2003 12 15 | 502 | 5:26:34 | 2452988.7268 | 15.38 | 0.02 |
| 2003 12 26 | 500 | 5:22:04 | 2452999.7237 | 15.30 | 0.02 |
| 2003 12 30 | 501 | 3:44:00 | 2453003.6556 | 14.81 | 0.03 |
| 2004 01 21 | 550 | 2:00:00 | 2453025.5833 | 14.83 | 0.02 |
| 2004 01 27 | 551 | 3:26:50 | 2453031.6436 | 14.68 | 0.03 |
| 2004 01 27 | 552 | 4:10:00 | 2453031.6736 | 14.65 | 0.04 |
| 2004 02 26aaFLWO 1.2m + 4Shooter CCD Mosaic camera observation. Combination of four 60s exposures. | 3:06:00 | 2453061.9208 | 14.40 | 0.08 | |