VLBA Astrometry of Compact Radio Sources
in the Spitzer First-Look Survey
Abstract
The NRAO Very Long Baseline Array (VLBA) was used at 1.4 GHz to image 20 compact sources in the inner 1° radius of the Spitzer VLA First-Look Survey. Twelve sources were detected with the VLBA, with peak flux densities above 2 mJy at 9-mas resolution. The positions of these VLBA detections have been measured in the International Celestial Reference Frame (ICRF) to 1 accuracies of 8 mas East-West and 4 mas North-South. These positions can help anchor ancillary data for the First-Look Survey to the ICRF and are being reported quickly to the community.
1 Introduction
Wide fields observed across the electromagnetic spectrum are beginning to be surveyed at 10-mas resolution, using the techniques of Very Long Baseline Interferometry (VLBI) to study sources stronger than about 0.1 mJy at 1.4 GHz (Garrett et al., 2001, 2004). The corresponding linear resolution is 90 pc or finer for a WMAP cosmology (Spergel et al., 2003). This faint radio population contains sources that are dominantly energized by star-formation, plus sources – the active galaxies – that are dominantly energized by massive black holes. VLBI surveys of these faint sources have two primary science goals: (1) for the star-forming galaxies, seek evidence for embedded candidate active galactic nuclei or else limit contributions from such nuclei; and (2) for the active galaxies, seek evidence for the active nuclei or else limit contributions from such nuclei. Being unaffected by obscuration, these VLBI surveys thus help constrain models for the growth of massive black holes over cosmic time. Moreover, although these VLBI surveys must be deep to probe the faint population, their limiting sensitivities are still such that confusing a luminous type IIn supernova like SN 1988Z (Williams et al., 2002) for a candidate active galactic nucleus is a potential problem only for redshifts below one-tenth.
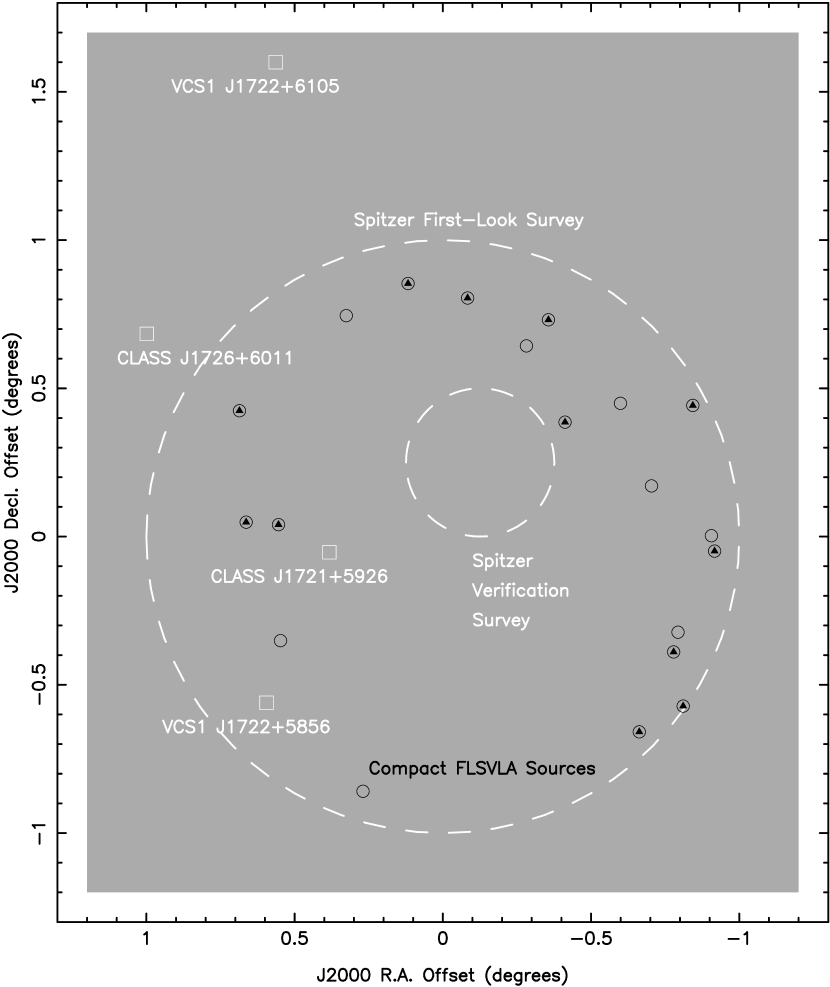
There are about 700 faint sources per square degree at 1.4 GHz in the VLA counterpart to the Spitzer First-Look Survey (FLSVLA; Condon et al., 2003). That VLA survey had a resolution of 5″ FWHM and uniformly covered the circular area with radius 1° that was guaranteed to be surveyed by Spitzer (Figure 1). Given the areal densities of the FLSVLA sources, it becomes both feasible and efficient to survey the faint radio population using VLBI phase referencing in the in-beam style (Wrobel et al., 2000).111Available at http://www.aoc.nrao.edu/vlba/html/MEMOS/scimemos.html. Such VLBI surveys require substantial time, telescope, and correlator resources, and therefore must be carefully optimized for maximum scientific return. Two key optimizing factors are the suitability of the in-beam phase calibrators used and the number of faint sources that appear adjacent to those in-beam phase calibrators.
As a step toward quantifying these factors within the 1° radial region shown in Figure 1, the NRAO Very Long Baseline Array (VLBA; Napier et al., 1994) was used to conduct phase-referenced observations at 1.4 GHz, in the nodding style (Wrobel et al., 2000), of 20 candidate in-beam calibrators that are unresolved and stronger than 5 mJy in the FLSVLA. Figure 1 shows the locations of these 20 compact FLSVLA sources, while Table 1 lists for each source the FLSVLA name, position, position error, and integrated flux density (Condon et al., 2003). Each compact FLSVLA source has an upper limit to its deconvolved diameter at FWHM of 2.2″ or less, so given the quoted position errors it is prudent to ensure that the VLBA search region covers a diameter of about 1-2″. Figure 1 also shows the guaranteed region, of radius 0.25°, for the deeper Spitzer Verification Survey. Although the rectangular observation regions are now known for the the First-Look and Verification Surveys, this work continues to emphasize these circular regions to optimize synergy with ancillary surveys conducted prior to those Spitzer surveys. Coincidentally, the region of diameter 0.5° shown for the Verification Survey corresponds to the primary beam at FWHM of a VLBA antenna at 1.4 GHz, a relevant factor in planning in-beam VLBI surveys.
As the nodding calibrator for the VLBA observations was selected from the VLBA Calibrator Survey (VCS1; Beasley et al., 2002), all compact FLSVLA sources detected with the VLBA will have their positions measured in the International Celestial Reference Frame (Extension 1) (ICRF-Ext.1; IERS, 1999; Ma et al., 1998). The positions of these VLBA detections can, therefore, help anchor ancillary data for the First-Look Survey to the ICRF, and the purpose of this paper is to report these positions quickly to the community. The VLBA observations and calibration are described in Section 2, while Section 3 describes the imaging strategies and the astrometric implications. A multi-wavelength analysis of both the detections and non-detections from the VLBA observations will be deferred until more ancillary data are available for the First-Look Survey. Also, future VLBI surveys and multi-wavelength studies will benefit from a new survey with the Westerbork Synthesis Radio Telescope that complements the FLSVLA survey by going deeper at 1.4 GHz over a narrower region with a resolution of 15″ FWHM (Morganti et al., 2004).
2 Observations and Calibration
The VLBA was used to observe the 20 compact FLSVLA sources and calibrators on 2004 January 9 UT. Nine of the 10 VLBA antennas particpated and provided antenna separations from 240 km to 5800 km. Data were acquired during about 5 hours in dual circular polarizations with 4-level sampling and at a center frequency 1.43849 GHz with a bandwidth of 32 MHz per polarization. This bandwidth was synthesized from 4 contiguous baseband channels, each of width 8 MHz. Phase-referenced observations were made in the nodding style at elevations above 20°. Successive 80-second observations of three FLSVLA sources were preceded and followed by a 60-second observation of the phase, rate, and delay calibrator VCS1 J17225856 (Beasley et al., 2002), leading to a switching time of 5 minutes. Switching angles between that calibrator and a FLSVLA source were 1.8° or less (Figure 1). The assumed position for VCS1 J17225856 was and , with 1 coordinate errors in the ICRF-Ext.1 of 8 mas and 4 mas, respectively. Each FLSVLA source was observed during 6 snapshots spread over time to enhance coverage in the plane. Figure 1 also shows the locations of calibrators CLASS J17215926, CLASS J17266011 (Myers et al., 2003), and VCS1 J17226105 (Beasley et al., 2002) that were observed similarly to each FLSVLA source but with switching angles of 0.6, 1.3, and 2.2°, respectively. Those calibrator observations were intended to assess phase-referencing conditions; in particular, if such a calibrator can be detected with an adequate signal-to-noise ratio during an 80-second observation, then it can be used to quanitify coherence losses. Finally, a strong calibrator J17405211 was observed to align the phases of the independent baseband channels. Observation and correlation assumed a coordinate equinox of 2000.
Data editing and calibration were done with the 2004 December 31 release of the NRAO AIPS software, using automatic scripts that follow the strategies outlined in Appendix C of the NRAO AIPS Cookbook 222http://www.aoc.nrao.edu/aips/cook.html. Diagnostic tables generated by the scripts were scrutinized to confirm the calibration quality. Data deletion was based on system flags recorded at observation and tape weights recorded at correlation. Corrections for the dispersive delays caused by the Earth’s ionosphere were made using electron-content models based on Global Positioning System data and derived at the Jet Propulsion Laboratory. VLBA system temperatures and gains were used to set the amplitude scale to an accuracy of about 5%, after first correcting for sampler errors. The visibility data for the phase, rate, and delay calibrator VCS1 J17225856 were used to generate phase-referenced visibility data for each FLSVLA source and for the calibrators CLASS J17215926, CLASS J17266011, and VCS1 J17226105. In contrast, the visibility data for VCS1 J17225856 and the strong source J17405211 were self-calibrated.
3 Imaging Strategies and Astrometric Implications
The AIPS task IMAGR was used to image the Stokes emission from each FLSVLA source and each calibrator. To reduce side-lobe levels for these multi-snapshot data from 36 antenna separations, the visibility data were weighted uniformly with robustness 0.5 and a sensitivity loss of about 10% relative to natural weighting was incurred. A two-stage approach to the imaging was taken. The first image, not cleaned, spanned 2048 1.5 mas in each coordinate and had a typical angular resolution characterized as an elliptical Gaussian with FWHM dimensions of 12.5 mas by 6.5 mas aligned nearly North-South (referred to as a resolution of 9 mas hereafter). The VLBA search region is well within the field-of-view (FOV) limits set by time and bandwidth averaging (Wrobel, 1995). The most constraining FOV limit follows from accepting a 10% drop in the peak amplitude of a true point source due to averaging over each 8-MHz baseband channel; the resulting FOV is elliptical with major axis 3600 mas and minor axis 1900 mas. Given the array, observation, and imaging parameters, a detection threshold of 6 2 mJy was adopted within the search region, a square of side 1870 mas. The right ascension and declination of the peak of that detection was recorded.
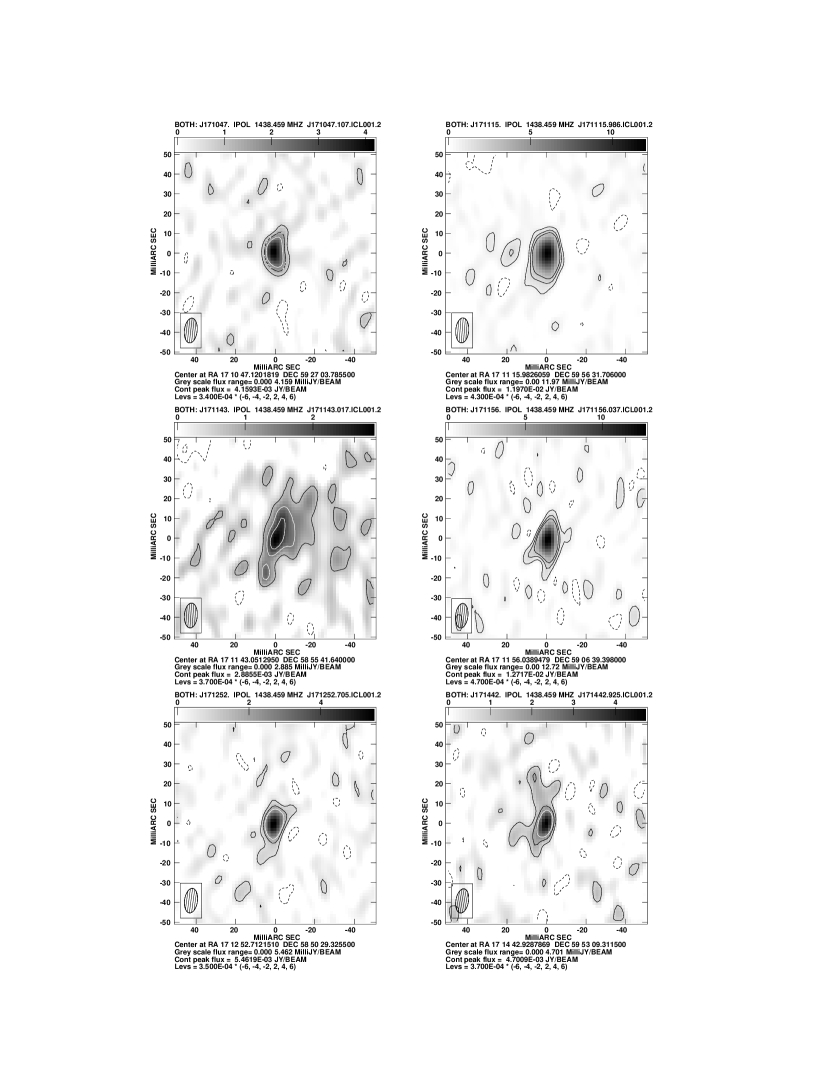
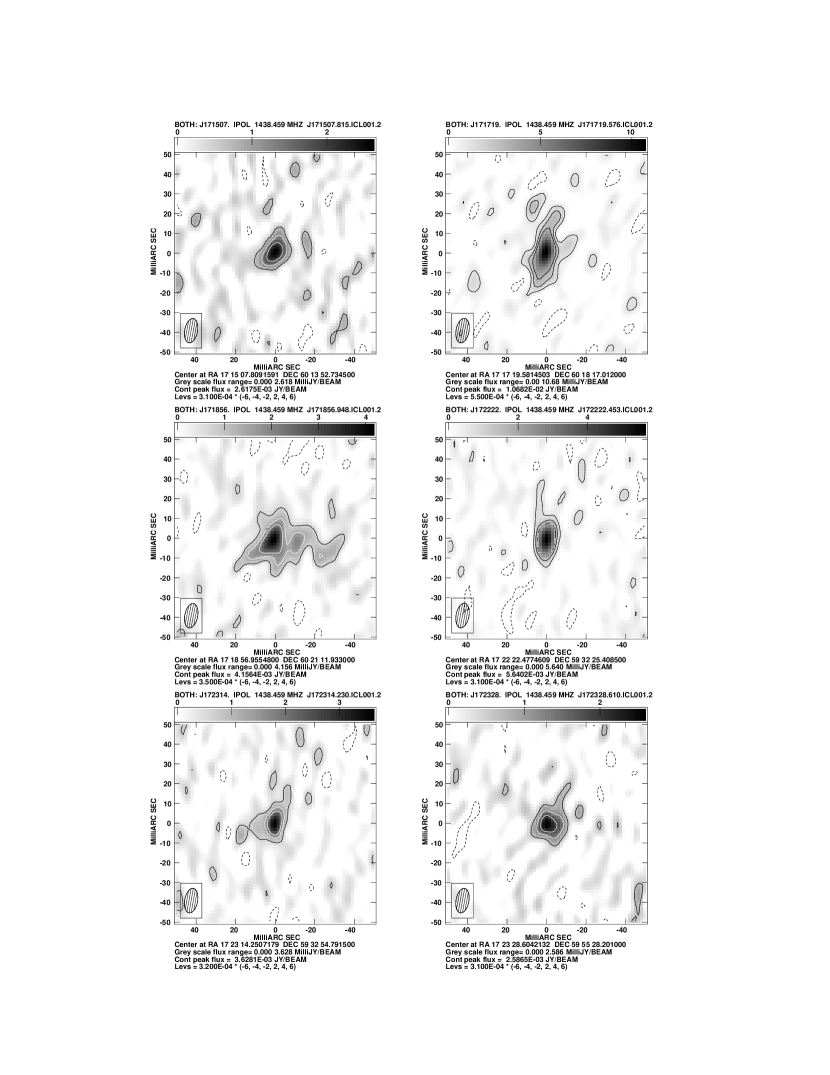
A second image was made for each VLBA detection, including the 12 of 20 FLSVLA sources marked with dark triangles in Figure 1 and all calibrators. This second image spanned 512 1.5 mas in each coordinate and was made by shifting the tangent point, as derived from the right ascension and declination of the peak in the first image, to the field center. These shifted images were cleaned in regions centered on the detections and spanning 9 mas East-West and 15 mas North-South for the isolated detections but spanning customized regions for the extended detections. These shifts were finite for the phase-referenced and cleaned images (shown in Figures 2 and 3) but zero by definition for the self-calibrated and cleaned images of VCS1 J17225856 and J17405211.
3.1 VLBA Non-Detections
Residual errors during phase referencing will degrade the point-source sensitivity of the VLBA. To quantify the effect of this loss of coherence, individual 80-second observations of calibrator VCS1 J17226105 were phase self-calibrated, imaged, and cleaned. (The two CLASS calibrators were too weak for self-calibration with individual 80-second observations, so they were not used to quantify coherence losses.) The peak intensity in the self-calibrated image of VCS1 J17226105 was 1.3 times the peak intensity in the phase-referenced image. Observations of this calibrator required a switching angle of 2.2°, but switching angles of less than 1.8° were needed to reach the FLSVLA sources. Therefore, a conservative correction for the loss of point-source sensitivity is about 1.3. For the VLBA non-detections in Table 1, the quoted 6 upper limits for a point source have been increased by this factor.
3.2 VLBA Detections
The bright components in the phase-referenced images (Figures 2 and 3) appear to be slightly resolved, but this apparent resolution is probably mostly artificial and due to residual phase errors. An elliptical Gaussian was fit to each of these VLBA images to yield the positions and integrated flux densities quoted in Table 1.
For the VLBA positions, the calculated error per coordinate is the quadratic sum of three terms: (a) the 1 error in the calibrator position; (b) the 1 error in the differential astrometry; and (c) the 1 error in the Gaussian fit. Term (c) was always found to be less than 1 mas. Term (b) was estimated empirically to be less than 1.5 mas, by noting that after ionospheric corrections the visibility phases still wound through 3-4 turns over the 5-hour observation and then scaling the corresponding 3-4 synthesized beamwidths by the ratio of the switching angles to a radian. This estimate is rough but plausible: median astrometric errors of up to 3 mas have been measured at 1.7 GHz for calibrator pairs separated by less than 2° when ionospheric corrections are not made (Chatterjee et al., 2004). For the present observations, the position of VCS1 J17226105 in the ICRF was too poorly known to serve as a useful check on the differential astrometry. Compared to terms (c) and (b), term (a) clearly dominates and gives VLBA position errors in right ascension and declination that always round to 8 mas and 4 mas, respectively. The tabulated VLBA positions can therefore help anchor ancillary data for the First-Look Survey to the ICRF, to a 1 accuracy of 8 mas East-West and a 1 accuracy of 4 mas North-South. The VLBA position errors represent more than a factor of ten improvement over the FLSVLA position errors. Further improvements to the VLBA astrometry are quite feasible, since the VLBA position error is dominated by the uncertainty in the calibrator position, and the prospects of reducing that uncertainty to the 1-mas level are quite good (and are being actively pursued).
For the VLBA integrated flux density, no corrections were made for coherence losses and the tabulated error is the quadratic sum of the 5% scale error and the error in the Gaussian model. To within their combined errors, the integrated flux density from the VLBA photometry is either equal to, or less than, that quoted from the FLSVLA survey. In the former case, an inference is that the compact FLSVLA sources have not varied significantly over the 17-35 months separating the VLA and VLBA observations. In the latter case, the most probable inference is the presence of significant source structure on scales less than a few arcseconds that is too weak and/or too large to be imaged with multiple VLBA snapshots.
Table 1 lists both VLA and VLBA positions for 12 sources. Since the VLBA position errors are much smaller than the quoted VLA position errors, the difference VLA minus VLBA is taken to be the true VLA error for these strong sources. The 1 VLA error derived in right ascension is 0.013 seconds of time, or about 0.096″, while in declination it is 0.08″. Thus these differences confirm the 0.1″ quoted for all strong sources by Condon et al. (2003). Moreover, the mean offsets are seconds of time in right ascension and in declination, so the VLA frame is off by a little over 2 in right ascension but is fine within 1 in declination. Careful users of the FLSVLA will therefore want to add 0.0088 seconds of time to all right ascensions published by Condon et al. (2003).
References
- Beasley et al. (2002) Beasley, A. J., Gordon, D., Peck, A. B., Petrov, L., MacMillian, D. S., Fomalont, E. B., & Ma, C. 2002, ApJS, 141, 13
- Chatterjee et al. (2004) Chatterjee, S., Cordes, J. M., Vlemmings, W. H. T., Arzoumanian, Z., Goss, W. M., & Lazio, T. J. W. 2004, ApJ, 604, 339
- Condon et al. (2003) Condon, J. J., Cotton, W. D., Yin, Q. F., Shupe, D. L., Storrie-Lombardi, L. J., Helou, G., Soifer, B. T., & Werner, M. W. 2003, AJ, 125, 2411
- Garrett et al. (2001) Garrett, M. A., et al. 2001, A&A, 366, L5
- Garrett et al. (2004) Garrett, M. A., Wrobel, J. M., & Morganti, R. 2004, in ASP Conf. Ser. ?, Future Directions in High Resolution Astronomy: The 10th Anniversary of the VLBA, ed. J. D. Romney & M. J. Reid (San Francisco: ASP)
- IERS (1999) IERS. 1999, 1998 Annual Report, ed. D. Gambis (Paris: Obs. Paris), 87
- Ma et al. (1998) Ma, C., et al. 1998, AJ, 116, 516
- Morganti et al. (2004) Morganti, R., Garrett, M. A., Chapman, S., Baan, W., Helou, G., & Soifer, B. T. 2004, A&A, in press
- Myers et al. (2003) Myers, S. T., et al. 2003, MNRAS, 341, 1
- Napier et al. (1994) Napier, P. J., Bagri, D. S., Clark, B. G., Rogers, A. E. E., Romney, J. D., Thompson, A. R., & Walker, R. C. 1994, Proc. IEEE, 82, 658
- Spergel et al. (2003) Spergel, D. N., et al. 2003, ApJS, 148, 175
- Williams et al. (2002) Williams, C. L., Panagia, N., Van Dyk, S. D., Lacey, C. K., Weiler, K. W., & Sramek, R. A. 2002, ApJ, 581, 396
- Wrobel (1995) Wrobel, J. M. 1995, in ASP Conf. Ser. 82, Very Long Baseline Interferometry and the VLBA, ed. J. A. Zensus, P. J. Diamond, & P. J. Napier (San Francisco: ASP), 413
- Wrobel et al. (2000) Wrobel, J. M., Walker, R. C., Benson, J. M., & Beasley, A. J. 2000, VLBA Scientific Memo 24
| Right Ascension | Declination | Position Error | Integrated | |||
|---|---|---|---|---|---|---|
| J2000.0 | J2000.0 | , | Flux Density | |||
| FLSVLA Name | (h,m,s) | (°,′,″) | (mas,mas) | (mJy) | Ref. | Fig. |
| (1) | (2) | (3) | (4) | (5) | (6) | (7) |
| J171047.1592703 | 17 10 47.107 | 59 27 03.82 | 100, 100 | 7.970.34 | 1 | … |
| 17 10 47.1202 | 59 27 03.786 | 8, 4 | 6.570.85 | 2 | 2 | |
| J171051.6593010 | 17 10 51.682 | 59 30 10.96 | 100, 100 | 6.790.29 | 1 | … |
| … | … | … | 2.4aa6- upper limit to the peak flux density at 9-mas resolution. | 2 | … | |
| J171115.9595631 | 17 11 15.986 | 59 56 31.58 | 100, 100 | 27.611.17 | 1 | … |
| 17 11 15.9826 | 59 56 31.705 | 8, 4 | 20.781.50 | 2 | 2 | |
| J171143.0585541 | 17 11 43.017 | 58 55 41.76 | 100, 100 | 113.334.81 | 1 | … |
| 17 11 43.0512 | 58 55 41.640 | 8, 4 | 2.920.40aa6- upper limit to the peak flux density at 9-mas resolution. | 2 | 2 | |
| J171148.5591038 | 17 11 48.526 | 59 10 38.87 | 100, 100 | 35.821.52 | 1 | … |
| … | … | … | 2.7aa6- upper limit to the peak flux density at 9-mas resolution. | 2 | … | |
| J171156.0590639 | 17 11 56.037 | 59 06 39.26 | 100, 100 | 16.480.70 | 1 | … |
| 17 11 56.0389 | 59 06 39.397 | 8, 4 | 17.031.29 | 2 | 2 | |
| J171225.4594014 | 17 12 25.462 | 59 40 14.98 | 100, 100 | 16.200.69 | 1 | … |
| … | … | … | 2.6aa6- upper limit to the peak flux density at 9-mas resolution. | 2 | … | |
| J171252.7585029 | 17 12 52.705 | 58 50 29.30 | 100, 100 | 7.530.32 | 1 | … |
| 17 12 52.7122 | 58 50 29.325 | 8, 4 | 6.810.77 | 2 | 2 | |
| J171312.9595657 | 17 13 12.936 | 59 56 57.99 | 100, 100 | 12.520.53 | 1 | … |
| … | … | … | 2.7aa6- upper limit to the peak flux density at 9-mas resolution. | 2 | … | |
| J171442.9595309 | 17 14 42.925 | 59 53 09.25 | 100, 100 | 8.290.35 | 1 | … |
| 17 14 42.9290 | 59 53 09.311 | 8, 4 | 6.780.93 | 2 | 2 | |
| J171507.8601352 | 17 15 07.815 | 60 13 52.70 | 100, 100 | 10.360.44 | 1 | … |
| 17 15 07.8092 | 60 13 52.735 | 8, 4 | 4.610.80 | 2 | 3 | |
| J171544.0600835 | 17 15 44.021 | 60 08 35.40 | 100, 100 | 12.610.54 | 1 | … |
| … | … | … | 2.6aa6- upper limit to the peak flux density at 9-mas resolution. | 2 | … | |
| J171719.5601816 | 17 17 19.576 | 60 18 16.97 | 100, 100 | 17.310.74 | 1 | … |
| 17 17 19.5816 | 60 18 17.012 | 8, 4 | 19.241.76 | 2 | 3 | |
| J171856.9602111 | 17 18 56.948 | 60 21 11.84 | 100, 100 | 14.110.60 | 1 | … |
| 17 18 56.9556 | 60 21 11.932 | 8, 4 | 11.071.44 | 2 | 3 | |
| J172004.1583827 | 17 20 04.153 | 58 38 27.62 | 100, 100 | 160.816.82 | 1 | … |
| … | … | … | 2.5aa6- upper limit to the peak flux density at 9-mas resolution. | 2 | … | |
| J172037.4601442 | 17 20 37.485 | 60 14 42.80 | 100, 100 | 5.340.23 | 1 | … |
| … | … | … | 2.4aa6- upper limit to the peak flux density at 9-mas resolution. | 2 | … | |
| J172216.1590856 | 17 22 16.185 | 59 08 56.74 | 100, 100 | 6.580.28 | 1 | … |
| … | .. | … | 2.4aa6- upper limit to the peak flux density at 9-mas resolution. | 2 | … | |
| J172222.4593225 | 17 22 22.453 | 59 32 25.47 | 100, 100 | 6.960.30 | 1 | … |
| 17 22 22.4775 | 59 32 25.408 | 8, 4 | 6.940.74 | 2 | 3 | |
| J172314.2593254 | 17 23 14.230 | 59 32 54.85 | 100, 100 | 6.850.29 | 1 | … |
| 17 23 14.2508 | 59 32 54.792 | 8, 4 | 5.030.78 | 2 | 3 | |
| J172328.6595528 | 17 23 28.610 | 59 55 28.18 | 100, 100 | 12.500.53 | 1 | … |
| 17 23 28.6040 | 59 55 28.201 | 8, 4 | 5.490.95 | 2 | 3 |
References. — (1) Condon et al. 2003; (2) this work.