Spectroscopic Confirmation of the Cl 1604 Supercluster at
Abstract
We present spectroscopic confirmation of the Cl 1604 supercluster at . Originally detected as two individual clusters, Cl 1604+4304 at and Cl 1604+4321 at , which are closely separated in both redshift and sky position, subsequent imaging revealed a complex of red galaxies bridging the two clusters, suggesting that the region contained a large scale structure. We have carried out extensive multi-object spectroscopy, which, combined with previous measurements, provides redshifts in this area, including 230 confirmed supercluster members. We detect two additional clusters that are part of this structure, Cl 1604+4314 at and Cl 1604+4316 at . All four have properties typical of local clusters, with line-of-sight velocity dispersions between 489 and 962 km s-1. The structure is significantly extended in redshift space, which, if interpreted as a true elongation in real space, implies a depth of . We examine the spatial and redshift distribution of the supercluster members.
Subject headings:
catalogues – surveys – galaxies: clusters: general – large-scale structure of the Universe1. Introduction
The Cl 1604 supercluster was initially detected as two separate clusters, Cl 1604+4304 at and Cl 1604+4321 at , in the plate-based survey of Gunn, Hoessel, & Oke (1986). Deeper imaging and multi-object spectroscopy taken with the Low Resolution Imaging Spectrograph (LRIS; Oke et al., 1995) at the Keck telescopes by Oke, Postman, & Lubin (1998, hereafter O98) yielded redshifts and preliminary velocity dispersions for each cluster (Postman, Lubin, & Oke, 1998, 2001, hereafter P98,P01). Motivated by the close separation of Cl 1604+4304 and Cl 1604+4321 in both radial velocity (4300 km s-1) and position on the sky (), Lubin et al. (2000) performed deep multi-band imaging with the Palomar 5-m telescope covering the area between the two clusters. The imaging revealed an overdensity of red galaxies whose colors were consistent with early-type galaxies at , suggesting that the clusters were part of a high-redshift supercluster.
To verify this conclusion, map the supercluster structure, and obtain a large sample of cluster galaxies with measured spectroscopic properties, we are conducting an extensive spectroscopic survey spanning the region between Cl 1604+4304 and Cl 1604+4321. In this Letter, we present spectroscopic confirmation of this large scale structure and a discussion of its properties based on the currently known supercluster members. We assume a CDM cosmology with and .
2. The Spectroscopic Survey
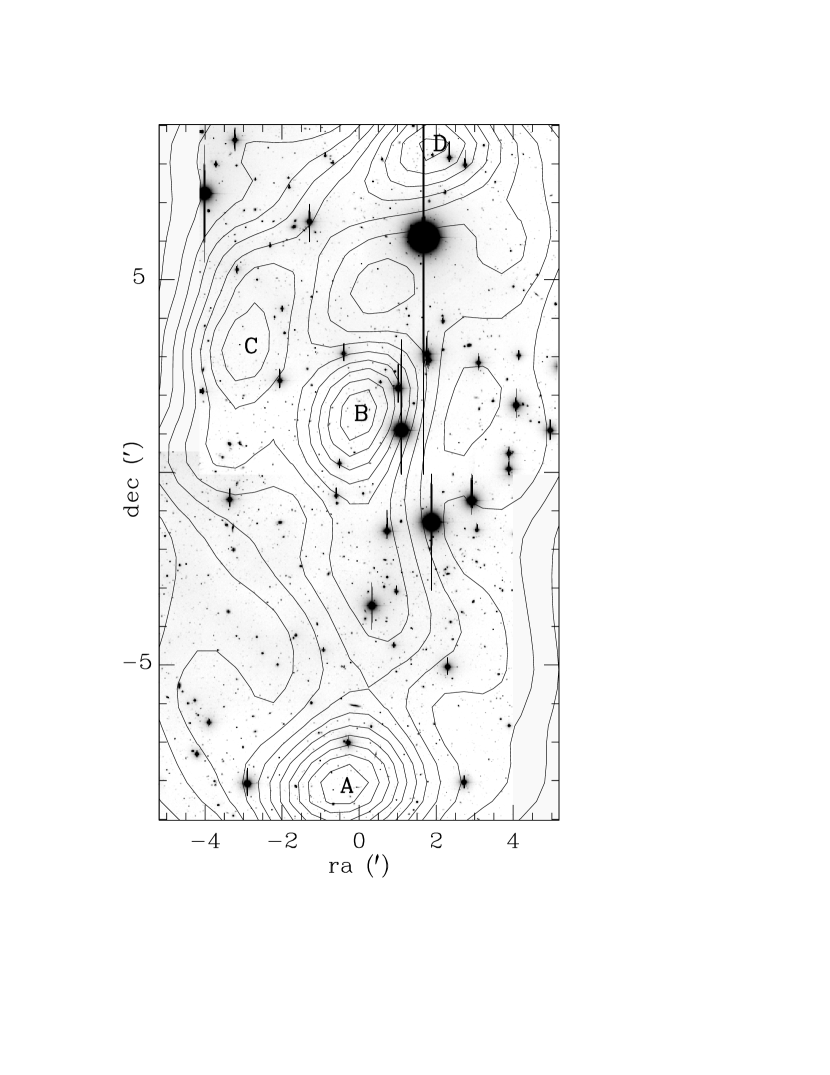
Here we briefly describe the spectroscopic survey of the Cl 1604 supercluster. A full discussion of the data acquisition and analysis procedures will be presented in the catalog paper (Gal, Lubin & Oke 2004, in preparation). The survey was conducted using LRIS and the Deep Imaging Multi-object Spectrograph (DEIMOS; Faber et al., 2003) on the Keck 10-m telescopes. Target selection was based on multi-band imaging (Lubin et al., 2000) taken at the Palomar 5-m telescope. A contiguous area of (4.8 Mpc Mpc) between the original two clusters was imaged in , , and Gunn filters. The galaxy catalog reaches a depth of , and for a detection. The resulting color-magnitude diagrams reveal a well-delineated red sequence of galaxies whose colors () are consistent with spectroscopically-confirmed, early-type galaxies in the two original clusters (see Figures 2 & 4 of Lubin et al., 2000). In Figure 1, we indicate on the composite band image all of these galaxies by overlaying contours of red galaxy density. These contours clearly delineate the large system of galaxies encompassing the original clusters. We also observe two strong concentrations of red galaxies directly between Cl 1604+4304 and Cl 1604+4321, suggesting the presence of two additional clusters. Objects within the red sequence were preferentially (but not exclusively) targeted for slit assignment in our current spectroscopic survey. Targets were observed with a combination of LRIS and DEIMOS slitmasks.
LRIS slitmasks covering parts of this region were observed on UT May 4-7, 2000. A total of six slitmasks were used, with objects per mask. Objects with magnitudes down to were included. Data were taken using the 400 l/mm grating blazed at 8500Å, with a central wavelength of 7000Å. This setup provides spectral coverage from 5500Å to 9000Å and a dispersion of 1.86Å pix-1; with the slits utilized, the resolution is 7.8Å (550 km s-1 at ). Seeing was typically . Four of the masks were exposed for s each, one mask for s, and one for s. HgNeArKr arc lamps, as well as flat fields, were observed immediately before and/or after each set of target exposures to provide wavelength calibration with the instrument and telescope in the same configuration, minimizing errors due to flexure. The data were processed using standard IRAF tasks and scripts.
To obtain a larger sample of objects, extending to fainter galaxies, and covering a wider spatial area, further spectroscopy was obtained with DEIMOS on UT 25-26 May 2003. Galaxies as faint as were selected, as well as some objects previously observed with LRIS but for which no redshift was obtained. We targeted objects on each mask. The instrument was configured with the 1200 l/mm grating, blazed at 7500Å. The central wavelength was set to 7700Å such that OII and Ca H and K at the redshift of the supercluster would be easily visible. Slit widths were 1”, and where possible, slits were aligned with the major axis of the galaxy. This configuration results in a pixel scale of 0.33Å pix-1, a resolution of 1.7Å (120 km s-1 in the cluster frame), and spectral coverage from 6385Å to 9015Å. We observed four masks with a total exposure time of 12600s (s) per mask. The large number of exposures permits excellent cosmic ray subtraction and a significant reduction in background noise. Seeing ranged from 0.9” to 1.5” on the first night and was nearly constant at on the second night. For each mask setup, we obtained a set of three internal flatfields, as well as an arc line calibration exposure with the NeArKrXe lamps. Data reduction was performed using the DEEP2 (Davis et al., 2003) version of the spec2d data reduction pipeline. Based upon the Sloan Digital Sky Survey (SDSS) spectral reduction package, this IDL software performs all of the standard processing steps, producing sky-subtracted, wavelength-calibrated one- and two-dimensional spectra111For details on this pipeline, see the DEEP2 website at http://astron.berkeley.edu/cooper/deep/spec2d/.
Redshifts for the LRIS and DEIMOS observations were all measured using an IRAF task called redsplot (T. Small, private communication). This tool allows the user to interactively identify features in the one-dimensional spectra and displays the locations of other possible features from a user-provided spectral line list. In this way, one can centroid various visible features and test different redshifts to find which produces a consistent set of identified lines. Median velocity errors for the LRIS and DEIMOS data are 150 and 90 km s-1, respectively.
The six LRIS masks contained a total of 179 slitlets; of these, 156 were distinct targets. An additional four objects were found serendipitously for a total of 160 unique objects. Identifications were made for 147 of these, with 116 (80%) being extragalactic, and 65 of these (56%) having redshifts within the supercluster range of . The four DEIMOS slitmasks had 326 unique slitlets. An additional 57 objects were detected serendipitously, yielding a total of 383 objects. Of these, we were able to identify 309 objects, only 22 of which are stars. Over 40% (122) of the identified objects were part of the supercluster complex. The combined LRIS and DEIMOS data give 378 unique extragalactic redshifts.
Our analysis also includes the original sample of LRIS spectroscopy measured for Cl 1604+4304 and Cl 1604+4321 (O98). Objects observed as part of that survey were distributed over an approximately region centered on each cluster. Redshifts were measured for 103 and 135 galaxies in the fields of Cl 1604+4304 and Cl 1604+4321, respectively (P98,P01).
The combined spectroscopic survey yields a total of 597 unique extragalactic redshifts. In Figure 2, we show the redshift histogram for the 289 galaxies in the range . There are four clear peaks in this distribution which correspond to the four member clusters of the supercluster. Redshift peaks at and belong to the original clusters, Cl 1604+4304 and Cl 1604+4321, respectively. The new clusters identified through the multi-band imaging (see Figure 1) correspond to the redshift peaks at (Cl 1604+4314) and (Cl 1604+4316). Table 1 lists the name, the reference letter used throughout the Letter, the central coordinates, and the median redshift for each cluster. The central coordinates and median redshift are measured from those galaxies which are counted as members in the detailed analysis of cluster membership presented in §3.

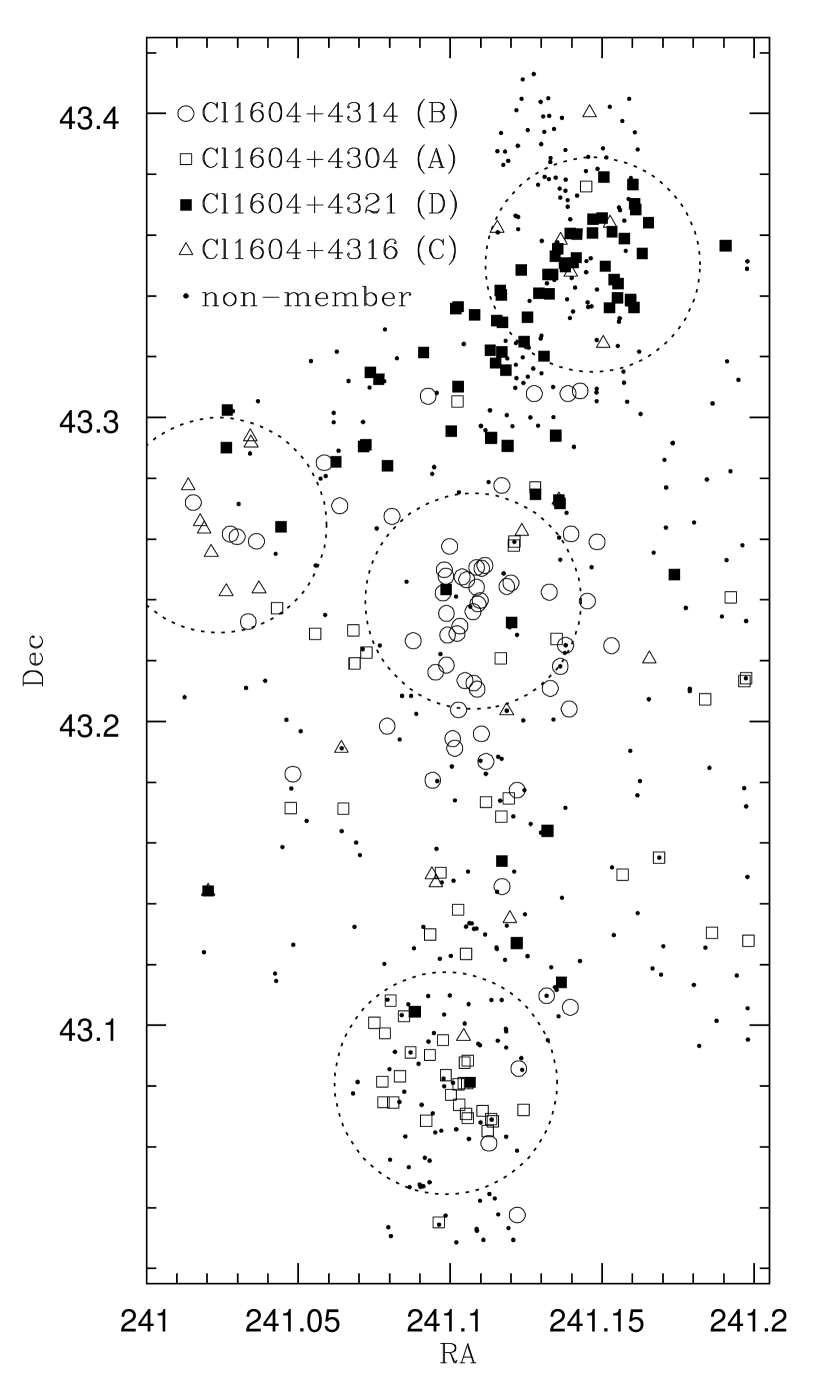
Figure 3 shows the location of all 597 spectroscopic galaxies, with the 229 confirmed supercluster members coded by cluster membership. Although the galaxies belonging to each member cluster appear reasonably concentrated and separated from one another, there is significant overlap throughout the supercluster region. In addition, the spatial distribution of galaxies suggests that we have not yet reached the edge of this structure. We note, however, that the region has not been uniformly sampled.
3. Cluster Properties
3.1. Velocity Dispersions
Velocity dispersions are notoriously difficult to calculate for galaxy clusters, although this has not prevented the publication of results using as few as ten redshifts per cluster. Selecting cluster members, a radius in which to include objects, the mathematical technique, and even the mean cluster redshift each pose their own subtle issues. These problems are compounded in densely populated areas where the individual clusters overlap in a larger structure. Nevertheless, we present initial estimates of the cluster velocity dispersions, while postponing detailed discussion for a future work, with the goal of demonstrating that the supercluster constituents are indeed significant structures, as suggested by P01.
To determine the membership of each supercluster component, we utilize the ROSTAT package (Beers, Flynn, & Gebhardt, 1990), which measures a wide variety of estimators for the location (median) and scale (line-of-sight dispersion) of a set of measurements. It avoids assumptions of gaussianity in the underlying velocity distributions (which is unlikely to be true for interacting clusters) and includes bootstrap and jackknife error estimation for the cluster redshifts and dispersions. Many of these estimators are significantly more resistant to non-gaussianity in the sample than the traditional Gaussian; large differences between the different scale estimates can be a sign of deviations from gaussianity (either in shape or due to outliers) in the sample.
We first visually divide our redshift histograms into separate (but overlapping) redshift ranges for each cluster, selecting a conservative (broad) range for each which clearly includes the entire structure. The median redshift of each cluster is measured, and initial, cosmologically corrected peculiar velocities for each galaxy in the cluster are calculated. These velocities are input into ROSTAT, which computes the biweight median velocity, and the line-of-sight dispersions and , among others. We then apply a shift to the velocities of each galaxy such that the biweight median velocity is zero, while preserving the dispersion. Objects with are then clipped from the sample, and the median and dispersions recalculated. This procedure is iterated until either the various dispersion measures converge, or there are no more objects to be clipped. For all clusters, the clipping results in removal of fewer than 10% of the input galaxies. The shaded regions in Figure 2 show the final redshift range for each cluster. Inspection of the spatial distribution of the clipped galaxies reveals that they are typically at large clustocentric distances. We note that using only those galaxies within the central 1.5 Mpc yields comparable dispersions.
| Cluster | ID | RA | Dec | Redshift | range | |||
|---|---|---|---|---|---|---|---|---|
| Cl 1604+4304 | A | 16 04 23.7 | +43 04 51.9 | 0.9001 | 0.8852 - 0.9146 | 67 | ||
| Cl 1604+4314 | B | 16 04 25.8 | +43 14 23.0 | 0.8652 | 0.8539 - 0.8791 | 62 | ||
| Cl 1604+4316 | C | 16 04 05.7 | +43 15 52.8 | 0.9350 | 0.9302 - 0.9420 | 24 | ||
| Cl 1604+4321 | D | 16 04 35.3 | +43 21 01.6 | 0.9212 | 0.9111 - 0.9302 | 77 |
For each cluster, Table 1 lists the final redshift range, median redshift, and number of galaxies, as well as two estimates of the line-of-sight velocity dispersion (in km s-1): , the biweight estimator and its 1-sigma bootstrap error (Beers, Flynn, & Gebhardt, 1990), and , the Gaussian estimator and its 1-sigma Student’s error. We note that the bootstrap error estimates are typically 25% to 40% higher than those estimated using the Student’s distribution, which assumes an underlying Gaussian population (Danese, de Zotti, & di Tullio, 1980). The estimates for clusters A and D are lower than those measured by P01, who used a factor of fewer galaxies. Comparison of our redshift histogram with their Figure 3 shows that P01 included members of the distinct structures B and C when measuring the dispersions for A and D, respectively. Such discrepancies highlight the fact that velocity dispersions of clusters (and their error estimates) based on small () redshift samples are subject to strong systematics and should be regarded with skepticism, especially in the presence of larger scale structures.
3.2. Separations
One goal of this study is to determine whether or not these clusters are components of a larger system (a supercluster) or a chance projection on the sky. We estimate the cluster centers (listed in Table 1) by starting with the position of the peak in red galaxy density for each cluster (see Figure 1). We then calculate the median position of all spectroscopically confirmed members within a radius of Mpc. Under the assumption that these cluster are no longer expanding with the Hubble flow, we measure separations, based on these cluster centers, using the angular diameter distance. The largest transverse separation is Mpc (cluster pair AD), with the closest pair separated by only Mpc (BC) in projection. The elongation in redshift space implies much greater radial distances, ranging from 18.1 (CD) to 93.0 (BC) Mpc.
If we take the largest radial separation as the maximum extent of the supercluster, its size is not unusual for local superclusters (Bahcall, 1988) and is consistent with the cluster-cluster correlation function, which exhibits power on scales as large as Mpc (Bahcall & Soneira, 1983; Postman, Huchra, & Geller, 1992; Bahcall et al., 2003). The large aspect ratio suggests that we are observing a filamentary structure nearly face-on, with the redshift differences too large to be due solely to peculiar velocities. Such elongated structures, with typical scales of Mpc, and as large as Mpc, are seen in large scale structure simulations (Sathyaprakash, Sahni, & Shandarin, 1998; Evrard et al., 2002; Kolokotronis, Basilakos, & Plionis, 2002), large galaxy surveys, such as SDSS (Einasto et al., 2003) and APM (Einasto et al., 2002), as well as individual structures including the Ursa Major (Kopylova & Kopylov, 2001), Shapley (Quintana, Carrasco, & Reisenegger, 2000), Corona Borealis (Small et al., 1998), Aquarius (Caretta et al., 2002), and North Ecliptic Pole (Mullis et al., 2001) superclusters.
4. Discussion
We have obtained the largest spectroscopic sample to date for a supercluster at . The initial results suggest that the four component clusters are part of a single, filamentary structure, with the individual clusters being massive (Abell Richness class 0–2). As seen in Figure 3, we may not yet have reached the outer limits of this structure, and future wide-area imaging and additional spectroscopy will be required to measure its full extent. Already our dataset is comparable in size to studies of local superclusters (see §3.2). This structure is by far the best studied of the very few known superclusters at (Connolly et al., 1996; Rosati et al., 1999; Gavazzi et al., 2004).
The spectroscopic data, especially from DEIMOS, are of sufficient resolution and quality to measure equivalent widths for both emission and absorption features. A large fraction of the galaxies in the cluster show evidence for star-formation (most notably strong [OII] emission). Examining the correlation of such features with galaxy location will yield insights into the dynamics and history of the supercluster system and shed light on the role of cluster-scale physical processes (e.g., shocks and ram-pressure stripping) in galaxy star formation. Proposed HST imaging and Chandra X-ray mapping of this structure will allow us to compare galaxy morphological and spectroscopic properties and correlate optical substructure with the location and temperature of the hot gas component. These data, combined with numerical simulations, may be able to predict future mergers and perhaps even the end-state of this system. This survey will provide a view of a young supercluster rivaling the detailed studies of local structures.
References
- Bahcall et al. (2003) Bahcall, N. A., Dong, F., Hao, L., Bode, P., Annis, J., Gunn, J. E., & Schneider, D. P. 2003, ApJ, 599, 814
- Bahcall (1988) Bahcall, N. A. 1988, ARA&A, 26, 631
- Bahcall & Soneira (1983) Bahcall, N. A. & Soneira, R. M. 1983, ApJ, 270, 20
- Beers, Flynn, & Gebhardt (1990) Beers, T. C., Flynn, K., & Gebhardt, K. 1990, AJ, 100, 32
- Caretta et al. (2002) Caretta, C. A., Maia, M. A. G., Kawasaki, W., & Willmer, C. N. A. 2002, AJ, 123, 1200
- Connolly et al. (1996) Connolly, A. J., Szalay, A. S., Koo, D., Romer, A. K., Holden, B., Nichol, R. C., & Miyaji, T. 1996, ApJ, 473, L67
- Danese, de Zotti, & di Tullio (1980) Danese, L., de Zotti, G., & di Tullio, G. 1980, A&A, 82, 322
- Davis et al. (2003) Davis, M. et al. 2003, Proc. SPIE, 4834, 161
- Einasto et al. (2003) Einasto, J., Hütsi, G., Einasto, M., Saar, E., Tucker, D. L., Müller, V., Heinämäki, P., & Allam, S. S. 2003, A&A, 405, 425
- Einasto et al. (2002) Einasto, M., Einasto, J., Tago, E., Andernach, H., Dalton, G. B., & Müller, V. 2002, AJ, 123, 51
- Evrard et al. (2002) Evrard, A. E. et al. 2002, ApJ, 573, 7
- Faber et al. (2003) Faber, S. M. et al. 2003, Proc. SPIE, 4841, 1657
- Gavazzi et al. (2004) Gavazzi, R., Mellier, Y, Fort. B., Cuillandre, J.-C. & Dantel-Fort, M. 2004, astro-ph/0401403
- Gunn, Hoessel, & Oke (1986) Gunn, J. E., Hoessel, J. G., & Oke, J. B. 1986, ApJ, 306, 30
- Kolokotronis, Basilakos, & Plionis (2002) Kolokotronis, V., Basilakos, S., & Plionis, M. 2002, MNRAS, 331, 1020
- Kopylova & Kopylov (2001) Kopylova, F. G. & Kopylov, A. I. 2001, Astronomy Letters, 27, 345
- Lubin et al. (2000) Lubin, L. M., Brunner, R., Metzger, M. R., Postman, M., & Oke, J. B. 2000, ApJ, 531, L5
- Mullis et al. (2001) Mullis, C. R., Henry, J. P., Gioia, I. M., Böhringer, H., Briel, U. G., Voges, W., & Huchra, J. P. 2001, ApJ, 553, L115
- Oke, Postman, & Lubin (1998) Oke, J. B., Postman, M., & Lubin, L. M. 1998, AJ, 116, 549
- Oke et al. (1995) Oke, J. B. et al. 1995, PASP, 107, 375
- Postman, Lubin, & Oke (2001) Postman, M., Lubin, L. M., & Oke, J. B. 2001, AJ, 122, 1125
- Postman, Lubin, & Oke (1998) Postman, M., Lubin, L. M., & Oke, J. B. 1998, AJ, 116, 560
- Postman, Huchra, & Geller (1992) Postman, M., Huchra, J. P., & Geller, M. J. 1992, ApJ, 384, 404
- Quintana, Carrasco, & Reisenegger (2000) Quintana, H., Carrasco, E., & Reisenegger, A. 2000, AJ, 120, 511
- Rosati et al. (1999) Rosati, P., Stanford, S. A., Eisenhardt, P. R., Elston, R., Spinrad, H., Stern, D., & Dey, A. 1999, AJ, 118, 76
- Sathyaprakash, Sahni, & Shandarin (1998) Sathyaprakash, B., Sahni, V., & Shandarin, S. 1998, ApJ, 508, 551
- Small et al. (1998) Small, T. A., Ma, C., Sargent, W. L. W., & Hamilton, D. 1998, ApJ, 492, 45