email: olivier.lefevre@oamp.fr 22institutetext: Istituto di Radio-Astronomia - CNR, Bologna, Italy 33institutetext: IASF - INAF, Milano, Italy 44institutetext: Laboratoire d’Astrophysique - Observatoire Midi-Pyrénées, Toulouse, France 55institutetext: Max Planck Institut fur Astrophysik, 85741 Garching, Germany 66institutetext: Osservatorio Astronomico di Brera, via Brera, Milan, Italy 77institutetext: Osservatorio Astronomico di Capodimonte, via Moiariello 16, 80131 Napoli, Italy 88institutetext: Institut d’Astrophysique de Paris, UMR 7095, 98 bis Bvd Arago, 75014 Paris, France 99institutetext: Observatoire de Paris, LERMA, UMR 8112, 61 Av. de l’Observatoire, 75014 Paris, France 1010institutetext: Osservatorio Astronomico di Bologna, via Ranzani 1, 40127 Bologna, Italy 1111institutetext: Università di Bologna, Departimento di Astronomia, via Ranzani 1, 40127 Bologna, Italy
The VIMOS VLT Deep Survey
This paper presents the VIMOS VLT Deep Survey around the Chandra Deep Field South (CDFS). We have measured 1599 new redshifts with VIMOS on the European Observatory Very Large Telescope - UT3, in an area arcmin2, including 784 redshifts in the Hubble Space Telescope - Advanced Camera for Surveys GOODS area. 30% of all objects with have been observed independently of magnitude, indicating that the sample is purely magnitude limited. We have reached an unprecedented completeness level of 88% in terms of the ratio of secure measurements vs. observed objects, while 95% of all objects have a redshift measurement. A total of 1452 galaxies, 139 stars, 8 QSOs have a redshift identification, 141 of these being unsecure measurements. The redshift distribution down to is peaked at a median redshift z=0.73, with a significant high redshift tail extending up to . Several high density peaks in the distribution of galaxies are identified. In particular, the strong peak at z=0.735 contains more than 130 galaxies in a velocity range km/s distributed all across the transverse 20 Mpc of the survey. We are releasing all redshifts to the community, along with the cross identification with HST-ACS GOODS sources on the CENCOS database environment http://cencosw.oamp.fr.
Key Words.:
Cosmology: observations – Cosmology: deep redshift surveys – Galaxies: evolution – – Cosmology: large scale structure of universe1 Introduction
Understanding the major steps in the evolution of galaxies still remains a major challenge to modern astrophysics. While the general theoretical framework of the hierarchical growth of structures in the universe including the build up of galaxies is well in place (e.g. Peacock et al., (2004)), at high redshifts this picture remains largely unconstrained by observations. The detailed properties of the main population of galaxies from large samples representative of the universe at various epochs remain to be established across most of the life of the universe beyond the large local volumes explored by the 2dFGRS (Colless et al., (2001) and the SDSS (Schneider, et al., (2003)), and expanding from smaller exploratory surveys (Lilly et al., (1995), Le Fèvre et al., (1995), Steidel et al., (2003), Cimatti, et al., (2002)).
The VIMOS VLT Deep Survey (VVDS) is a deep redshift survey aimed at studying the evolution of galaxies, large scale structures and AGNs over more than 90% of the current age of the universe. The unique feature of the VVDS is the simple magnitude selection applied to define a complete magnitude limited sample of distant galaxies, with a goal of more than 100000 objects observed in multi-object spectroscopy. The VVDS rests on the observations of 5 different fields to smooth out the effects of cosmic variance when building the statistical properties of the galaxy population (Le Fèvre et al., (2004)).
This paper presents the redshift survey observations of 1599 objects with conducted by the VVDS team around the Chandra Deep Field South, including the HST-GOODS area (Giavalisco et al., (2004)). The observations have been carried out with the VIsible Multi-Object Spectrograph (VIMOS) on the 8.2m Melipal telescope of the European Southern Observatory Very Large Telescope. We are describing the processing steps and redshift measurements, and the associated quality control we have applied to these data. The content of the final catalog is detailed, as well as the cross identification with the Hubble Space Telescope Advanced Camera for Surveys GOODS images, and we present the main entries available from our interactive database. The main properties of the sample are briefly presented, including the redshift distribution of the sample.
2 Observations
2.1 Multi-Object Spectroscopy with VIMOS
Spectroscopic observations have been conducted with VIMOS on the VLT-UT3 Melipal (Le Fèvre et al., (2003)). The low resolution red grism LRRED has been used with slits of 1 arcsec width. The spectral resolution in this mode is 34Åat 7500Åor . The spectral length has been limited by the red bandpass filter to Å. Slits placed on objects have a typical length arcsec each.
2.2 VIMOS pointings
A complete VIMOS pointing is a combination of observations with the 4 quadrants of the instrument, each separated by a cross about 2 arcminutes wide. With the above setup and the projected sky density of objects down to , one VIMOS pointing allows to observe targets in one single observation (Le Fèvre et al., (2003)).
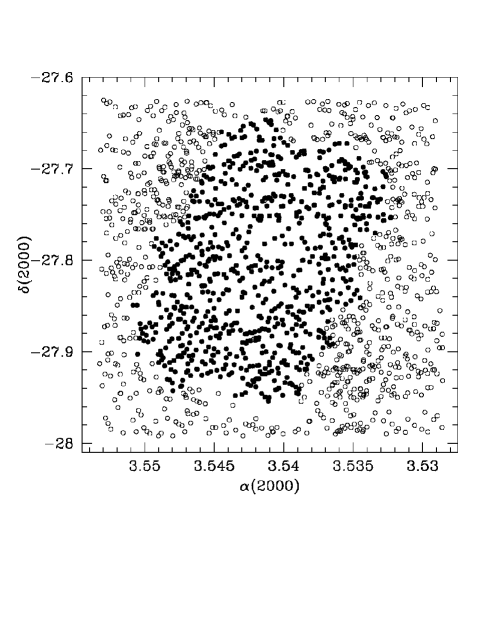
We have set a total of 5 pointings around the Chandra Deep Field South, the positions are listed in Table 1. Together, they cover a total area of including the complete HST-GOODS survey field (Giavalisco et al., (2004)). The layout of observed galaxies is presented in Figure 1.
-
a
Quadrant 2 not observed
2.3 Mask preparation
The preparation of slit masks for VIMOS observations has been done using the photometric catalog produced by the ESO Imaging Survey (EIS, Arnouts et al., (2001)), and short images taken with VIMOS. The VIMOS images are used to produce a catalog of source positions in the VIMOS instrument coordinate system, which are then cross-correlated with the EIS catalog to compute the transformation matrix from the EIS catalog astrometric system to the VIMOS focal plane where slit masks are located. The VMMPS code was then run on the EIS catalog for all sources brighter than to optimize the number and positions of slits for each of the 4 masks per pointing. Masks have been cut by ESO Paranal Staff using the Mask Manufacturing Unit (Conti et al., (2001)).
2.4 VIMOS observations
Observations with VIMOS have been obtained between October 31 and December 6, 2002. Observing conditions were photometric with an image quality between 0.6 and 1.2 arcsec FWHM. We have moved the telescope, hence the objects along the slits, in a sequence of 5 positions with offsets -0.7, -0.3, 0, +0.3, +0.7 arcsec from the reference pointing position. This is necessary to compute the fringing pattern produced above 8300Å by the thinned EEV CCDs used in VIMOS, and remove it during processing.
Wavelength calibrations have been obtained during the day, observing Helium and Argon arc lamps through the observed masks. The spectrophotometric standard star LTT3218 has been used to derive the absolute flux calibration.
3 Data Processing
Data processing has been conducted under the VIPGI environment developed by our team (Franzetti, et al., (2004)). VIPGI has been used to organize the multiple files and process all data from the raw 2D images and calibration to the production of sky subtracted, wavelength and flux calibrated 1D spectra. Because of instrument flexures not yet minimized at the time of these observations, the fringing pattern has been occasionally hard to remove. The quality control performed on these steps is described in Le Fèvre et al., (2004). The wavelength accuracy is better than Å rms all over the wavelength range, and the spectrophotometry is accurate to about 10%.
4 Redshift Measurements
Measuring redshifts for a complete magnitude limited sample down to had never been attempted before our observations. The challenge is to measure redshifts within a possible range , without any a priori indication to preserve the complete magnitude selected sample approach. The approach we have followed involves an iterative build up of galaxy templates as observed with VIMOS, coupled to the powerful redshift measuring machine KBRED (Scaramella et al., (2004)), based on cross correlation and principal component analysis methods. This approach has been applied and tuned on the more than 20000 spectra obtained for the VVDS in the fall of 2002, and remained until recently very manpower intensive. On this critical step, we have enforced a very strict quality control.
Each spectrum has been measured independently by 2 VVDS team members, and then compared. A final check has been done by a third team member prior to release into the database. Each spectrum is assigned a redshift, and a flag indicating the reliability level of the measurement, as defined in Le Fèvre et al., (1995) and described in Section 6. Flags 2,3,4 are the most secure, flag 1 is an indicative measurement based on continuum and few supporting features, and flag 0 indicates a measurement failure with no features identified. Flag 9 indicates that there is only one secure emission line tentatively assigned to the listed redshift (e.g. [OII]3727Å or H).
4.1 Redshift accuracy
The redshift accuracy can be estimated from a sample of 160 galaxies which have been observed twice with VIMOS within the 5 CDFS pointings. These galaxies have been included in two or more different mask sets, and observed independently at different times. The distribution of measured redshift differences is presented in Figure 2. The redshift dispersion of the distribution is , or 360km/s.
We have compared our redshift measurements with the measurements of the K20 survey (Cimatti, et al., (2002)) and VLT-FORS2 measurements conducted by the ESO-GOODS team (www.eso.org/science/goods). A total of 70 objects have been observed both by the VVDS and the K20. For the 63 VVDS objects with flags , the redshifts agree for % of the sample with a and , with the main disagreement concentrated on flag 1, as expected. The comparison with the FORS2 data yields 46 objects in common, of which 42 have a VVDS flag . The VVDS vs. FORS2 redshift agree for 66% of the sample with and . The detailed comparison of VVDS redshift measurements with the measurements from these other teams will be presented in Le Fèvre et al., (2004).

4.2 Completeness
We have defined the completeness of the measurements as the ratio between the actual redshifts measurements and the observed spectra. We have removed from the list of observed spectra those which have a clearly identified instrumental or data processing problem affecting the measurement, like e.g. the slit is behind the guide probe of the VLT-UT3, or the data processing with VIPGI failed to properly detect the object because of strong residual features from the sky / fringing corrections. This will be described in details in Le Fèvre et al., (2004).
We are presenting in Figure 3 the completeness vs. magnitude of all objects (galaxies, stars, QSOs) with flags 2,3,4,9 and 12,13,14,19 (the most secure) and the completeness level adding the flags 1 and 11 to the above.
The overall redshift measurement completeness reaches 88% excluding flags 0 and 1; it reaches 95% including objects with flags 1 and excluding objects with flags 0.

5 Cross identification with HST-ACS GOODS sources
The cross identification of the objects observed from the EIS catalog and the objects detected by HST-ACS has been performed running a cross correlation of our target list with the list of objects published in the version r1.0, December 22 2003, of the GOODS survey multi-band catalog. The relative astrometry of the EIS vs. GOODS catalogs has been found to be extremely good, to within 0.1 arcsecond over our survey field. A search circle with radius 0.3 arcsecond has been used to search for HST sources corresponding to the ground based sources. This produced a matched list with only one to one identifications, and no double identifications.
6 Basic properties of the sample
6.1 Magnitude distribution
The magnitude distribution of objects observed in our survey is shown in Figure 4 compared to the distribution of all objects in the EIS photometric catalog over the same area. We have observed 30% of all objects with in the area covered by the survey, independently of magnitude, as shown in Figure 4. This demonstrates that there is no magnitude - dependent bias in our object selection and that our sample is purely magnitude selected even after the complex target selection in the making of the VIMOS multi-slit masks.

6.2 Redshift Distribution
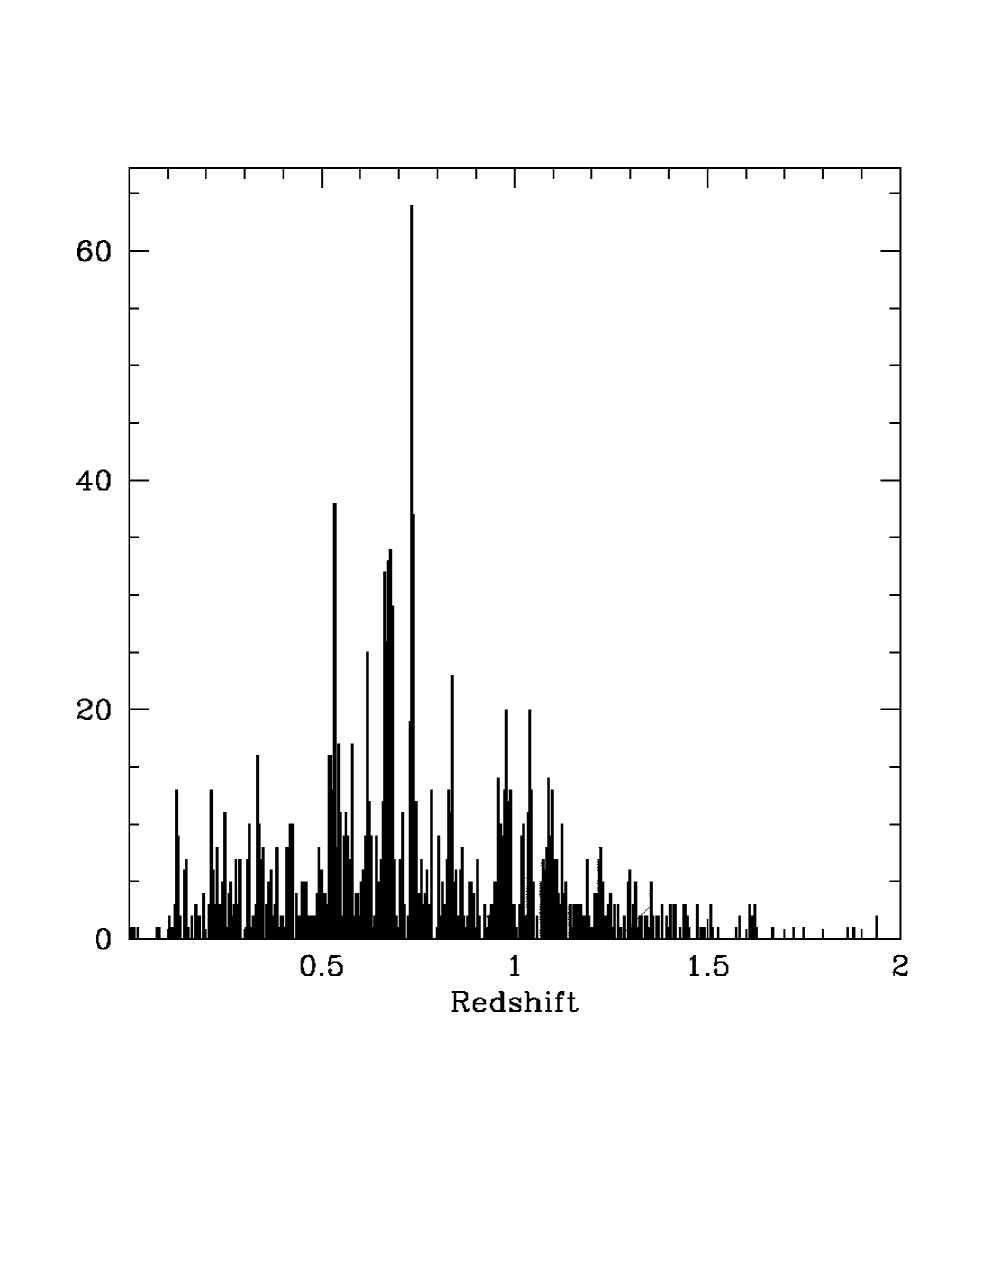
The redshift distribution of the full sample of galaxies and QSOs is presented in Figure 5. The median of the redshift distribution is . Galaxies are identified up to . As described in Le Fèvre et al., (2004) and Paltani et al., (2004), we have been successful in breaking into the “redshift desert” artificially produced by the difficulty to identify redshifts in the range due to our instrumental set-up, through extensive work on galaxy templates based on the high redshift galaxies measured in the VVDS (Paltani et al., (2004)). We extensively discuss the incompleteness of the VVDS sample vs. redshift in Le Fèvre et al., (2004).
The strongest peaks in the distribution are at redshifts , and . A total of 149 galaxies are measured in the peak and 116 galaxies peak. These structures are extending all across transverse Mpc of this survey ( CDM with , , ) in a wall-like pattern rather than in clusters.
6.3 Absolute Magnitude and B-I distributions vs. redshift
The absolute magnitude vs. redshift distribution is presented in Figure 6. The absolute magnitudes have been computed based on k(z) corrections derived from the fitting of the broad band photometry using rest frame galaxy templates (see Ilbert et al., (2004)). The vs. redshift distribution is presented in Figure 7


7 The CDFS catalog
Our catalog contains
1599 spectra including 1452 galaxies, 139 stars, and 8 QSOs,
with 141 of these having an uncertain
redshift identification.
We have listed for each observed object:
– the ESO Imaging Survey identification number,
equatorial coordinates , ,
magnitudes and associated errors (Arnouts et al., (2001))
– the HST-GOODS identification number and
BVIz magnitudes and associated errors (Giavalisco et al., (2004))
– the redshift measured by the VVDS team
– the redshift quality flag (see Le Fèvre et al., (2004)
for a detailed description).
The flags definition from the
Canada France Redshift Survey (Le Fèvre et al., (1995))
is as follows:
0: no redshift could be measured
1: some spectral features like e.g. weak line(s)
or continuum break give
a possible indication of the redshift (more than %
confidence in the measurement)
2: a few secure features are identified in support
of the redshift measurement (more than %
confidence in the measurement)
3: many secure features
are identified (more than %
confidence in the measurement)
4: strong secure features with
high S/N are identified (100% confidence in
the measurement)
8 Public data release
We are publicly releasing all redshift measurements through the CENCOS (CENtre de COSmologie) database environment on our web site http://cencosw.oamp.fr with access to the database built under the Oracle environment. The catalog can be searched by coordinates, redshift interval, identification number in the EIS or GOODS catalogs, in combination with the spectra quality flags. Upon query, the database engine returns a list of targets, each of them can be examined in one single summary panel with all the VVDS spectroscopy information including the spectra, as well as the EIS and B,V,I,z HST-GOODS images, and associated photometry as shown in Figure 8.
9 Summary
In the framework of the VIMOS VLT Deep Survey (VVDS), we have observed a large sample of galaxies around the Chandra Deep Field South, and are releasing the redshift data to the community. A total of 1599 objects with have a measured redshift. The completeness in redshift measurement for the targeted objects is high, above 88%. We find that the redshift distribution has a median of , with strong high density peaks observed across the field.
The combination of this redshift survey and the HST-ACS GOODS survey enables detailed studies of the evolution of galaxies in the Chandra Deep Field South.
Acknowledgements.
We are grateful to A. Cimatti and the K20 team for releasing their redshift measurements to us for comparison. The VLT-VIMOS observations have been carried out on garanteed observing time (GTO) allocated by the European Southern Observatory as a compensation for the manpower invested by the VIRMOS consortium in the design, manufacturing and testing of VIMOS under a contractual agreement between the Centre National de la Recherche Scientifique of France, and the European Southern Observatory.References
- Arnouts et al., (2001) Arnouts, S.; Vandame, B.; Benoist, C.; Groenewegen, M. A. T.; da Costa, L.; Schirmer, M.; Mignani, R. P.; Slijkhuis, R.; Hatziminaoglou, E.; Hook, R., 2001, A&A, 379, 740
- Cimatti, et al., (2002) Cimatti, A., Daddi, E., Mignoli, M., Pozzetti, L., Renzini, A., Zamorani, G., et al., 2002, A&A, 381, L68
- Colless et al., (2001) Colless, M.M., et al., 2001, MNRAS, 328, 1039
- Conti et al., (2001) Conti, G., Mattaini, E., Maccagni, D., Sant’Ambrogio, E., Bottini, D., Garilli, B., Le Fèvre, O., Saïsse, M., Voët, C., et al., 2001, PASP, 113, 452.
- Franzetti, et al., (2004) Franzetti, P., Scoddegio, M., and the VVDS team, 2004, A&A, in preparation
- Giavalisco et al., (2004) Giavalisco, M., the GOODS team, 2004, Ap.J., 600, L93.
- Ilbert et al., (2004) Ilbert, O., and the VVDS team, A&A, in preparation
- Le Fèvre et al., (1995) Le Fèvre, O., Crampton, D., Lilly, S.J., Hammer, F., Tresse, L., 1995, Ap.J., 455, 60
- Le Fèvre et al., (2003) Le Fèvre, O., and the VVDS team, 2003, The Messenger 111, 18.
- Le Fèvre et al., (2004) Le Fèvre, O., and the VVDS team, 2004, in preparation.
- Lilly et al., (1995) Lilly, S.J., Le Fèvre, O., Crampton, D., Hammer, F., Tresse, L., 1995, Ap.J., 455, 50
- Paltani et al., (2004) Paltani, S., and the VVDS team, 2004, in preparation
- Peacock et al., (2004) Peacock, J., 2002 Tenerife Winter School, ”Dark matter and dark energy in the universe”, astro-ph/0309240
- Scaramella et al., (2004) Scaramella, R., and the VVDS team, 2004, in preparation.
- Steidel et al., (2003) Steidel, C.C., Adelberger, K.L., Shapley, A.E., Pettini, M., Dickinson, M., Giavalisco, M., 2003, Ap.J., 592, 728
- Schneider, et al., (2003) Schneider, D.P., et al., 2003, AJ 126:2579