Modeling the Multiwavelength Spectra and Variability of BL Lacertae in 2000
Abstract
BL Lacertae was the target of an extensive multiwavelength monitoring campaign in the second half of 2000. The campaign had revealed optical and X-ray intraday variability on time scales of hours and evidence for significant spectral variability both at optical and X-ray frequencies. During the campaign, BL Lacertae was observed in two different activity states: A quiescent state with relatively low levels of optical and X-ray fluxes and a synchrotron cutoff at energies below the X-ray regime, and a flaring state with high levels of optical and X-ray emission and a synchrotron cutoff around or even beyond keV. In this paper, we are using both leptonic and hadronic jet models to fit the broadband spectra and spectral variability patterns observed in both activity states in 2000. We start out with global spectral models of both activity states. Subsequently, we investigate various flaring scenarios for comparison with the observed short-term variability of BL Lacertae in 2000. For our leptonic jet model, we find that the short-term variability, in particular the optical and X-ray spectral variability, can be best represented with a flaring scenario dominated by a spectral-index change of the spectrum of ultrarelativistic electrons injected into the jet. Based on this result, a detailed model simulation of such a flaring scenario, reproducing the observed optical and X-ray spectral variability and broadband SED of BL Lacertae during the BeppoSAX pointing around Nov. 1, 2000, simultaneously, is presented. Our leptonic modeling results are compared to fits using the hadronic synchrotron-proton blazar (SPB) model. That model can reproduce the observed SEDs of BL Lacertae in a scenario with -synchrotron dominated high-energy emission. It requires a significantly higher magnetic field than the leptonic model ( G vs. G in the leptonic model) and a lower Doppler factor associated with the bulk motion of the emission region ( vs. in the leptonic model). The hadronic model predicts a significantly larger GeV flux than the leptonic models, well within the anticipated capabilities of VERITAS and MAGIC.
1 Introduction
BL Lacertae (= 1ES 2200+420; z = 0.069) was historically the prototype of the BL Lac class of active galactic nuclei (AGN). These objects are characterized by continuum properties similar to those of flat-spectrum radio quasars (non-thermal optical continuum, high degree of linear polarization, rapid variability at all wavelengths, radio jets with individual components often exhibiting apparent superluminal motion), but do usually show only weak emission lines (with equivalent width in the rest-frame of the host galaxy of Å), if any. In BL Lacertae itself, however, H (and H) emission lines with equivalent widths in excess of 5 Å have been detected during a period of several weeks in 1995 (Vermeulen et al.,, 1995; Corbett et al.,, 1996), and in 1997 (Corbett et al.,, 2000). Superluminal motion of up to has been observed in this object (Denn et al.,, 2000).
BL Lacertae is classified as a low-frequency peaked BL Lac object (LBL; Fossati et al.,, 1998). From an interpolation between the GHz radio spectrum and the IR – optical spectrum, it can be inferred that its low-frequency spectral component typically peaks at mm to m wavelengths, while the high-frequency component seems to peak in the multi-MeV – GeV energy range. BL Lacertae has been studied in detail during various intensive multiwavelength campaigns (e.g. Bloom et al.,, 1997; Sambruna et al.,, 1999; Madejski et al.,, 1999; Ravasio et al.,, 2002; Villata et al.,, 2002; Böttcher et al.,, 2003). It is a particularly interesting object for detailed X-ray studies since it is in the X-ray regime where the two broad components of the multiwavelength SEDs of BL Lacertae (and other LBLs) are overlapping and intersecting. X-ray observations of this source at different epochs show significant flux and spectral variability, indicating that the X-ray emission is at times dominated by the high-energy end of the synchrotron emission, while at other occasions it is dominated by the low-frequency portion of the high-energy bump of the SED. In fact, BL Lacertae has repeatedly shown a concave shape (e.g., Madejski et al.,, 1999; Ravasio et al.,, 2002), with rapid variability mainly restricted to the low-energy excess portion of the spectrum (e.g., Ravasio et al.,, 2002, 2003).
In the framework of relativistic jet models, the low-frequency (radio – optical/UV) emission from blazars is interpreted as synchrotron emission from nonthermal electrons in a relativistic jet. The high-frequency (X-ray – -ray) emission could either be produced via Compton upscattering of low frequency radiation by the same electrons responsible for the synchrotron emission (leptonic jet models; for a recent review see, e.g., Böttcher,, 2002), or due to hadronic processes initiated by relativistic protons co-accelerated with the electrons (hadronic models, for a recent discussion see, e.g., Mücke & Protheroe,, 2001; Mücke et al.,, 2003). The lack of knowledge of the primary jet launching mechanism and the difficulty in constraining the jet composition from general energetics considerations (for recent discussions see, e.g., Sikora & Madejski,, 2000; Ghisellini & Celotti,, 2001) are currently leaving both leptonic and hadronic models open as viable possibilities. Also, detailed simulations of particle acceleration at relativistic shocks or shear layers, which may be relevant for the acceleration of ultrarelativistic particles in blazar jets, show that a wide variety of particle injection spectra may result in such scenarios (e.g., Ostrowski & Bednarz,, 2002; Stawarz & Ostrowski,, 2003), greatly differing from the standard spectral index of 2.2 – 2.3, which was previously believed to be a universal value in relativistic shock acceleration scenarios (e.g., Achterberg et al.,, 2001; Gallant et al.,, 1999). Thus, both the nature of the matter in blazar jets and the energy spectra of ultrarelativistic particles injected into the emission regions in blazar jets are difficult to constrain from first principles. For this reason, we are leaving these aspects as virtually free parameters in our models, and attempt to constrain them through the results of detailed time-dependent modeling of blazar emission.
While simultaneous broadband spectra are very useful to constrain both types of blazar jet models, there still remain severe ambiguities in their interpretation w.r.t. the dominant electron cooling, injection, and acceleration mechanisms, as was recently illustrated for the case of W Comae by Böttcher et al., (2002). Those authors have also demonstrated that a combination of broadband spectra with timing and spectral variability information, in tandem with time-dependent model simulations (Kirk et al.,, 1998; Georganopoulos & Marscher,, 1998; Kataoka et al.,, 2000; Kusunose et al.,, 2000; Li & Kusunose,, 2000; Sikora et al.,, 2001; Böttcher & Chiang,, 2002; Krawczynski et al.,, 2002; Kusunose et al.,, 2003) can help to break some of these degeneracies. For this reason, we had organized an intensive multiwavelength campaign to monitor BL Lacertae in the second half of 2000 at radio, optical, X-ray, and very-high-energy (VHE) -ray frequencies, putting special emphasis on detailed variability information. The results of this multiwavelength campaign were published in Böttcher et al., (2003); for more details on the optical and X-ray observations, see also Villata et al., (2002) and Ravasio et al., (2003), respectively. In §2, we briefly highlight the main results of that campaign, emphasizing those aspects that we will specifically use here to constrain our model calculations.
The purpose of this paper is to use both leptonic and hadronic jet models to fit the spectral energy distributions (SEDs) and spectral variability of BL Lacertae observed in 2000. Following a brief description of both leptonic and hadronic models in §3, we will first present spectral fits to the SEDs of BL Lac in §4. Our code used to evaluate leptonic models allows us to make detailed simulations of the spectral variability resulting from different plausible flaring scenarios. In §5, we will first do a general parameter study of various scenarios and compare the results qualitatively with the observed spectral variability trends in BL Lacertae (§5.1). This will allow us to decide on a preferable flaring scenario, for which we subsequently optimize our choice of model parameters to fit simultaneously the SED and spectral variability of BL Lacertae as observed in 2000 (§5.2). Possible physical scenarios triggering the inferred variability of the electron injection spectrum will be discussed in §6. We summarize in §7.
Throughout this paper, we refer to as the energy spectral index, [Jy] . A cosmology with and and km s-1 Mpc-1 is used.
2 Summary of observational results
BL Lacertae was observed in a co-ordinated multiwavelength campaign at radio, optical, X-ray, and VHE -ray energies during the period mid-May 2000, until the end of the year. Results of the multiwavelength observing campaign have been published in Böttcher et al., (2003). Here, we briefly highlight the results that we will specifically concentrate on in our modelling effort.
Focusing on an originally planned core campaign period of July 17 – Aug. 11, BL Lacertae was the target of an intensive optical campaign by the Whole Earth Blazar Telescope (WEBT; Villata et al.,, 2000; Raiteri et al.,, 2001, see also http://www.to.astro.it/blazars/webt/), in which 24 optical telescopes throughout the northern hemisphere participated. Details of the data collection, analysis, cross-calibration of photometry from different observatories, etc. pertaining to the WEBT campaign have been published in Villata et al., (2002). BL Lacertae was in a rather quiescent state during the core campaign, in which the densest light curve sampling was obtained. However, the source underwent a state transition to an extended high state in mid-September 2000, which lasted throughout the rest of the year.
The WEBT campaign returned optical (R-band) light curves of unprecedented time coverage and resolution. Brightness variations of , corresponding to flux variations of , within hr have been found. Clear evidence for spectral variability at optical wavelengths was found, and the color changes were more sensitive to rapid variations than the long-term flux level. During well-sampled, short flares (on time scales of a few hours), the color changes strictly follow the flux variability in the sense that the spectra are harder when the flux is higher. A plot of B - R vs. R (see Fig. 1) reveals two separate regimes within which the R magnitudes are well correlated with the respective B - R colors. However, there seems to be a discontinuity at mag, separating a high-flux and a low-flux regime. Within each regime, a similar range of B - R colors is observed (Villata et al.,, 2002).
At X-ray energies, BL Lacertae was observed with the BeppoSAX Narrow Field Instruments (NFI) in two pointings on July 26 – 27 and Oct. 31 – Nov. 2, 2000 (Ravasio et al.,, 2003). In addition, the source was monitored by the Rossi X-ray Timing Explorer (RXTE) Proportional Counter Array (PCA) in 3 short pointings per week (Marscher et al.,, 2004). The details of the BeppoSAX observations and the data analysis methods have been published in Ravasio et al., (2003).
The drastic change of the activity state of BL Lacertae in mid-September observed in the optical range is accompanied by several large flares in the PCA light curve over a months period, but not by a similarly extended high flux state as seen in the optical. In fact, while the average flux level increased only slightly, a higher level of activity was indicated by a higher degree of variability.
During our second BeppoSAX pointing around Nov. 1, 2000, BL Lacertae was in an exceptionally bright X-ray outburst state. Interestingly, the R-band lightcurve indicates a relatively low optical flux, compared to the average flux level after mid-September 2000, coincident with this X-ray outburst.
In the following, we will concentrate on the data analysis results obtained using a neutral hydrogen column density of cm-2 and an optical extinction coefficient of . During the July 26 – 27 BeppoSAX observation, the source was in a low flux and activity state. The fit to the BeppoSAX spectrum resulted in , confirming the low-activity state of the source at that time and indicating that the entire X-ray spectrum might have been dominated by the low-frequency end of the high-energy component of the broadband SED of BL Lacertae.
The short-term LECS ([0.5 – 2] keV) and MECS ([2 – 10] keV) lightcurves of BL Lacertae during this observation (see Fig. 3 of Ravasio et al.,, 2003) display a large (factor ) flare on a time scale of hr, while the source appears less variable at higher energies. This behavior has been noted in this source before (e.g., Ravasio et al.,, 2002), and is even more obvious in the Oct 31 – Nov. 2 observation.
During the second BeppoSAX pointing on Oct. 31 – Nov. 2, 2000, the LECS + MECS 0.3 – 10 keV spectrum was well fitted with a power-law model with (Ravasio et al.,, 2003). In this observation, BL Lacertae was also significantly detected by the PDS up to keV, indicating a spectral hardening in this energy range. The soft shape of the LECS + MECS spectrum clearly indicates that it was dominated by the high-energy end of the low-energy (synchrotron) component in this observation. The spectral hardening evident in the PDS spectrum might indicate the onset of the high-energy component beyond keV.
Ravasio et al., (2003) extracted the LECS and MECS light curves in three different energy channels during the second BeppoSAX pointing, along with the two hardness ratios: HR1 = MECS [2 - 4] / LECS [0.5 - 2] and HR2 = MECS [4 - 10] / MECS [2 - 4]. The LECS and MECS light curves show significant variability in all energy channels, with flux variations of factors of – 4 on time scales down to – 2 hr.
The X-ray spectral variability on short (intra-day) time scales can be characterized through variations of the BeppoSAX hardness ratios HR1 and HR2 as a function of the respective count rates. An example of such a hardness-intensity diagram (HID) is shown in Fig. 12. A weak hardness-intensity anti-correlation at soft X-rays (HR1 vs. LECS) is generally found. Occasionally, a positive hardness-intensity correlation at medium-energy X-rays (HR2 vs. MECS) can be found, but is not always apparent.
Generally, no significant cross-correlations with measurable time delays between different energy bands could be identified in this campaign. A possible correlation between the X-ray and optical light curves with an optical delay of 4 – 5 hr during the July 26 – 27 BeppoSAX observation did not hold up to any statistical significance test (for more details, see Böttcher et al.,, 2003). However, if we assume that the optical lag of – 5 hr is real and can be interpreted as due to synchrotron cooling, it allows an independent magnetic field estimate, which is in good agreement with the independent estimate based on the measured synchrotron peak flux and a basic equipartition argument (see §3.3).
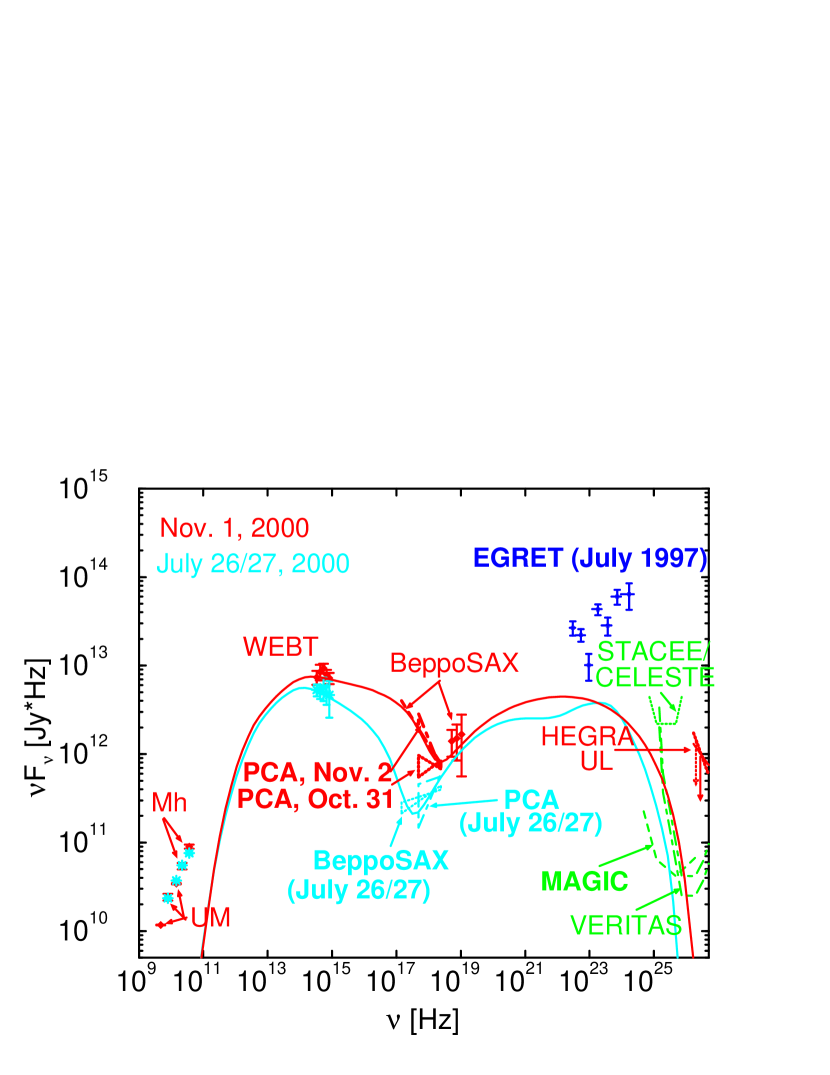
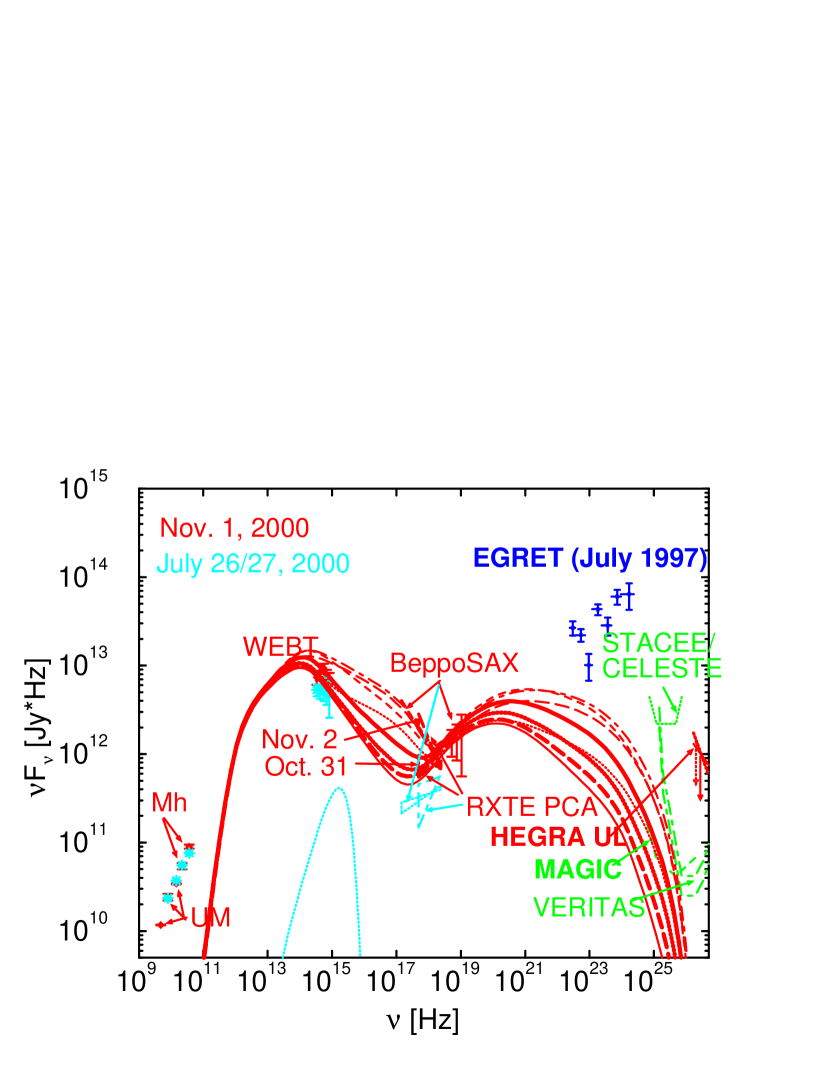
Böttcher et al., (2003) constructed two simultaneous broadband SEDs for the times of the two BeppoSAX pointings (see Fig. 2). Fig. 2 illustrates the different activity states between the July 26/27 and the Oct. 31 – Nov. 2 BeppoSAX observations. In the July 26/27 SED, the synchrotron peak appears to be located at frequencies clearly below the optical range, and a synchrotron cutoff near or below the soft X-ray regime. In contrast, the SED of Oct. 31 – Nov. 2 shows clear evidence for the presence of the synchrotron component out to at least 10 keV, and the synchrotron peak might be located in the optical range. The figure also shows the RXTE PCA spectrum of the observation a few hours before the beginning of the Oct. 31 – Nov. 2 BeppoSAX pointing. This PCA spectrum shows characteristics rather similar to the low-state spectrum, and illustrates the drastic nature of the short-term X-ray variability.
Ravasio et al., (2003) have shown that the extrapolation of the optical spectrum towards higher frequencies does not connect smoothly with the contemporaneous soft X-ray spectrum (see their Fig. 5). In addition to the various scenarios discussed by Ravasio et al., (2003) to possibly explain this misalignment, it seems also possible that it could be an artifact of the flux averaging over the days of the BeppoSAX observations, including multiple short-term flares of only a few hours each. In order to test for this possibility, it will be essential to apply fully time-dependent AGN emission models, as we do in this paper, and fit time-dependent spectral variability patterns rather than only time-averaged SEDs.
3 Description of leptonic and hadronic models
In this section, we give a brief description of the leptonic and hadronic blazar jet models used for our spectral fitting and variability study (§3.1 and 3.2). Here, we also briefly review some general parameter estimates derived previously (Böttcher et al.,, 2003) which will be used as a starting point in our spectral modelling efforts (§3.3).
3.1 Leptonic model
The leptonic model adopted in this paper is a generic, fully time-dependent one-zone relativistic jet model. The details of the model as well as the numerical procedure adopted to solve the time-dependent electron continuity equation and the photon transport equations are given in Böttcher & Chiang, (2002). Here, we briefly highlight the salient features of this model.
A population of ultrarelativistic, non-thermal electrons (and positrons) is injected into a spherical emitting volume of co-moving radius (the “blob”) at a time-dependent rate. The injected pair population is specified through an injection power and the spectral characteristics of the injected non-thermal electron distribution. We assume that electrons are injected with a single power-law distribution with low and high energy cutoffs and , respectively, and a spectral index .
The jet is powered by accretion of material onto a supermassive central object, which is accompanied by the formation of an accretion disk with a bolometric luminosity . The randomly oriented magnetic field in the emission region is parameterized through an equipartition parameter , which is the fraction of the magnetic field energy density, , compared to its value for equipartition with the relativistic electron population in the emission region. The blob moves with relativistic speed along the jet which is directed at an angle (with ) with respect to the line of sight. The Doppler boosting of emission from the co-moving to the observer’s frame is determined by the Doppler factor .
As the emission region moves outward along the jet, particles are continuously injected, are cooling, primarily due to radiative losses, and may leak out of the system. We parametrize particle escape through an energy-independent escape time scale with . Radiation mechanisms included in our simulations are synchrotron emission, Compton upscattering of synchrotron photons (SSC = Synchrotron Self Compton scattering; Maraschi et al.,, 1992; Bloom & Marscher,, 1996), and Compton upscattering of external photons (EC = External Compton scattering), including photons coming directly from the disk (Dermer et al.,, 1992; Dermer & Schlickeiser,, 1993) as well as re-processed photons from the broad line region (Sikora et al.,, 1994; Blandford & Levinson,, 1995; Dermer et al.,, 1997). The broad line region is modelled as a spherical shell between and , and a radial Thomson depth . absorption and the corresponding pair production rates are taken into account self-consistently.
3.2 Hadronic model
While leptonic models deal with a relativistic e± plasma in the jet, in hadronic models the relativistic jet consists of a relativistic proton () and electron () component. Here we use the hadronic Synchrotron-Proton Blazar (SPB-) model of Mücke et al., (2003) to model the spectral energy distribution (SED) of BL Lacaerte in July and November 2000.
Like in the leptonic model, the emission region, or “blob”, in an AGN jet moves relativistically along the jet axis which is closely aligned with our line-of-sight. Relativistic (accelerated) protons, whose particle density follows a power law spectrum in the range , are injected instantaneously into a highly magnetized environment ( const. within the emission region), and are subject to energy losses due to proton-photon interactions (meson production and Bethe-Heitler pair production), synchrotron radiation and adiabatic expansion. The mesons produced in photonmeson interactions always decay in astrophysical environments. However, they may suffer synchrotron losses before the decay, which is taken into account in this model.
If the relativistic electrons are accelerated together with the protons at the same site, their injection spectrum shows most likely the same spectral shape with . In the following we shall assume this as a working hypothesis. The relativistic primary radiate synchrotron photons which constitute the low-energy bump in the blazar SED, and serve as the target radiation field for proton-photon interactions and the pair-synchrotron cascade which subsequently develops. The SPB-model is designed for objects with a negligible external target photon component, and hence suitable for BL Lac objects. The cascade redistributes the photon power to lower energies where the photons eventually escape from the emission region. The cascades can be initiated by photons from -decay (“ cascade”), electrons from the decay (“ cascade”), -synchrotron photons (“-synchrotron cascade”), charged -, - and -synchrotron photons (“-synchrotron cascade”) and from proton-photon Bethe-Heitler pair production (“Bethe-Heitler cascade”).
Because “ cascades” and “ cascades” generate rather featureless photon spectra (Mücke & Protheroe,, 2001; Mücke et al.,, 2003), proton and muon synchrotron radiation and their reprocessed radiation turn out to be mainly responsible for the high energy photon output in blazars. The contribution from the Bethe-Heitler cascades is mostly negligible. The low energy component is dominanted by synchrotron radiation from the primary , with a small contribution of synchrotron radiation from secondary electrons (produced by the - and -synchrotron cascade). A detailed description of the model itself, and its implementation as a (time-independent) Monte-Carlo code, has been given in Mücke & Protheroe, (2001) and Reimer et al., (2004).
3.3 General parameter estimates
Böttcher et al., (2003) have derived some model-independent parameter estimates based on the observational results of the BL-Lacertae multiwavelength campaign of 2000, which we will briefly summarize here. These estimates apply to both leptonic and hadronic models, unless specifically noted otherwise.
The co-moving magnetic field can be estimated by assuming that the dominant portion of the time-averaged synchrotron spectrum is emitted by a quasi-equilibrium power-law spectrum of electrons. From the observed properties of the synchrotron spectrum, Böttcher et al., (2003) have derived a magnetic-field estimate of
| (1) |
where and with the energy density of the relativistic electrons, and the magnetic field energy density. Typically in leptonic models while in hadronic models since ( is the energy density of the relativistic protons) and . From the modelling in the framework of the SPB model we find G (see Sect. 4.2) which is in good agreement with the magnetic field values required for this hadronic model.
Although the tentatively identified time delay between the BeppoSAX LECS [0.5 – 2] keV and the R-band light curves of – 5 hr was found not to be statistically significant, it is interesting to investigate which magnetic field could be derived if such a correlation was indeed real and the delay was caused by synchrotron cooling of high-energy electrons. This has been done in Böttcher et al., (2003), resulting in
| (2) |
where is the ratio of the external-photon-field energy density to the magnetic-field energy density in the co-moving frame. As pointed out by Böttcher et al., (2003), Eq. 2 may, in fact, slightly overestimate the actual magnetic field since at least the optical synchrotron emitting electrons may also be affected by adiabatic losses and escape. Depending on the details (geometry and mechanism) of the jet collimation, those processes can act on time scales as short as the dynamical time scale, which is constrained by the observed minimum variability time scale of hr (in the observer’s frame). Another note of caution that needs to be kept in mind is that the rather large sampling time scale of the X-ray light curve of hr, precludes the estimation of magnetic fields larger than G from delays between the optical and X-ray light curves.
It is remarkable that the two magnetic-field estimates are in good agreement if the Doppler factor is slightly larger than 10 and/or the parameter is only slightly less than 1. We thus conclude that a magnetic field of G might be a realistic value for BL Lacertae. This is also in good agreement with magnetic-field estimates for this source based on earlier observations (e.g., Madejski et al.,, 1999; Ravasio et al.,, 2002).
Based on the magnetic-field estimate of 1.5 – 2 G for leptonic models, the approximate location of the synchrotron peak of the SEDs of BL Lacertae at Hz allows us to estimate that the electron energy distribution in the synchrotron emitting region should peak at , also in reasonable agreement with earlier estimates for this source (Madejski et al.,, 1999; Ravasio et al.,, 2002). The location of the synchrotron cutoff in the quiescent state at Hz then yields a maximum electron energy in the quiescent state of , while the synchrotron cutoff in the flaring state at Hz yields . For hadronic models, the magnetic-field estimate is a factor of higher than in the leptonic case. Consequently, the estimates for the co-moving energies of the synchrotron-emitting electrons will be lower by a factor of .
The superluminal-motion measurements place a lower limit on the bulk Lorentz factor , and we expect that the Doppler boosting factor is of the same order. Since, unfortunately, we only have an upper limit on the VHE -ray flux during the campaign of 2000, and no measurements in the MeV — GeV regime, no independent estimate from opacity constraints can be derived. However, such an estimate was possible for the July 1997 -ray outburst and yielded (Böttcher & Bloom,, 2000), which is a much weaker constraint than derived from the superluminal motion observations.
From the optical and X-ray variability time scale, we find an upper limit on the source size of cm. If the electrons in the jet are efficiently emitting most of their co-moving kinetic energy before escaping the emission region (fast cooling regime), then the kinetic luminosity of the leptonic component of the jet would have to be ergs s-1. If the electrons are in the slow-cooling regime (i.e. they maintain a substantial fraction of their energy before escaping the emitting region) and/or the jet has a substantial baryon load (see, e.g., Sikora & Madejski,, 2000), the kinetic luminosity of the jet would have to be accordingly larger. Also, if the magnetic field required to reproduce the synchrotron emission is present continuously throughout the jet, the jet luminosity may actually be dominated by the Poynting flux (see caption of Tab. 1).
In order to estimate the energy density in the external photon field, an estimate of the average distance of the BLR from the central engine is required. This can be achieved in the following way. The most recent determination of the mass of the central black hole in BL Lacertae can be found in Wu & Urry, (2002). They find a value of . Then, if the width of the emission lines measured by Vermeulen et al., (1995), Corbett et al., (1996), and Corbett et al., (2000) is interpreted as due to Keplerian motion of the BLR material around the central black hole, we find an estimate of the average distance of the line producing material of pc. With this value, we can estimate the co-moving energy density in the external radiation field from the BLR compared to the magnetic-field energy density as
| (3) |
where ergs s-1 is the bolometric luminosity of the accretion disk, is the bulk Lorentz factor, and is the reprocessing depth of the broad line region. The luminosity of the accretion disk is very hard to constrain since it has never been observed directly in BL Lacertae. Here, we use a standard value of erg s-1 as a typical value for moderately luminous AGN. Using a value of the luminosity of the reprocessed emission from the BLR of ergs s-1 (Madejski et al.,, 1999), this would imply a value of . Then, with a magnetic field of G in the case of leptonic models, we find . Unfortunately, the lack of a simultaneous MeV – GeV -ray observation with our data set prevents us from imposing a tighter constraint on the BLR parameters. However, we point out that our basic model assumptions will not be severely affected by moderate variations in the parameters determining . For the case of the leptonic models, Böttcher & Chiang, (2002) have demonstrated that the spectral and variability patterns observed at optical and X-ray frequencies are only very weakly dependent on an additional contribution from external Compton scattering, as long as that contribution is not strongly dominant over other electron cooling mechanisms. In the case of hadronic models, with magnetic fields of order – 40 G (see § 4.2) the estimate on is lower by more than two orders of magnitude. Under these circumstances, the a priori assumption of a negligible external photon field in the hadronic model used here is clearly justified. Also, because in the latter models (see §4.2) the SSC component does not noticeably contribute to the total flux.
The EGRET data from the -ray outburst in 1997, the highest -ray flux ever observed from this source, are included in our figures only as a guideline for an upper limit. Those measurements had been accompanied by simultaneous optical and X-ray observations (Sambruna et al.,, 1999; Madejski et al.,, 1999; Böttcher & Bloom,, 2000), which indicate that the source was in a markedly different activity state than during the 2000 campaign. In particular, the ASCA 2 – 10 keV X-ray spectrum showed an energy index of , indicating that it might have been entirely dominated by the low-energy portion of the high-energy (X-ray – -ray) spectral component. For this reason, we did not make any attempt to reproduce the 1997 EGRET data in our model fits.
4 Spectral modeling
4.1 Leptonic model fits to the SEDs
Starting with the parameters derived in §3.3, we have done a series of simulations with our leptonic jet code, letting the electron and photon spectra relax to an equilibrium state. Since a moderate contribution from an external radiation field does not severely affect the SED and spectral variability signatures at optical and X-ray frequencies (Böttcher & Chiang,, 2002) and we do not have a measurement of the MeV – GeV flux simultaneous with our 2000 campaign data, we set the BLR Thomson depth to 0 in order to save CPU time. The solid curves in Fig. 2 shows our best-fit leptonic models for the two simultaneous SEDs of July 26/27, and Nov. 1, respectively. The relevant fit parameters are listed in Tab. 1.
The major change of parameters between the quiescent and the flaring state is given by a hardening of the electron spectrum, both through a significant change of the injection spectral index and the high-energy cutoff . In addition, slight changes in the Doppler boosting factor and the injection luminosity are required.
Tab. 2 lists the predicted GeV – TeV fluxes from our spectral fits for threshold photon energies GeV, GeV, and GeV, which have been corrected for absorption by the intergalactic infrared background absorption using the models of Aharonian, (2001). Since we have neglected any contribution from external Compton scattering of BLR photons, the values listed in Tab. 2 should be regarded as lower limits. The predicted flux levels indicate that BL Lacertae should be detectable with the new generation of atmospheric Čerenkov telescope arrays like VERITAS only in an extreme flaring state. If MAGIC reaches its design goals, it should be able to detect BL Lacertae in any state of activity.
We note that in all our leptonic and hadronic fits (see next section), our model radio fluxes are far lower than the actual data. This is because our models only follow the evolution of the jet during the early phase of -ray production during which radiative cooling is strongly dominant over adiabatic cooling. In this phase, the emission region is highly optically thick out to GHz radio frequencies. We do not follow the further evolution of the jet components through a possible phase of expansion in which they are expected to become gradually optically thin at radio frequencies, because this would necessitate the introduction of several additional, poorly constrained parameters. The evolutionary phase of the emission components followed in our model simulations happens on sub-pc scales, which are not resolveable even with VLBI (see, e.g., Denn et al., (2000) for a recent, detailed discussion of VLBI polarimetry of BL Lacertae) since an angular resolution of 1 mas corresponds to a linear scale of pc at the distance of BL Lacertae. For this reason, our results are consistent with BL Lacertae being a core-dominated radio source even in VLBI images.
4.2 Hadronic model fits to the SEDs
4.2.1 Oct. 31 – Nov. 2
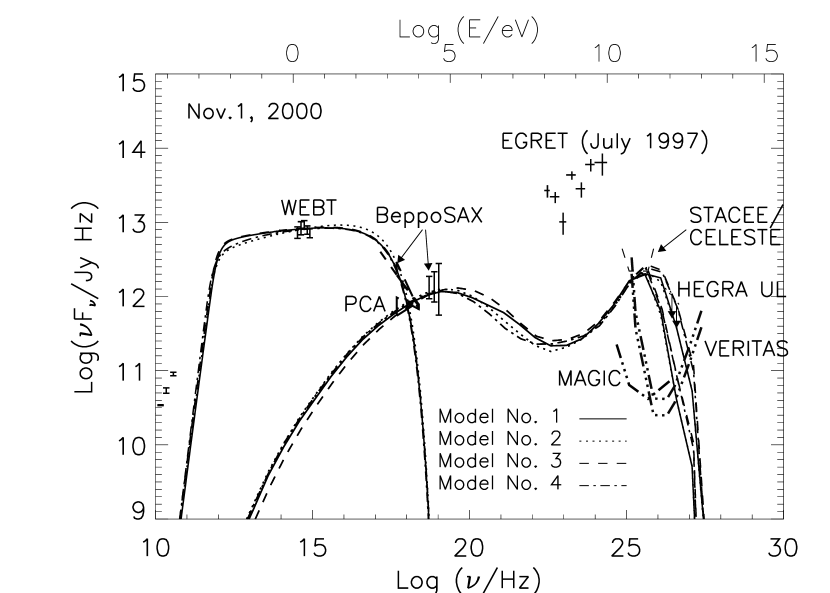
Fig. 3 shows a summary of SPB-models representing the data of October 31 – November 2, 2000, best. The primary electron synchrotron spectrum shows a low-energy break at the synchrotron self-absorption turnover energy of eV, followed by the synchrotron radiation from the injection particle spectrum that is modified by synchrotron losses. The turnover at about a few 100 eV with a subsequent steep tail is due to the cutoff in the electron distribution at particle Lorentz factor . This interpretation implies spectral breaks at a few 100 eV energies that are larger than 0.5. A spectral break between the optical and X-ray band can in principle explain the finding of the optical flux lying significantly below the power-law extrapolation of the BeppoSAX LECS+MECS spectrum (Ravasio et al.,, 2003; Böttcher et al.,, 2003). The observed color-flux diagram in the R-band (Fig. 1) constrains the electron injection spectra to be not significantly harder than . Our model fits (Fig. 3) use – .
A steep spectral decline at soft X-rays is suggested by the BeppoSAX LECS+MECS data. A high magnetic field of G in the emission region leads to a dominance of synchrotron losses throughout the emitted low-energy component (the escape loss dominated energy range lies below the synchrotron-self absorption turnover frequency). With these magnetic field strengths the optical synchrotron emission is expected to lag the soft X-ray emission by minutes.
The synchrotron radiation serves as the target photon field for photon-proton interactions and cascading which determines the radiative output at high energies. The high energy component of the SED is constrained by the RXTE/PCA data, the BeppoSAX PDS data and the upper limit from HEGRA. We have also included the EGRET data from the 1997 outburst (the highest EGRET flux ever measured from this source) as an upper limit in the MeV-GeV regime. The hardening of the PDS spectrum seems to indicate the onset of the high energy component just below 10 keV.
In the SPB model the PDS data can in general be explained by either direct proton synchrotron radiation or a strong reprocessed cascade component. The former possibility, however, requires extremely large Doppler factors and/or very high magnetic field strengths which would increase the total jet power to erg/s. Such high values are unlikely for low-luminosity BL Lac objects. In the following we therefore concentrate on the second option.
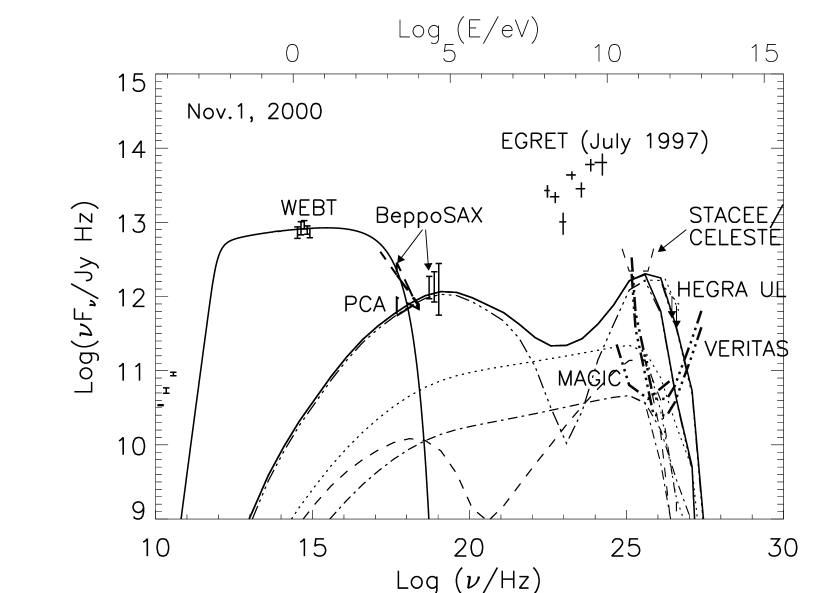
No variability has been observed with the PDS within the exposure time of sec in the jet frame. This constrains the parameter space. If the hard X-rays are due to reprocessed proton synchrotron radiation, the magnetic field is limited to values G. For a dominating reprocessed /-synchrotron component at hard X-rays only (jet frame) target photon densities eV cm-3 are in agreement with no variability within the exposure time. Both requirements favor models with dominating -production loss rates as compared to proton synchrotron losses. Indeed, all models that fit the November 2000 data exhibit strong /-synchrotron radiation and its reprocessed component while proton synchrotron radiation is almost negligible. As an example we show in Fig. 4 the contributions of the various cascade spectra to the total emerging radiation for model 1.
The HEGRA upper limit at GeV may potentially limit the maximum proton energy. The emerging high energy photon spectrum at source is, however, modified by photon-photon pair production during propagation through the cosmic background radiation field. The optical depth exceeds unity above 0.4 – 1.2 TeV utilizing the two most extreme background models in Aharonian, (2001). This absorption effect efficiently prevents photons of energy GeV to arrive at Earth. Another method for estimating the maximum input proton energy is possible through the luminosity of the reprocessed component provided the target photon density allows sufficient reprocessing. In this case, the luminosity of the reprocessed component is dependent on the input proton energies. We find that a limit to the proton injection spectrum of (due to -production losses) is in agreement with the observations in the X-ray regime.
Reasonable representations of the observed spectral energy distribution (SED) of November 2000 can be found for Doppler factors – 10 (leading to target photon densities of eV cm-3), magnetic field strengths between 20 and 40 G and electron and proton injection spectra with spectral indices of – 1.9 (see Table 1). Equipartition is reached within a factor 2. Models with higher Doppler factors usually violate the upper limit at TeV energies. In all cases the hard X-ray / soft -ray band up to MeV is dominated by reprocessed / synchrotron radiation, which is followed by a broad ”dip” up to GeV energies determined by the -cascade (see Fig. 4). GeV – TeV photons are expected due to / synchrotron radiation, and may be detectable by generation Atmospheric Cherenkov telescopes like VERITAS or MAGIC. Above GeV the spectrum is noticeably modified by the photons interacting with the cosmic background radiation field during propagation. Model fit 3 + 4 are in conflict with the HEGRA upper limit at energies TeV only for an extremely thin cosmic background photon field.
The model parameters representing the data are chosen to satisfy the following constraints: Flux variability provides an upper limit for the size of the emission region. We therefore fix the comoving emission region to D cm for both activity states (see Sect.3.3). The range of bulk Doppler factors of – 10 considered for the fitting procedure is consistent with the superluminal motion of detected by Denn et al., (2000), and imply viewing angles between and 8 degrees with bulk Lorentz factors . These values are also in good agreement with the expectations from unification schemes (e.g., Urry & Padovani,, 1995). Furthermore, approximate equipartition between particles and fields is anticipated. This effectively constrains the magnetic field strengths through Eq.(1). The injection spectral index finds limits from the observed optical colors (see Fig. 1). The maximum electron (and proton; see above) energy is well constrained by the X-ray observations. In addition, the maximum proton energy achievable by acceleration can never exceed the limit imposed by the Larmor motion, which must fit into the space of the emission region.
4.2.2 July 26/27
In comparison to November 2000, BL Lacertae was in a lower activity state in July 2000. Fig. 6 shows the simultanous broad band data together with a selection of SPB-models representing this state. Because both, electrons and protons, are assumed to be accelerated together, the maximum particle energy of each species reached in this process is expected to be correlated (though not necessarily linearly). The hard spectrum found by RXTE and BeppoSAX in July 2000 indicates that the radiation in this band belongs to a separate component from the optical emission detected by the WEBT campaign, implying a significantly lower cutoff energy of the primary electron population in July 2000 than in November 2000 if the magnetic field strength does not change significantly. It follows that also the maximum proton energies reached in July 2000 should be lower than in November 2000. Indeed, our modeling procedure requires injected proton spectra with a high-energy cutoff at lower energies in July 2000 (see Table 1). In addition, we find BL Lacertae’s SED in its lower activity state in agreement with Doppler factors – 8. A comparison with the fit parameters for the November 2000 SED suggests that the bulk Lorentz factor might be a relevant parameter for explaing different activity states.
For the modeling of fit 1 – 4 in July 2000 we use G, , and a primary electron-to-proton density ratio . With Doppler factors – 8 the target photon energy density in the jet frame, , is eV cm-3. The models predict the high energy power output in the GeV-to-TeV regime due to /-synchrotron radiation altered by attenuation in the cosmic backgound radiation field, and a broad “dip” in the EGRET energy range determined by the -cascades and extending into the hard X-ray band. The expected flux level at these energies lies close to EGRET’s flux sensitivity (for a typical exposure). The hard X-ray radiation is due to reprocessed /-synchrotron radiation. A spectral analysis at 0.01 – 1 MeV may reveal a broad curvature in the spectrum.
While in all these models proton synchrotron radiation plays only a minor role because of the rather thick target photon field for -interactions, we note that also model fits are possible where proton synchrotron emission is the dominant radiation process from X-rays to GeV -rays. These models, however, require large Doppler factors and magnetic field strengths G which leads to jet powers that are unreasonably high for BL Lac objects.
Models involving meson production inevitably predict neutrino emission due to the decay of charged mesons. The SPB-model for BL Lacertae in 2000 predict a -output of about GeV s-1 cm-2 peaking at around GeV. The neutrino power at GeV is about GeV s-1 cm-2. Neutrino flavor oscillations are not included in these estimates.
In summary, the hadronic SPB-model predicts TeV-emission on a flux level near or below the detectability capabilities of CELESTE and STACEE for BL Lacertae, but clearly above the sensitivity limit of future instruments like VERITAS, MAGIC and H.E.S.S. While leptonic models predict integral fluxes at GeV for BL Lacertae on a similar level as hadronic models do, (sub-)TeV emission detectable with very high-sensitivity instruments is only predicted for the hadronic emission processes, in contrast to leptonic models (see Tab.2). Interestingly, this finding is similar to the case of W Comae in 1998 where a similar comparative study has been performed (Böttcher et al.,, 2002). High-sensitivity TeV observations may therefore be useful as a diagnostic to distinguish between the hadronic and leptonic nature of the high-energy emission at least from some LBLs, in addition to its possible neutrino emission.
5 Spectral variability in the leptonic model
Due to the multitude of parameters involved in our models, we may expect that our choice of parameters is not unique. The ambiguities in pure spectral modeling of blazar SEDs have been drastically demonstrated for the case of W Comae by Böttcher et al., (2002). In order to refine our choice of parameters for our leptonic model fit and investigate the source of variability of BL Lacertae, we have done a detailed parameter study of various plausible flaring scenarios, starting from parameters of our quiescent-state fit. The results of this parameter study have been compared qualitatively with the observed trends in BL Lacertae in 2000 in order to pin down the most likely flaring scenario at work in this source (see §5.1). Based on this result, we have then resumed our fitting procedure to fit simultaneously the SED and optical and X-ray spectral variability patterns consistently in one complete model (§5.2).
5.1 Parameter study on spectral variability
The variability of blazars can in principle be initiated by a multitude of physical processes, all of which would imply specific changes in the fundamental modeling parameters of leptonic jet models. For the purpose of a qualitative comparison with the observed spectral variability patterns of BL Lacertae, we have done a series of simulations, focusing on a fluctuation of one or 2 of the basic model parameters, leaving all other parameters unchanged: (a) the total injection luminosity of ultrarelativistic particles into the jet , (b) the injection spectral index , (c) the high-energy cutoff of the electron injection spectrum , and (d) a combination of electron spectral hardening from (b) and (c). Other scenarios like a fluctuation in the Doppler factor or the magnetic field only can be ruled out immediately by virtue of the observed spectral variability.
In our simulations, we have represented a parameter fluctuation by a change to a new parameter value over a time , and then switching back to the equilibrium value. In the case of simulations (b) – (d) there is still an ambiguity concerning the choice of the normalization of the electron injection spectrum under spectral fluctuations. We have executed the suite of simulations (b) – (d) for two extreme assumptions: (1) leaving the injection power constant between the equilibrium state and the simulated flare, and (2) leaving the total number of injected electrons per unit time constant. We have found that the optical and X-ray spectral variability patterns for those two cases do not differ substantially from each other. The results presented in the following paragraphs concerning fluctuating electron spectral parameters refer specifically to the case of unchanged .
A typical set of simulation results is illustrated in Figs. 7 and 8. From the simulated, time-dependent spectra and light curves, we have calculated optical R-band magnitudes and color indices B – R. We have folded the simulated X-ray fluxes through the detector response of BeppoSAX, using the exact same effective area curves as used in the data analysis of Ravasio et al., (2003) to evaluate the resulting BeppoSAX count rates and hardness ratios as mentioned in §2. The simulated optical and X-ray spectral variability patterns from our flaring scenarios (a) – (d) are compared in Fig. 9.
First, we note that a model with a fluctuation of only the injection luminosity (a) is predicting very limited X-ray spectral variability and does not lead to the characteristic, positive brightness – hardness correlation observed at optical frequencies. Such a scenario thus seems unlikely to be the driving mechanism behind the variability of BL Lacertae.
Our model simulation with a fluctuation of the electron spectral index only (b) qualitatively reproduces the optical color – magnitude relation and the hardness – intensity anti-correlation at soft X-rays. It appears to be capable of reproducing a weak positive hardness – intensity correlation at harder X-rays (HR2 vs. MECS 4 – 10 keV count rate), which has occasionally been observed during our campaign. We conclude that such a scenario has a good potential to reproduce all the optical and X-ray spectral variability patterns observed during the 2000 campaign on BL Lacertae.
A scenario invoking primarily a fluctuation in (c) predicts a very small amplitude of optical variability, compared to the X-ray variability amplitude. It does predict a strong flux – hardness anti-correlation at soft X-rays, as observed in BL Lacertae, but fails to reproduce the optical color – magnitude correlation. We therefore conclude that this mechanism is not consistent with the observed spectral variability of BL Lacertae either. A scenario of combined changes of and (d) does qualitatively reproduce both the optical color – magnitude correlation and the soft X-ray hardness – intensity anti-correlation, but also predicts a strong hardness – intensity anti-correlation at harder X-rays (HR2 vs. MECS 4 – 10 keV count rate), which has not been observed by BeppoSAX.
In summary, we find that our flaring scenario (b), based on a hardening of the electron injection spectral index only, seems to be the most promising candidate for modeling the SED and spectral variability of BL Lacertae.
5.2 Simultaneous SED + variability model
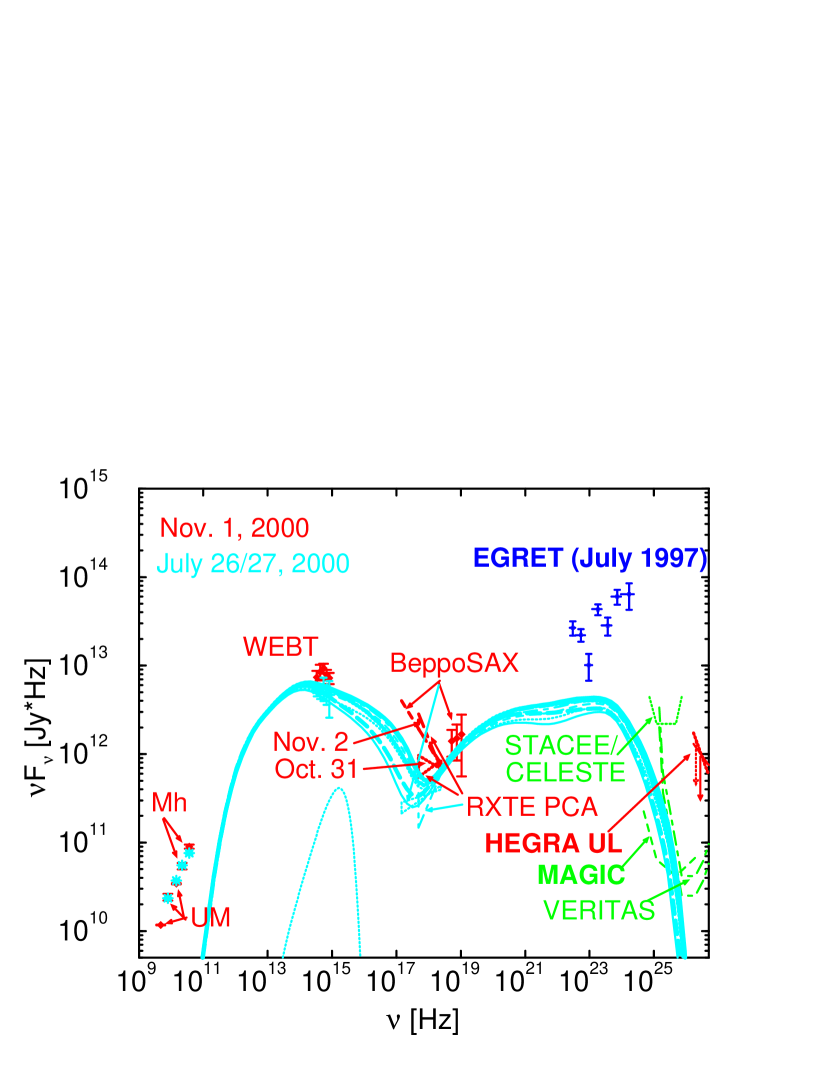
We are now ready to narrow down the parameter choices to model simultaneously the SED and spectral variability of BL Lacertae in 2000. For this purpose, we are first choosing parameters similar to the low state of July 26/27, but with the higher Doppler factor of to achieve approximate agreement with the average optical flux level around Nov. 1 and the hard RXTE PCA spectrum measured just prior to the flaring episode caught during the second BeppoSAX pointing on Oct. 31 – Nov. 2, 2000. Various scenarios of short-term fluctuations of the electron spectral index over were tested and compared with the observed SED, optical color – magnitude correlation and the BeppoSAX hardness – intensity correlations for individual flares during the Oct. 31 – Nov. 2, 2000, pointing.
Satisfactory agreement with all three of these observational results was achieved for the following choice of parameters: ; , , outside the flaring episode, changing to during the flare; ergs s-1, , yielding a magnetic field of G. The broadband spectral evolution resulting from this flaring scenario is illustrated in Fig. 10. It indicates how this flaring scenario reproduces the hard X-ray spectrum seen by PCA right before the flaring episode, and switches to the synchrotron-dominated soft high-flux spectrum during the flare. The light curves at optical, X-ray and -ray frequencies resulting from this simulation are shown in Fig. 11. The significantly larger flaring amplitude at X-rays compared to optical frequencies is clearly well reproduced. The flaring amplitude is largest at the highest -ray energies, where the flux increases by almost 2 orders of magnitude, to reach levels well above the anticipated, nominal detection threshold of MAGIC.
The results of our leptonic fit simulation are compared to the observed optical color – magnitude correlation and to the time averaged emission from our hadronic fits in Fig. 1. We see that the hadronic fit for the low state lies well within the observed range of optical colors and R-band magnitudes, while the optical color predicted from the high-state fit is harder by (corresponding to a difference in the local spectral index of ) than the observed B - R values. The leptonic flaring fit coincides reasonably well with the range of R magnitudes and B - R colors observed during the active phase after Sept. 2000, though the actual simulated spectral hysteresis curve lies slightly above the observed correlation. We have explored multiple attempts to remedy this slight discrepancy, but could not find a better representation of the data than the one shown in Fig. 1 which would still be consistent with both the SED and the X-ray variability patterns discussed below. However, the difference is minute — even for the hadronic model fit —, and may be explained by uncertainties in the adopted de-reddening and the subtraction of the host galaxy contribution (for an in-depth discussion of these issues, see Villata et al.,, 2002; Ravasio et al.,, 2003).
Fig. 12 compares our simulated X-ray spectral hysteresis curves to the observed hardness-intensity correlation during a well-resolved X-ray flare at 0.5 hr – 6.5 hr UT on Nov. 1, 2000. The figure illustrates that the overall flux levels and hardness ratio values are well within the observed range, and that the time evolution of those values is consistent with the results of our simulation. Clearly, the statistical errors on the BeppoSAX count rate and hardness-ratio measurements are too large to test for the existence of the actual spectral hysteresis phenomena predicted in our simulation. Our fit predicts slight counterclockwise spectral hysteresis for our favoured SED + spectral variability fit. Future observations using, e.g., Chandra or XMM-Newton would be extremely useful to test this prediction.
Finally, we discuss a possible 4 – 5 hr delay of the optical fluxes with respect to X-ray flares for which a statistically not significant hint in the BL Lac data of 2000 was found. All of our simulations discussed in this section did not lead to a systematic time delay with significant flux peak separation in time between the X-ray and optical flares. Such a feature might be expected in a scenario where solely a high-energy population of electrons is injected into the jet, which subsequently cools due to radiative losses. We have run a simulation, similar to the ones described above, but injecting only a narrow distribution of ultrarelativistic electrons into the jet during the flare. Such a scenario does reproduce the spurious 4 – 5 hr delay, but would predict a strong anti-correlation between optical flux and hardness, in contradiction with the observed color-magnitude relation. Thus, we conclude that such a scenario can be ruled out.
6 Discussion
Overall, our parameter choice for the leptonic models for BL Lacertae are in reasonable agreement with those found by other authors based on earlier multiwavelength campaigns on this source (e.g., Madejski et al.,, 1999; Böttcher & Bloom,, 2000; Ravasio et al.,, 2003). In agreement with those authors, our best-fit Doppler factor of is well within the range typically found for blazar modelling, and the magnetic field of G is intermediate between typical values found for leptonic modeling of flat-spectrum radio quasars (FSRQs) and high-frequency peaked BL Lac objects (HBLs). While FSRQs are usually successfully modelled with a few G (e.g., von Montigny et al.,, 1997; Sambruna et al.,, 1997; Mukherjee et al.,, 1999; Ghisellini et al.,, 1999; Hartman et al.,, 2001), typical values found for HBLs are of the order of G (e.g. Tavecchio et al.,, 1998; Kataoka et al.,, 1999; Coppi & Aharonian,, 1999; Kataoka et al.,, 2000; Petry et al.,, 2000; Krawczynski et al.,, 2002).
In our analysis of the spectral variability patterns, we have found that those patterns can successfully be modelled with a fluctuation of the electron injection spectral index. Remarkably, our time-dependent fits indicate that an injection index larger than , even during the peak of an individual short-term flare, is required. If the injection of ultrarelativistic electrons into the emitting volume is caused by Fermi acceleration at relativistic shocks, detailed numerical studies have shown that with fully developed turbulence in the downstream region, a unique asymptotic index of – 2.3 should be expected (e.g., Achterberg et al.,, 2001; Gallant et al.,, 1999). However, recently Ostrowski & Bednarz, (2002) have shown that Fermi acceleration might lead to drastically steeper injection spectra if the turbulence is not fully developed. Furthermore, depending on the orientation of the magnetic field at the shock front, an abrupt steepening of the injection spectra may result if the shock transits from a subluminal to a superluminal configuration. In this context, our leptonic fit results may indicate that such predominantly geometric effects, may be the cause of the rapid variability observed in BL Lacertae.
In their analysis of the BeppoSAX + optical continuum spectra of the Oct. 31 – Nov. 2 observations, Ravasio et al., (2003) have noticed that the time averaged optical and LECS + MECS X-ray spectra can not be connected smoothly using a single power-law or a smoothly connected broken power-law. They have suggested and investigated several possibilities how this discrepancy could be remedied, including a variable dust-to-gas ratio, the bulk Compton process (Sikora et al.,, 1997), a multi-component emission model, and a spectral upturn resulting from Klein-Nishina effects on the electron cooling rates. The results of our combined leptonic spectral + variability modeling of BL Lacertae suggest that the discrepancy ultimately arises artificially as a result of the time averaging involved when producing the high-quality BeppoSAX LECS + MECS spectrum. The fact that our time-dependent leptonic fits reproduce the observed ranges of optical and X-ray fluxes and spectral indices simultaneously resolves the issue of this optical – X-ray spectral discrepancy, and removes the need for any additional assumptions concerning intergalactic absorption and/or electron populations in the jet.
In contrast to leptonic models, the hadronic SPB model required significantly larger magnetic field strengths (of order 20 – 40 G) on the length scale of the size of the emission region of cm. The range of Doppler factors appears about a factor of 2 lower than in the leptonic models. The total jet power, which turns out to be below the estimated accretion disk luminosity, remains larger in hadronic models than in leptonic ones owing to the higher particle and field energy content. The state transition from low to higher activity in 2000 is well described by an increase of the co-moving particle energy and the bulk Lorentz factor. In the picture of diffusive shock acceleration (in the test particle limit) the maximum particle energies are related to the magnetic turbulence spectrum (see, e.g., Biermann & Strittmatter,, 1987; Reimer et al.,, 2004, and references therin). The required maximum electron and proton energies in the presented models can be understood if the particles gain energy by diffusive shock acceleration in a turbulence spectrum where is the wave number in the turbulent magnetic field. Spectral-index changes can not be ruled out, but they are not the dominant cause of the spectral variability of BL Lacertae in the framework of the presented modeling using the SPB model.
An interesting diagnostic for the particle content in the jet – in addition to any neutrino detections – might be achieved through high sensitivity observations in the (sub-)TeV energy range by e.g. MAGIC or VERITAS. While both, leptonic and hadronic models, predict a similar flux level in the GeV-energy range, hadronic models predict about an order of magnitude higher flux values than leptonic ones do above 40 GeV for BL Lacerate in 2000. Furthermore, considering the results of our variability study, the predicted VHE -ray flux from a leptonic jet only reaches the peak level mentioned above during short flares. It depends critically on the duty cycle of such flaring events whether a sufficient time-averaged level of VHE flux can be sustained for low-energy-threshold Cherenkov telescopes like MAGIC to accumulate a measurable signal.
Our leptonic SED + spectral variability fit predicted spectral hysteresis at soft X-ray energies which might serve as a confirmation of our fit results. The limited count statistics of our BeppoSAX observations did not firmly establish nor rule out the existence of X-ray spectral hysteresis. More sensitive, dedicated observations by Chandra and/or XMM-Newton would be extremely helpful to test this prediction. According to our hadronic model fits presented in this paper, flares of BL Lacertae were primarily caused by increasing particle energies. If this is indeed the dominant flaring mechanism and it is not accompanied by significant changes of the electron spectral index, then short-term X-ray spectral variability might be reasonably well represented by the patterns resulting from our leptonic models with increasing with at most very moderate spectral-index changes. These did not show significant spectral hysteresis. However, fluctuations of the electron injection spectral index could not be excluded in our hadronic fits. Consequently, the presence of pronounced soft X-ray spectral hysteresis in BL Lacertae may slightly favour the leptonic models, while its absence would favour hadronic models, but the discriminating power of such a measurement in the case of BL Lacertae would be rather limited.
7 Summary
In this paper, we have presented the results of detailed numerical modeling of the SEDs and spectral variability of BL Lacertae in 2000, using both leptonic and hadronic (SPB) jet models. Details of the data analyses and observational results have been published in three previous papers on this campaign (Villata et al.,, 2002; Ravasio et al.,, 2003; Böttcher et al.,, 2003). The main results of our modelling work are:
-
•
Both leptonic and hadronic models are able to provide acceptable fits to the SEDs of BL Lacertae in 2000, both in the low activity state on July 26/27 and in the high activity state on Oct. 31 – Nov. 2.
-
•
In addition to the naturally much higher overall jet power required for hadronic models ( ergs s-1 vs. ergs s-1 [depending on the possible Poynting-flux contribution]), the hadronic SPB model requires a factor of higher magnetic fields ( – 40 G vs. G) and a significantly lower bulk Lorentz factor ( – 9 vs. ).
-
•
Considering time-averaged emission during the two intensity states, hadronic models predict a sustained level of multi-GeV – TeV emission which should be detectable with second-generation atmospheric Cherenkov telescope systems like VERITAS, HESS, or MAGIC. In contrast, our leptonic model only predicts a peak flux exceeding the anticipated nominal MAGIC sensitivity during short flares; the accumulated fluence over observing time scales of several hours might not be sufficient for a significant detection. Thus, a future VHE detection of BL Lacertae would be a strong indication for hadronic processes being at work in this object.
-
•
A parameter study of various spectral variability scenarios in the framework of our leptonic jet model revealed that the observed optical and X-ray spectral variability in BL Lacertae in 2000 can be reproduced through short-term fluctuations of only the electron injection spectral index, with all other parameters remaining unchanged. Our simulation of this scenario predicts counter-clockwise spectral hysteresis at X-ray energies. Such hysteresis was not predicted in the specific SPB model fits presented in this paper, but could not clearly be ruled out either. Thus, sensitive spectral-hysteresis measurements of BL Lacertae could possibly serve as a test of our modeling results and a secondary diagnostic to distinguish between leptonic and hadronic models, though, by itself, it would not be sufficient as a model discriminant.
-
•
The previously noted discrepancy between the time-averaged optical and X-ray spectra may be resolved by considering the spectral variability. Our successful modeling of the observed time-dependent flux and hardness values at optical and X-ray frequencies in the framework of a leptonic model effectively removes the need for additional assumptions concerning additional particle populations, extreme Klein-Nishina effects on the electron cooling rates, and/or anomalies in the intergalactic absorption.
References
- Achterberg et al., (2001) Achterberg, A., Gallant, Y. A., Kirk, J. G., & Guthmann, A. W., 2001, MNRAS, 328, 393
- Aharonian, (2001) Aharonian, F. A., 2001, Proc. of 27th Int. Cosmic-Ray Conf. (Hamburg), 8, 250
- Appl & Camenzind, (1993) Appl, S., & Camenzind, M., 1993, in: “Jets in extragalactic radio sources”, Lecture notes in physics 421, 123
- Baum et al., (1995) Baum, S. A., Zirbel, E. L., & O’Dea, C., 1995, ApJ 451, 88
- Biermann & Strittmatter, (1987) Biermann, P. L., & Strittmatter, P. A., 1987, ApJ, 322, 643
- Blandford, (1994) Blandford, R. D., 1994, ASP Conf. Ser. 54, 23
- Blandford & Levinson, (1995) Blandford, R. D., & Levinson, A., 1995, ApJ, 441, 79
- Bloom & Marscher, (1996) Bloom, S. D., & Marscher, A. P., 1996, ApJ, 461, 657
- Bloom et al., (1997) Bloom, S. D., et al., 1997, ApJ, 490, L145
- Böttcher & Bloom, (2000) Böttcher, M., & Bloom, S. D., 2000, AJ, 119, 469
- Böttcher, (2002) Böttcher, M., 2002, in proc. “The Gamma-Ray Universe”, XXII Moriond Astrophysics Meeting, Th Gii Publishers, Vietnam, eds. A. Goldwurm, D. N. Neuman, & J. T. T. Vn, p. 151
- Böttcher & Chiang, (2002) Böttcher, M., & Chiang, J., 2002, ApJ, 581, 127
- Böttcher et al., (2002) Böttcher, M., Mukherjee, R., & Reimer, A., 2002, ApJ, 581, 143
- Böttcher et al., (2003) Böttcher, M., et al., 2003, ApJ, 596, 847
- Coppi & Aharonian, (1999) Coppi, P. S., & Aharonian, F. A., 1999, ApJ, 521, L33
- Corbett et al., (1996) Corbett, E. A. et al. 1996, MNRAS, 281, 737
- Corbett et al., (2000) Corbett, E. A., Robinson, A., Axon, D. J., & Hough, J. H., 2000, MNRAS, 311, 485
- Denn et al., (2000) Denn, G. R., Mutel, L. R., & Marscher, A. P., 2000, ApJS, 129, 61
- Dermer et al., (1992) Dermer, C. D., Schlickeiser, R., & Mastichiadis, A., 1992, A&A, 256, L27
- Dermer & Schlickeiser, (1993) Dermer, C. D., & Schlickeiser, R., 1993, ApJ, 416, 458
- Dermer et al., (1997) Dermer, C. D., Sturner, S. J., & Schlickeiser, R., 1997, ApJS, 109, 103
- Fossati et al., (1998) Fossati, G., Maraschi, L., Celotti, A., Comastri, A., & Ghisellini, G., 1998, MNRAS, 299, 433
- Gallant et al., (1999) Gallant, Y. A., Achterberg, A., & Kirk, J. G., 1999, A&AS, 138, 549
- Georganopoulos & Marscher, (1998) Georganopoulos, M., & Marscher, A. P., 1998, ApJ, 506, L11
- Ghisellini et al., (1999) Ghisellini, G., et al., 1999, A&A, 348, 63
- Ghisellini & Celotti, (2001) Ghisellini, G., & Celotti, A., 2001, MNRAS, 327, 739
- Hartman et al., (2001) Hartman, R. C., et al., 2001, ApJ, 553, 683
- Horan et al., (2002) Horan, D., et al., 2002, ApJ, 571, 753
- Kataoka et al., (1999) Kataoka, J., et al., 1999, ApJ, 514, 138
- Kataoka et al., (2000) Kataoka, J., Takahashi, T., Makino, F., Inoue, S., Madejski, G. M., Tashiro, M., Urry, C. M., & Kubo, H., 2000, ApJ, 528, 243
- Kirk et al., (1998) Kirk, J. G., Rieger, F. M., & Mastichiadis, A., 1998, A&A, 333, 452
- Krawczynski et al., (2002) Krawczynski, H., Coppi, P. S., & Aharonian, F. A., 2002, MNRAS, 336, 721
- Kusunose et al., (2000) Kusunose, M., Takahara, F., & Li, H., 2000, ApJ, 536, 299
- Kusunose et al., (2003) Kusunose, M., Takahara, F., & Kato, T., 2003, ApJ, 592, L5
- Li & Kusunose, (2000) Li, H., & Kusunose, M., 2000, ApJ, 536, 729
- Madejski et al., (1999) Madejski, G., et al., 1999, ApJ, 521, 145
- Maraschi et al., (1992) Maraschi, L., Ghisellini, G., & Celotti, A., 1992, ApJ, 397, L5
- Marscher et al., (2004) Marscher, A. P., Jorstad, S. J., Aller, M. F., McHardy, I. M., Balonek, T. J., Terasranta, H., & Tosti, G., 2004, in X-Ray Timing 2003: Rossi and Beyond, ed. P. Kaaret, F. K. Lamb, & J. H. Swank, AIP Conf. Proc., in press
- Mastichiadis & Kirk, (1997) Mastichiadis, A. & Kirk, J. G., 1997, A&A, 320, 19
- Mücke & Protheroe, (2001) Mücke, A., & Protheroe, R. J., 2001, Astropart. Phys., 15, 121
- Mücke et al., (2003) Mücke, A., Protheroe, R. J., Engel, R., Rachen, J. P., & Stanev, T., 2003, Astropart. Phys., 18, 593
- Mukherjee et al., (1999) Mukherjee, R., et al., 1999, ApJ, 527, 132
- Ostrowski & Bednarz, (2002) Ostrowski, M., & Bednarz, J., 2002, A&A, 394, 1141
- Petry et al., (2000) Petry, D., et al., 2000, ApJ, 536, 742
- Pian et al., (1998) Pian, E., et al., 1998, ApJ, 492, L17
- Protheroe & Mücke, (2000) Protheroe, R. J., & Mücke, A., 2000, in “Particles and Fields in Radio Galaxies”, Oxford Radio Galaxy Workshop 2000, ASP Conf. Ser., eds. R. E. Laing & K. M. Blundell
- Raiteri et al., (2001) Raiteri, C. M., et al., 2001, A&A, 377, 396
- Ravasio et al., (2002) Ravasio, M., et al., 2002, A&A, 383, 763
- Ravasio et al., (2003) Ravasio, M., Tagliaferri, G., Ghisellini, G., Tavecchio, F., Böttcher, M., & Sikora, M., 2003, A&A, 408, 479
- Reimer et al., (2004) Reimer, A., Protheroe, R. J., & Donea, A.-C., 2004, A&A, in press
- Sambruna et al., (1997) Sambruna, R., et al., 1997, ApJ, 474, 639
- Sambruna et al., (1999) Sambruna, R., et al., 1999, ApJ, 515, 140
- Sikora et al., (1994) Sikora, M., Begelman, M. C., & Rees, M. J., 1994, ApJ, 421, 153
- Sikora et al., (1997) Sikora, M., Madejski, G., Moderski, R., & Poutanen, J., 1997, ApJ, 484, 108
- Sikora & Madejski, (2000) Sikora, M., & Madejski, G., 2000, ApJ, 534, 109
- Sikora et al., (2001) Sikora, M., Blazejowski, M., Begelman, M. C., & Moderski, R., 2001, ApJ, 554, 1 (Erratum: ApJ, 561, 1154)
- Stawarz & Ostrowski, (2003) Stawarz, L., & Ostrowski, M., 2003, New Astron. Rev., 47, 6-7, 521
- Tavecchio et al., (1998) Tavecchio, F., Maraschi, L., & Ghisellini, G., 1998, ApJ, 509, 608
- Urry & Padovani, (1995) Urry, M. C., & Padovani, P., 1995, PASP, 107, 803
- Vermeulen et al., (1995) Vermeulen et al. 1995, ApJ, 452, 5
- Villata et al., (2000) Villata, M., et al., 2000, A&A, 363, 108
- Villata et al., (2002) Villata, M., et al., 2002, A&A, 390, 407
- von Montigny et al., (1997) von Montigny, C., et al., 1997, ApJ, 483, 161
- Wu & Urry, (2002) Wu, J. H., & Urry, C. M., 2002, ApJ, 579, 530


thick long-dashed;


| Model | [G] | D | |||||||
|---|---|---|---|---|---|---|---|---|---|
| (el.) | (el.) | [ergs s-1] | [cm] | ||||||
| Lept., July 26/27 | 1100 | — | — | 2.4 | 1.4 | 16 | |||
| Lept., Nov. 1 | 1100 | — | — | 2.15 | 1.4 | 18 | |||
| Hadr., July 26/27 | 1 | 2.7 | 1.9 | 40 | 7 | ||||
| Hadr., Nov. 1 | 1 | 1.9 | 1.9 | 40 | 9 |
| Model | |||
|---|---|---|---|
| [photons cm-2 s-1] | [photons cm-2 s-1] | [photons cm-2 s-1] | |
| Lept., July 26/27 | |||
| Lept., Nov. 1 | |||
| Hadr., July 26/27 | |||
| Hadr., Nov. 1 |