The absence of crystalline silicates in the diffuse interstellar medium111Based on observations with ISO, an ESA project with instruments funded by ESA Member States (especially the PI countries: France, Germany, the Netherlands and the United Kingdom) and with the participation of ISAS and NASA
Abstract
Infrared spectroscopy provides a direct handle on the composition and structure of interstellar dust. We have studied the dust along the line-of-sight towards the Galactic Center using Short Wavelength Spectrometer (SWS) data obtained with the Infrared Space Observatory (ISO). We focussed on the wavelength region from 8–13 m which is dominated by the strong silicate absorption feature. Using the absorption profiles observed towards Galactic Center Sources (GCS) 3 and 4, which are C-rich Wolf-Rayet Stars, as reference objects, we are able to disentangle the interstellar silicate absorption and the silicate emission intrinsic to the source, toward Sgr A∗ and derive a very accurate profile for the intrinsic 9.7 m band. The interstellar absorption band is smooth and featureless and is well reproduced using a mixture of 15.1% amorphous pyroxene and 84.9% of amorphous olivine by mass, all in spherical sub-micron-sized grains. There is no direct evidence for substructure due to interstellar crystalline silicates. By minimizing of spectral fits to the absorption feature we are able to determine an upper limit to the degree of crystallinity of silicates in the diffuse interstellar medium (ISM), and conclude that the crystalline fraction of the interstellar silicates is 0.2% 0.2% by mass. This is much lower than the degree of crystallinity observed in silicates in the circumstellar environment of evolved stars, the main contributors of dust to the ISM. There are two possible explanations for this discrepancy. First, an amorphization process occurs in the ISM on a time scale significantly shorter than the destruction time scale, possibly caused by particle bombardment by heavyweight ions. Second, we consider the possibility that the crystalline silicates in stellar ejecta are diluted by an additional source of amorphous silicates, in particular supernovae. We also compare our results with a study on silicate pre-solar grains found in interplanetary dust particles.
1 Introduction
In the last decade, a multitude of evidence for the presence of crystalline silicates in various astrophysical environments has emerged. In particular, infrared spectra have revealed that silicates in circumstellar environments often contain a significant crystalline fraction, both around post-main-sequence stars (e.g. Waters et al. 1996; Molster et al. 2002) and pre-main-sequence stars (e.g. Waelkens et al. 1996; Meeus et al. 2001). In addition, crystalline silicates are ubiquitous in the Solar System, not only in the more evolved bodies such as planets, but also in primitive objects like comets (e.g. Wooden 2002). Because crystallization is inhibited by high energy barriers, the origin and evolution of the crystalline silicate fraction in interstellar and circumstellar media has the potential to provide direct evidence of the energetic processing of grains.
The life cycle of dust starts in the outflow of evolved stars, continues upon ejection in the interstellar medium and eventually ends in the planet forming disk around a young star. It is surprising that, whereas at the beginning and end of dust grains’ lifes crystallinity is prevalent, no crystallinity is found in the intermediate phase (i.e. in the diffuse interstellar medium). In fact, a relatively high upper limit to the degree of crystallinity in the diffuse ISM has been determined recently (Li & Draine 2001). Less than 5% by number of the interstellar Si-atoms were found to be incorporated in crystalline silicate grains of m in size, which is roughly equivalent to a mass fraction of %. On the other hand, Bowey & Adamson (2002) have suggested that, while the broad and structureless interstellar 10 m absorption feature is commonly ascribed to amorphous silicates, the crystalline spectral detail may be washed out in a very complex mixture of crystalline silicates. Furthermore, some studies on silicates in the dense ISM have reported the (controversial) detection of crystalline silicate features (Cesarsky et al. 2000; Onaka & Okada 2003), but one has to bear in mind that this environment has very different physical properties than the diffuse ISM.
In this work, we will re-address the issue of crystallinity in the diffuse ISM by studying the line-of-sight towards the Galactic Center. Because of its large amount of extinction and its high infrared flux, the sightline towards the Galactic Center has often been used to characterize the properties of interstellar dust (Roche & Aitken 1985; Rieke et al. 1989; Pendleton et al. 1994; Tielens et al. 1996; Lutz et al. 1996; Chiar et al. 1998). We will study the 10 m silicate absorption feature in order to determine the degree of crystallinity in this line-of-sight. In Sect. 2 we will discuss the ISO SWS observations and data reduction, as well as the characteristics of the region around Sgr A∗ and the correction method applied for emission intrinsic to the Galactic Center (GC) region. The method used to determine the dust composition in the diffuse ISM is described in Sect. 3 along with the results. In Sect. 4 we discuss two mechanisms to explain the discrepancy in crystallinity observed between stellar ejecta and the diffuse ISM. A comparison with silicates in the solar system and planet forming disks around other stars is given in Sect. 5. Sect. 6 contains the conclusions.
2 Observations and data reduction
2.1 ISO SWS observations of Sgr A∗ and nearby objects
During the life time of the ISO mission (Kessler et al. 1996), 2.38 – 45.2 m SWS spectra (de Graauw et al. 1996) of the Galactic Center and two sight lines in the nearby Quintuplet cluster were obtained. Table 1 gives an overview of these observations.
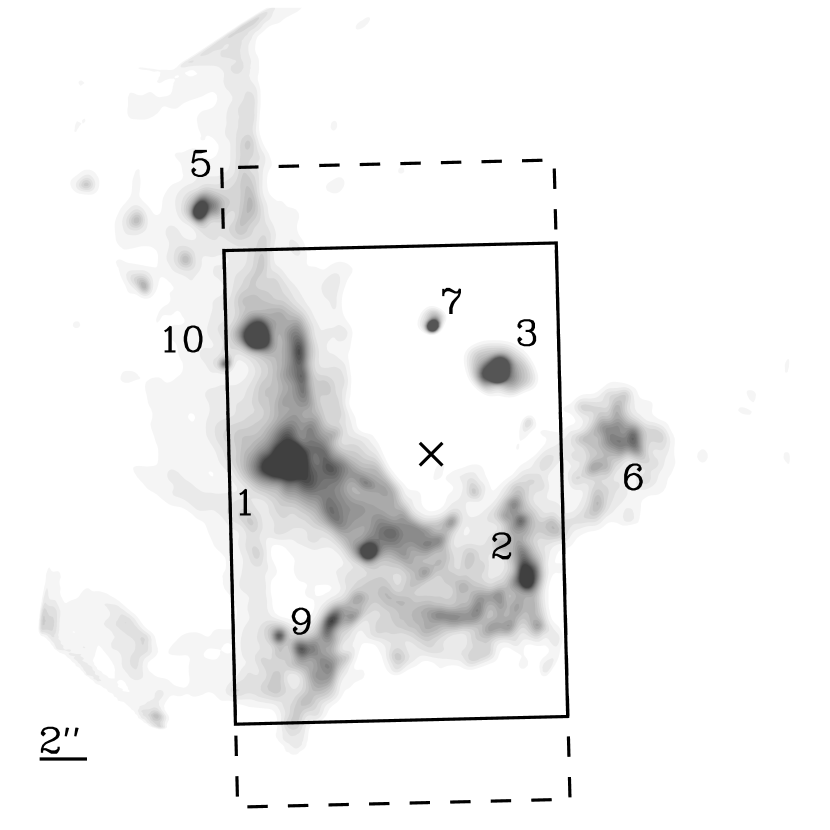
The Galactic Center region is very crowded, while the beam ISO used for the SWS observations is very large. In Fig. 1 the orientation and positions of the beam is indicated on a 12.4 m map of the Galactic Center (Tanner et al. 2002). The beam includes infrared sources (IRS) 1, 2, 3, 7, 9 and 10, of which IRS 1 is the brightest at 12.4 m. At the position of Sgr A∗ itself there is virtually no 12.4 m emission. IRS sources 1, 2, 9 and 10 lie along an arc on the so-called Ridge, generally believed to be a complex of Hii regions. IRS 7 is a late-type supergiant and is the brightest 2.2 m source in the vicinity of the galactic center. IRS 3, an OH/IR star, shows the 10 m silicate feature in absorption (Becklin et al. 1978). In the large SWS beam, the mid-IR emission is dominated by the extended emission associated with IRS 1.
GCS 3 and 4 are members of the Quintuplet cluster. The positions of the beams are indicated on the ISOCAM image presented in Fig. 1 of the study by Moneti et al. (2001). In the observation of GCS 3, the beam was centered on GCS 3-I (or Q4), however, GCS 3-II (or Q2) is the brightest mid-infrared source in the beam and dominates the measured spectrum (Moneti et al. 2001).
2.2 Data reduction
The full ISO SWS spectrum of the line-of-sight towards Galactic Center was first published by Lutz et al. (1996). We chose to reduce this spectrum again to fully address the problems caused by the detector memory effects in band 2. In addition, we used the SWS spectra of GCS 3 and 4 as a reference to correct for the silicate emission intrinsic to the Sgr A∗ region. The spectra of GCS 3 and 4 were previously published in the fore-mentioned work by Moneti et al. (2001), but we redid the data reduction to be consistent with the reduction of the spectrum of Sgr A∗.
We used the Interactive Analysis package (IA3) to reduce all three spectra. In addition to the automated routines provided in this package, the up and down scans were analyzed separately to remove glitches and detector jumps by hand. To correct for the detector memory effects, most prominently present in band 2 (ranging from 4.08 to 12.0 m), the Fouks-Schubert model was applied (see Sect. 2.3). From the spectra in band 2c and all sub-bands of band 3 (ranging from 7.00 to 29.0 m) we removed residual fringes which were present after the Relative Spectral Responsivity Function (RSRF) was applied. Rebinning according to actual spectral resolution was performed ( for the speed 4 observations of Sgr A∗; for the speed 3 spectra of GCS 3 and 4), and data points deviating more than 3 per bin were removed, resulting in a loss of 2% of the data points. Narrow spectral lines were excluded from sigma-clipping. Finally the spectra from the individual detectors were rescaled to the average flux levels to produce a smooth spectrum rather than a dot cloud.
2.3 Detector memory effects
It is known that ISO SWS spectroscopy suffers from memory effects in the data, a problem predominantly found in data from bands 2 and 4 (i.e. the wavelength ranges from 4.08–12.0 m and 29.0–45.2 m). The semi-conductors that the detectors consist of do not fully discharge between subsequent measurements in a wavelength scan. When the flux levels in a certain (sub-)band vary only by a small amount, this is not a large problem, since the amount of memory in each measurement will be more or less constant, and simply generates an offset in the flux levels. The relative flux levels will not be affected, so it may be relatively easy to correct for the memory when subtracting the dark current. In cases where a large variation in flux levels occurs within one sub-band, the memory effects require additional attention. This is the case in band 2c, ranging from 7.00–12.0 m, which contains the entire interstellar absorption feature due to silicates. The discharging of the semi-conducting material can be described with a set of differential equations (Fouks & Schubert 1995). This model expresses the time delay in the charging on the incident intensity. The larger the change in flux levels, the longer it takes to reach the charging corresponding to the incident flux. Vriend (1999) has applied the Fouks-Schubert model to the data in band 2, and was able to correct for the memory effects. The successful application of this model can be easily checked by comparing the data of the up- and down-scans separately, since the memory effects should affect these data in opposite wavelength directions. This difference is minimized when the memory correction is applied successfully. Only a very small residual memory effect remains. The application of the Fouks-Schubert model to correct for memory effects in band two, which was first developed for the data analysis of the GC line-of-sight (Vriend 1999), is now implemented in the IA3 package and the ISO standard pipe line data products (Leech et al. 2003; Kester 2003).
2.4 Correction for silicate emission intrinsic to Sgr A∗
Fig. 2 shows the ISO SWS spectra of Sgr A∗, GCS 3 and GCS 4. Since it is thought that the absorption feature at 10 m is caused by interstellar dust particles along the line-of-sight, and that the dust composition along those lines-of-sight is very similar, it is remarkable that the 10 m absorption feature towards Sgr A∗ seems to be much narrower than the features observed towards the Quintuplet stars. This is illustrated in panel b) of Fig. 3, which gives the raw optical depth for GCS 3 and Sgr A∗ calculated directly from , where is a continuum determined using fourth order polynomial fitting.
The stars in the Quintuplet cluster are identified as carbon-rich Wolf-Rayet stars (Figer et al. 1999). We therefore assume that there are no circumstellar silicates that give rise to emission or absorption features intrinsic to the Quintuplet stars and that the shape of the feature is entirely determined by interstellar absorption. Indeed, Moneti et al. (2001) conclude that the Quintuplet cluster does not contain any gas or dust between its stellar components and that the silicate absorption feature is a truly interstellar feature.
We assume that the dust composition in the line-of-sight towards Sgr A∗ does not differ much from that towards the Quintuplet sources, and therefore conclude that the difference of the absorption profile can be explained by silicate emission intrinsic to the Sgr A∗ region. It has been reported that the line-of-sight towards the GC contains more molecular clouds than those toward the Quintuplet sources (Chiar et al. 2001). We assume that this only leads to a difference in optical depth, and not to a difference in dust composition. Rather, we attribute the difference in the 10 m profile of Sgr A∗ and the Quintuplet sources to the presence of underlying silicate emission in the former. Since the S/N of the spectrum observed towards Sgr A∗ is much better than the data of the Quintuplet source, we are aiming to correct for the silicate emission local to Sgr A∗ to obtain the intrinsic interstellar profile. We assume that the silicate contribution local to Sgr A∗ gives rise to the same feature in emission as it does in absorption. Likely, the silicate emission is associated with dust in the Hii region, IRS 1. Because the resulting observed absorption feature is determined by the intrinsic emission and interstellar absorption, we applied an iterative process to determine the shape of the interstellar absorption and GC emission feature. The differences with GCS 3 or GCS 4 are minimized (the best results are achieved for GCS 3, see panel c) and d) of Fig. 3), finally resulting in the corrected interstellar absorption feature. Panel e) of Fig. 3 shows the spectral appearance of the GC silicate emission feature, where the reader must keep in mind that: First, the emission is the sum of all the mid-infrared sources in the ISO beam, and second, the spectrum is only de-reddened for the optical depth in the feature and that the fact that the silicate interstellar absorption feature is superposed on a extinction continuum is ignored.
A similar correction to determine the interstellar absorption in the 10 m feature was first performed by Roche & Aitken (1985), who used the silicate profile of red supergiant Cep as a template for the interstellar absorption in order to de-redden their observations of the galactic center environment. This was justified by the resemblance between the Cep silicate feature and the absorption feature observed towards a number of carbon-rich Wolf-Rayet stars (Roche & Aitken 1984).
3 Determination of the dust composition
3.1 Method
The corrected optical depth is presented in Fig. 3c and Fig. 4 and can be compared directly to the opacity of the various dust components at these wavelengths. The mass absorption coefficient correlates to the optical depth according to , where is the distance to the galactic center, is the average density of the considered dust species, is the number density of grains and the average mass of a dust grain. We can define a the mass column density and thus fit the 10m absorption feature by solving:
| (1) |
for . A continuum subtraction is performed on the mass absorption coefficients between the same wavelength boundaries which were used to obtain the optical depth in the interstellar 10 m feature. Consequently only the contribution to the optical depth in features is taken into account.
In order to solve Eq. (1) we applied the fitting method, which involves minimizing
| (2) |
where the is the uncertainty in the measured values arising from our data reduction procedure. They represent the spread in individual measurements of the twelve different SWS detectors, before the spectrum was collapsed into one point per spectral bin. A measure for the goodness of the fit is given by the reduced value, , defined as with . The parameter represents the number of data points in the spectrum, and gives the number of free parameters. The values derived by our fitting method can be very high (at least ), while textbook examples always require this value to be close to unity. Two different effects contribute to these high values.
First, is only determined by the random scatter in the measurements, while the systematic errors in the flux levels can be significantly higher than that. Sources for these systematic errors could be residuals of the memory effect, which can be as high as 2% in either direction or features introduced by the responsivity functions. Second, the application of a fitting method assumes that the model does not contain uncertainties. In fact the model spectra we use are based on mass absorption coefficients measured in the laboratory and therefore have intrinsic uncertainties. It is hard to quantify the combined effect of the uncertainties in the laboratory spectra and the systematic errors in the ISO SWS data. We have elected to use only the uncertainties directly resulting from the ISO SWS data in the fitting method.
We performed fits with different dust components, both amorphous and crystalline silicates. First, we have determined confidence levels for the fit with only amorphous dust components (see Sect. 3.2) using the method discussed by Press et al. (1992). In addition we use the -test (Bevington & Robinson 1992) to determine the goodness of the fits when crystalline silicates were added. This test shows how much a fit improves if a parameter is added. The value is calculated from
| (3) |
where is the decrease in between the initial and new fit, and is the value from the fit with the extra parameter added (i.e. the new fit). The parameter measures the relative improvement of a the of a fit to randomly scattered data when an additional component is included. The larger , the more significant is the improvement (see e.g. p. 209 of Bevington & Robinson 1992).
3.2 The amorphous component
In order to find the mass fraction contained in the crystalline silicates, the total mass in the amorphous component has to be determined, which depends on its composition. The chemical composition of amorphous silicates is determined by the formation path. Amorphous silicates resulting from the amorphization of crystalline silicates will have the stoichiometry of that crystal, while amorphous silicates formed through direct condensation from a gas cloud or by collisions and subsequent merging of two distinct grains are most likely to have a non-stoichiometric composition. Most measurements of the optical properties of amorphous silicates are limited to the stoichiometries of olivines and pyroxenes, except for a recent study by Jäger et al. (2003a), who applied the sol-gel method to construct amorphous silicates of some selected non-stoichiometric compositions. In the sol-gel method Mg- and Si-hydroxides (Mg(OH)2 and Si(OH)4) are mixed in the liquid phase. Extraction of H2O by chemical reaction between the Mg- and Si-hydroxides then gives rise to the formation of silicates. Because the two components can be mixed in any desired ratio, it is possible to synthesize non-stochiometric amorphous Mg-silicates. For more details, the reader is referred to the work by Jäger et al. (2003a). However, the spectral appearance of these materials does not match the interstellar absorption feature, therefore we will only consider stoichiometric compositions. We have used the optical constants determined by Dorschner et al. (1995) for olivine (MgFeSiO4) and pyroxene (MgFeSi2O6). The use of laboratory optical constants allows us to immediately convert the derived optical depths into column densities of dust as well as derive their chemical composition.
The appearance of the 10 m feature depends on the grain shape and grain size of the silicate particles. In Fig. 5 an overview of the most important effects is given, for both amorphous olivine and pyroxene. Small spherical grains (up to m in size) all produce exactly the same shape for the spectral feature. For larger grains, the feature starts to broaden towards longer wavelengths. This effect becomes stronger with increasing grain size. The use of non-spherical grains, represented by a continuous distribution of ellipsoids (CDE; Bohren & Huffman 1983), tends to shift the peak of the feature to longer wavelengths. With CDE calculations it is impossible to include any information on grains size. Amorphous olivine in the form of spherical grains small in size compared to the wavelength (the Rayleigh limit) provide a good fit to the 10 m feature (Vriend 1999). It is even possible to exclude the presence of a high fraction of larger grains as well as more than 1% of the mass in the form of forsterite, based on this spectrum (Bouwman et al. 2001). We find however, that the fit using just amorphous olivine can be further improved by adding amorphous pyroxene (also in small spherical grains). This is consistent with the suggestion that part of the silicates in the ISM are converted from olivines into pyroxenes to explain the pyroxene presence in protostars (Demyk et al. 2000).
Our result that spherical grains smaller than m are responsible for the 10 m absorption feature is more or less consistent with the ISM grain size distribution determined by Mathis et al. (1977, MRN), which has an upper limit of 0.25 m. Based on a ROSAT study of the X-ray scattering halo of Nova Cygni 1992, Witt et al. (2001) found that they needed to extend the MRN grain size distribution to sizes much larger than 0.25 m in order to explain the observed scattering halo. In contrast, the same observations led Draine & Tan (2003) to conclude they did not need such large grains; grains with sizes larger than 0.4 m accounted for only a small amount of the observed scattering. Still a significant contribution to the scattering is caused by the 0.1–0.4 m sized grains, while these grains do not really contribute to the 10 m silicate absorption profile discussed in this study. Of course, the determination of grain sizes through X-ray scattering is weighted towards larger grain sizes, since those grains dominate the forward scattering cross section, while the infrared absorption profile is determined by the volume weighted average of the silicate grain size distribution, putting less weigth on this discrepancy between the IR and X-ray results.
The best fit (lowest value) of the 10 m feature using small spherical olivine and pyroxene grains is given in panel a) of Fig. 4. We find that olivine contributes 84.9 % by mass and pyroxene 15.1 %, for a fit of the 10 m feature between 8.3 and 12.3 m. The remaining residues are at most of the order of which is about 3 % of the optical depth in the 10 m feature itself. These results were achieved using only the amorphous silicates with number ratio Mg/Fe = 1. Dorschner et al. (1995) have measured the optical properties of amorphous pyroxenes MgxFe(1-x)SiO3, with x=0.4, 0.5, 0.6, 0.7, 0.8, 0.95, and 1.0 and olivines Mg2xFe2(1-x)SiO4 with x=0.4 and 0.5. The synthesis of silicates with values of outside the listed range (i.e. for the pyroxenes and or for the olivines) resulted in the formation of crystalline rather than amorphous silicates (C. Jäger, priv.comm.). The spectral differences within the pyroxene and olivine family are smaller than the differences between those families. We have determined the and values for several amorphous silicate mixtures, and found that only a few combinations led to an improvement according to the -test. The -values are only modest (of the order of 200 at most) compared to the improvements achieved when the crystalline silicates are added (see Tab. 3), and indicate that the pyroxenes are probably slightly Mg-rich, with a composition between Mg0.5Fe0.5SiO3 and Mg0.6Fe0.4SiO3. Although the sampling of the olivines is limited, the fit to the 10 m feature improves marginally ( 100) when Mg0.8Fe1.2SiO4 is added to the mixture of dust components, indicating a slightly Fe-rich composition. Since the improvements are very small, and the composition is very close to a Mg/Fe ratio of unity, we will consider only the amorphous silicates with in the remainder of this analysis.
In case of the amorphous silicates, we have solved Eq. (1) using extinction efficiencies rather than mass absorption coefficients . We find that for the given dust composition and wavelength interval over which the fit is performed the derived mass fractions of 84.9 % and 15.1 % for olivine and pyroxene respectively are accurate within 0.1% with a confidence of more than 99.99%. In other words, the ratio olivine:pyroxene = 5.6:1. However, when crystalline silicates are added (see Sect. 3.3), we find that the ratio between amorphous olivines and pyroxenes may vary, from 5.6:1 to 4.8:1.
Based on this fit, we can not only determine the relative masses of olivine and pyroxene, but also the column densities of the amorphous silicates towards the Galactic Center, and hence the silicate density in the diffuse ISM averaged over this line of sight.
3.2.1 The abundance of Si
The silicate mass column density in the diffuse ISM is given by
| (4) |
with being the specific density of the mineral the grains are made of. The continuum subtracted optical depth is given by , while is the continuum subtracted extinction efficiency. The parameter gives the radius of the grain, and the distance to Sgr A∗ is represented by . The densities are 3.71 g cm-3 and 3.2 g cm-3 for olivine and pyroxene respectively (Dorschner et al. 1995). We find that the mass column density of olivines in the diffuse ISM g cm-2. For the pyroxenes we find g cm-2. These two interstellar silicate components add up to a total column density of g cm-2.
Under the assumption of solid grains we find that the column density of Si-atoms contained in silicates in the diffuse line-of-sight toward the Galactic Center is cm-2. A recent estimates for the column densities of neutral hydrogen based on X-ray scattering yields cm-2 (Baganoff et al. 2003). Adopting this value, the abundance of Si in silicates is , which is somewhat higher than the total Si-abundance of found in the solar neighborhood (Sofia et al. 1994). Porosity of the silicate grains is suggested as an explanation, because porous grains appear to have stronger 9.7 m resonances relative to (Mathis 1998; Iatì et al. 2001). This is supported by observations of the ratio averaged over several sight lines (e.g. Roche & Aitken 1984; Mathis 1998), while this ratio seems to be towards the Galactic Center. On the other hand, it seems unlikely that grain properties in GC line-of-sight are different from other sight lines, and a more likely explanation may be found in the enhanced metallicity in the inner region of the Galaxy, which could easily explain the slight overabundance observed towards Sgr A∗. This is supported by the observations summarized in Fig. 5.8 of Whittet (2003).
3.3 The crystalline fraction in the diffuse ISM
We determined the degree of crystallinity by adding the mass absorption coefficients of some crystalline silicates to the sum in Eq. (1). We have limited our search to the components already identified to be present in astrophysical environments. These are forsterite, clino- and ortho-enstatite, and diopside. For consistency, we adopted the measurements obtained in one experimental set-up. Since diopside is only measured in one laboratory (Koike et al. 2000), we thus used the mass absorption coefficient () measurements of clino- and ortho-enstatite and forsterite from the same laboratory (Koike et al. 1999). The measurements were obtained from minerals crushed in a mortar, leading to non-spherical grain shapes. The grains larger than 0.5 m in size were removed, and the remaining grains were incorporated in a KBr pellet. When using the mass absorption coefficients from these experiments we assume that the grain shape and size distribution of the sample resembles that of the crystalline silicates in the ISM.
The small residues remaining when the fit with only amorphous silicates was performed, suggest that there is not much room for crystalline silicates left. The mass fraction of crystalline silicates is probably considerably less than 3% (the level of the residues compared to the total optical depth) because the resonances produced by crystalline silicates in the 10 m region are not only much narrower (see Fig. 6) but also intrinsically much stronger than the resonances due to amorphous silicates.
The values of all four species of crystalline silicates are included in Eq. (1). We have minimized and find that the best fit is given by a crystalline over amorphous fraction of 0.2 % by mass. The composition of crystalline silicates found in this best fit is dominated mostly by forsterite, while 1/6 of the crystalline silicates are in the form of either diopside or enstatite. It is hard to distinguish between the contributions of the various crystalline pyroxenes, as their strongest resonance at 9.2 m largely overlaps. On the other hand, the olivines are easily distinguished from the pyroxenes, because of the presence of a strong resonance at 11.2 m.
In order to determine the amount of each individual crystalline dust component that could be present, we have added them separately to the amorphous mixture and determined the best fit. The -test was performed to determine the significance of adding these different dust components. The results are shown in Table 2. We find that the most significant improvement is achieved when forsterite is added to a completely amorphous mixture, resulting in an value of 900. A smaller improvement, but still significant, is achieved by adding diopside to a completely amorphous composition. Adding ortho-enstatite does not lead to a very significant improvement, which can be concluded from the small value (see Sect. 3.1). Adding clino-enstatite does not improve the fit at all. When diopside is added to a mixture of amorphous silicates and forsterite also only a minor improvement is achieved.
To study the significance of the result that 0.2% of the silicates are crystalline, we have constructed a variety of dust compositions, ranging from 0.1% to 3% in degree of crystallinity . We used a mass ratio of 5.6:1 for amorphous olivine:pyroxene, and a ratio of 6:1 for forsterite:(enstatite+diopside). We assumed that diopside and enstatite were present in equal amounts. For each of these crystallinities, the best fits by minimizing the and value are obtained, and compared with the fit for 0% crystallinity, by performing the -test. The results are given in Table 3. For %, the fit has improved compared to the purely amorphous dust composition. Since all the , the improvement of the fit is significant. For %, the fit deteriorates quickly with increasing , and the resulting values are negative. Examination of the residuals allows us to firmly determine that the degree of crystallinity of silicates in the diffuse ISM is %. In Fig. 4 some sample residuals are shown. For % for example, the overabundance of crystalline silicates clearly appears in the residuals and in the model spectrum. Hence we derive that the degree of crystallinity in the diffuse interstellar medium is 0.2% 0.2%.
Although % gives the best fit to the optical depth in the 10 m silicate feature, we would like to point out that this number may be an upper limit as well. It is mostly determined by the 11.2 m forsterite feature. Other possible interstellar dust components such as PAHs, carbonates, water ice and SiC have strong resonances near this wavelength too, which may account for part of the optical depth at that particular wavelength, thus decreasing the contribution and mass fraction of crystalline silicates.
From this analysis it becomes clear that forsterite may be present in the diffuse interstellar medium, at a mass fraction of at most 0.2%. The other crystalline components only contribute in minor amounts.
3.4 Other dust components
Besides crystalline silicates, several other dust components have resonances overlapping with the wavelength range covered by the amorphous silicate absorption feature. Of high astrophysical interest is silicon carbide (SiC), a dust component commonly produced by carbon-rich AGB stars. In a similar fashion as described here, the mass of SiC with respect to silicates can be determined, and compared to the dust mass ratio produced by carbon-stars versus oxygen-stars. Indeed, Whittet et al. (1990) were able to determine that the abundance of Si atoms in interstellar SiC was less than 5% of the abundance of Si in interstellar silicates, which translates into a mass fraction taken by SiC of % of the total Si-containing containing dust. This result is based on low resolution 7.5 – 13.5 m spectroscopy of Galactic Center sources (Roche & Aitken 1985). Whittet et al. (1990) conclude that SiC probably is destroyed upon ejection into the interstellar medium on a time scale of years.
We have used the optical properties presented by Laor & Draine (1993) to calculate how many spherical SiC grains with radius 0.1 m could be present in the line-of-sight towards the Galactic Center. A strong resonance at 10.6 m may be used to determine the abundance of SiC in the diffuse ISM. We find that adding the opacity of SiC to a mixture of amorphous silicates or to a mixture of amorphous and crystalline silicates only deteriorates the fit, leading to negative -values. Our conclusion is that 0.1 m sized spherical SiC grains make up % of the interstellar Si-bearing dust mass. This is a factor of 17 better than the previous determination based on ground-based 10 m spectra (Whittet et al. 1990). Analysis of this result requires the use of reliable optical properties of SiC, which are currently unavailable (Speck et al. 1999). In a future study we will re-address this issue (F. Kemper & A. Speck, in prep.).
4 Silicate processing in the diffuse ISM
4.1 Injection of circumstellar silicates
It is generally believed that AGB stars and red supergiants dominate the production of oxygen-rich dust in the Galaxy (see e.g. Whittet 2003, and references herein). Most oxygen-rich dust produced by these stars is in the form of silicates. The density of M supergiants is found to be 1–2 kpc-2 (Jura & Kleinmann 1990) projected on the galactic plane, while the density of AGB stars is 25 kpc-2 (Jura & Kleinmann 1989). Almost all supergiants and about half of the AGB stars produce silicate dust. Since OH/IR stars occur 10 times less frequent than Miras (Habing 1996), we can infer that the density of Miras is 11.4 kpc-2, while the density of OH/IR stars is 1.1 kpc-2. Adopting a typical mass-loss rate of 10-7 yr-1 for the Miras and 10-4 yr-1 for the M supergiants and OH/IR stars (see e.g. Habing 1996, and references herein) and assuming that the dust-to-gas ratio is 0.01 we are able to determine the dust injection rate (Table 4). We assume that all oxygen-rich dust produced by these stars is in the form of silicates. The crystalline fraction of AGB stars is relatively well known. It is estimated that about 10 % of the silicates around OH/IR stars are crystalline, while for the Miras only an upper limit of 40% of the crystallinity can be derived (Kemper et al. 2001). The degree of crystallinity in the spectra of M supergiants is less well known, in part because most of those dust shells are optically thin and may be able to hide a large amount of crystalline silicates in a similar way as described in Kemper et al. (2001). We use the supergiant AFGL 4106 as an example and adopt the derived crystallinity of 15–20% (Molster et al. 1999) as a typical value. Hence, the crystallinity of the silicates in the combined stellar ejecta will be 11–18%, where 4–5% originates from OH/IR stars and 7–13% from M supergiants. The contribution from Miras is negligible (Table 4). One has to realize that most of these estimates are based on a few objects, and the degree of crystallinity of stellar ejecta is inherently an uncertain number.
The degree of crystallinity of silicates in the ejecta of stars (11–18%) contributing to the interstellar dust budget is significantly different from the crystallinity observed in interstellar silicates (0.2% 0.2%). We will explore two possible explanations for this discrepancy. We mainly focus on the possibility that an amorphization process occurs on time scales significantly shorter than the destruction time scales, in order to decrease the degree of crystallinity, specifically amorphization by cosmic ray hits or particle bombardment (Sect. 4.2). In addition, we consider the possibility that the crystalline fraction in stellar ejecta is diluted by a yet neglected source of amorphous silicates, greatly decreasing the average crystallinity of newly synthesized dust (Sect. 4.3). We will discuss the dust production by supernovae (SNe), recently suggested to be a significant source of galactic dust (Dunne et al. 2003).
4.2 Amorphization in the diffuse ISM
In previous studies (e.g. Jones et al. 1994) the grain destruction rates and dust life time in the interstellar medium have been estimated. However, to date the rates and time scales involved with crystallization and amorphization in interstellar conditions have not yet been addressed. In this work, we will derive an expression for the grain amorphization rate, and we will compare this to laboratory experiments on the amorphization of grains in astrophysical conditions.
The total mass of crystalline and amorphous silicates in the ISM can be written in the form of coupled differential equations:
| (5) |
where and represent the crystalline and amorphous silicate mass in the ISM respectively. is the injection rate of stellar silicates assumed to be constant over time, with the mass fraction of stellar silicates that are crystalline, which is also constant. The amorphization rate is given by , the crystallization rate by and the destruction rate by . Under interstellar conditions will be very small, and therefore we assume it to be 0. We assume that at the current time equilibrium is reached, which implies the stationary solution, i.e.
| (6) |
| (7) |
and
| (8) |
where is the mass fraction of silicates in the ISM that has a crystalline lattice structure, given by .
For silicate grains the destruction rate is yr-1, corresponding to a dust life time of yr (Jones et al. 1994, 1996), although Tielens (1998) derives a significantly shorter life time of yr, using observed depletions. Adopting the longest time scale of yr as a conservative choice, the measured crystallinities and require an amorphization rate of yr-1 to reach a final crystallinity of 0.2%. This corresponds to an amorphization time scale of 5 Myr. Because the upper limit to the crystallinity of the silicates in the ISM is 0.4%, the amorphization rate should be faster than yr-1, corresponding to a time scale of 9 Myr or shorter. Better determinations of the degree of crystallinity of the silicates in stellar ejecta may yield a change in the amorphization time scale. The time scales derived here should therefore be treated only as estimates.
The most likely process to cause amorphization on time scales of 5 Myr are ion bombardments of incident particles on crystalline grains. Studies of dust grains collected by the Apollo astronauts on the surface of the moon suggest that amorphization by ion bombardments occurs. These studies have revealed that most grains are surrounded by a 60–200 nm thick amorphous rims. It is suggested that these rims are caused by solar wind radiation damage, during the relatively short period (5,000 – 10,000 years) that each particular grain was exposed to it before the grain was covered by other extralunar grains deposited on the moon’s surface (Borg et al. 1980). Although other mechanisms for the amorphization have been suggested, such as the deposition of vapor phase materials after the impact of a meteorite on the surface of the moon (Keller & McKay 1993), it is thought that at least part of the amorphous material found of the moon is the result of damage by particles from the solar wind (Keller & McKay 1997).
To date several laboratory studies have investigated the effect of ion bombardments on crystalline grains (e.g. Day 1977; Bradley 1994; Wang et al. 1998; Demyk et al. 2001; Carrez et al. 2002; Jäger et al. 2003b; Brucato et al. 2003), measuring the required dose for amorphization as a function of energy and element used. In general, the dose (eV cm-3) can be written as
| (9) |
where (cm-2) is the particle fluence and (eV cm-1) the stopping power. From the compilation of experimental data presented by Brucato et al. (2003) it becomes clear that for 30-60 keV ions 80% disorder is achieved for doses over eV cm-3. In this regime, the experiments are dominated by nuclear stopping power. The stopping powers for the ions considered are: keV H eV Å-1; keV He eV Å-1; keV Ar eV Å-1 (Brucato et al. 2003). The Ar2+ abundance is not known for these low energy cosmic rays, but using intermediate and high energy measurements, as well as cosmic abundances of the elements, we estimate that the abundance with respect to He is (see e.g. Wefel 1988). Although Ar2+ is not very abundant in cosmic rays it actually deposits a large amount of energy over a short distance. The particle flux necessary to achieve the required dose for amorphization follows from Eq. (9), and we find that cm-2, to be collected over less than 9 Myr. Extrapolating using Eq. (3) from Brucato et al. (2003), we obtain an estimate that the intensity of particles with energies of 60 keV equals 1 particle cm-2 s-1 sr-1, although this formula has not been verified for this energy range. Integrating over an entire sphere and over the maximum amorphization time scale of 9 Myr, we find that a grain has seen particles cm-2, containing a dose of Ar2+ ions cm-2. This is not sufficient to amorphitize a crystalline grain by means of Ar2+ bombardment. It has been suggested, that the more abundant Fe2+-ions (, see Wefel (1988)) might be able to explain the amorphization. The stopping power of a 60 keV Fe2+ ion is 75 eV Å-1 (E. Bringa, priv.comm.), however, the required dose of Fe2+ for amorphization remains yet to be experimentally determined, although calculations of the amorphization process are well on their way (Bringa & Johnson 2002, 2004). Processing by the abundant C,N,O-ions may contribute to the amorphization as well. Finally, as stated before, the ion flux in the keV regime is not known, and remains subject to further study. The amorphization time scale may in fact provide a constraint on the ion flux in the keV regime.
4.3 Dilution of stellar ejecta
A significant source of silicate dust may be the production by supernovae. Recently, it has been suggested that type II supernovae (Dunne et al. 2003) and type Ib supernovae (Morgan et al. 2003) can produce on the order of a solar mass of dust per supernova, which is much higher than what is generally accepted (Whittet 2003, see also Table 4). These new results are based on SCUBA/JCMT photometry at 450 and 850 m of Cas A and Kepler’s supernova remnant respectively. The submm photometry requires a cold dust component (in addition to the warm dust component traced by IRAS photometry) to explain the spectral energy distribution. Although the authors argue that this dust is produced by the supernovae, it may also be swept up interstellar dust. Depending on the choice of FIR/submm dust emissivities it is estimated that Cas A is surrounded by 2-4 of cold dust, while Kepler’s supernova remnant contains in the form of cold dust. It is debatable whether two data points provide sufficient information to constrain the complex physical environment in a supernova remnant, where the number of free parameters is only constrained by one’s imagination, and describe properties such as geometry, density distribution, clumpiness, grain properties, dust composition and the interaction with the surrounding interstellar medium. Indeed, Dwek (2004) shows that a much smaller dust mass in the form of metallic iron needles explains the same submm data points. The galactic dust production rate by SNe is estimated to be yr-1 (Dunne et al. 2003; Morgan et al. 2003), which is dominated by the cold dust. The authors have derived this rate by scaling the dust production rates for type II supernovae (Todini & Ferrara 2001) with the dust condensation efficiency determined for Cas A, assuming it had a 30 progenitor, and applying a supernova rate, which arises from standard values of the initial mass function and star formation rate (L. Dunne, priv.comm.). When this supernova dust production rate is compared with the production rate from other stars ( yr-1; Whittet 2003), one can conclude that 60–75 % of the galactic dust originates from supernovae.
Unfortunately, the two SCUBA data points used for this determination do not yield any information on the composition of this cold dust component. The presence of a 22 m feature in the warm dust component of Cas A is reported (Arendt et al. 1999), which is attributed to a Mg-protosilicate. Mg-protosilicate is a MgO/SiO2 gel formed in a solution of Na-silicate and MgCl2 (Day 1974), which can be seen as a Mg-rich amorphous silicate.
In order to estimate an upper limit on the dilution, we assume that all dust produced by supernova comes out in the form of amorphous silicates. Thus, if we adopt that 60–75 % of the galactic dust originates from supernova, and that the remaining 25–40 % produced by evolved stars has a degree of crystallinity of 11–18 %, one easily sees that in case of the most efficient dilution, the combined stellar ejecta still have a degree of crystallinity of 3–7%, which is still more than an order of magnitude larger than the observed crystallinity of (0.2 % 0.2%) observed for silicates in the diffuse interstellar medium. Clearly, dilution by supernova dust does not fully explain the low degree of crystallinity observed in the diffuse interstellar medium, although it may contribute to some extent.
We will not consider dilution by silicates formed in the diffuse ISM. In the low density environment of the diffuse interstellar medium, the formation of amorphous silicates from gas phase molecules is unlikely, although the high depletion of Si and high grain destruction rate suggest that grain formation occurs (Jones et al. 1994; Draine 2003). The observed difference in depletion between cloud- and intercloud-regions in the ISM (see e.g. Sofia et al. 1994) show that dust destruction and formation commonly occurs in the ISM (Tielens 1998).
5 Comparison with presolar grains, young stars and the dense interstellar medium
Crystalline silicates are reported to be present in the dense interstellar environment, based on the identification of features in the ISO spectra. While the presence of crystalline silicates in circumstellar environments is well established, their presence in the dense ISM remains subject to discussion. Dense ISM crystalline silicates were first reported to be present in Orion (Cesarsky et al. 2000), but the features ascribed to crystalline silicates in this work may very well be explained by a combination of a PAH emission plateau, memory effects in the data and incorrect band merging (F. Kemper, in prep.). Onaka & Okada (2003) report on the detection of diopside in the Carina Hii region, based on the identification of the 60 m feature by diopside. In other environments, other identifications of this feature have been suggested, including water ice around evolved stars (Barlow 1998), dolomite in planetary nebulae (Kemper et al. 2002), and recent measurements of melilite also look promising as an identification of the 60 m feature (Chihara et al. 2003). Even though there are some indications that crystalline silicates are present in dense clouds associated with young stellar objects, at most 1-2 % of the silicates seen in the lines-of-sight towards protostars can have a crystalline lattice structure (Demyk et al. 1999).
Crystalline silicates are often found the direct circumstellar environments of pre-main-sequence stars and young main-sequence stars. They are detected in debris disk object Pic (Knacke et al. 1993), in some T Tauri stars (Honda et al. 2003) and are quite common in the more massive Herbig Ae/Be stars (e.g. Bouwman et al. 2001; Meeus et al. 2001). To date, no crystalline silicates have been found in the younger, deeply embedded class 0 objects (Demyk et al. 1999).
The lack of crystalline silicates in the diffuse interstellar medium suggests that crystalline silicates found in environments associated with star formation and dense clouds are formed or annealed locally. There might have been an exchange of crystalline silicates between dense clouds, cloud cores and circumstellar disks, but any excursion into the diffuse ISM would make a crystalline silicate amorphous on a very short time scale.
In the solar system, cometary dust particles are generally believed to be the most pristine dust particles, which survived the formation of the solar system without being processed. Infrared spectroscopy of comets and laboratory analysis of cometary dust particles has revealed that comets contain a considerable fraction of crystalline silicates, usually around 30%. The remainder of the silicates is found to be amorphous (Wooden 2002, and references herein). Recent model calculations, however, suggest that the amount of crystalline silicates in comet Hale-Bopp may be significantly lower than previously assumed (M. Min, in prep.). The crystallization of these cometary silicates must have occurred after the grain has left the diffuse interstellar medium, either in the dense molecular cloud, during the star formation process or in the solar nebula, and thus cometary grains do not represent unaltered interstellar dust. Another way to study cometary dust is by collecting interplanetary dust particles (IDPs) of cometary origin in the stratosphere of the Earth. Both the remote observations of comets and the study of IDPs suggest that the crystalline fraction in comets is much larger than in the interstellar medium. That suggests perhaps whole scale recrystallization and mixing in the solar nebula has occurred, in which grains are evaporated and recondensed in the crystalline form.
Messenger et al. (2003) have studied a sample of nine anhydrous IDPs collected by NASA over a number of years and were able to identify 1031 individual silicate subgrains. Six of these grains have non-solar oxygen isotopic compositions, indicating a presolar origin of these grains. The isotopic ratios point to formation by red supergiants or AGB stars. It is important to realize that grains with an isotopic composition that resembles the solar composition may have condensed in the presolar nebula, but could also originate from the prestellar nebulae of young stellar objects in the vicinity of the solar nebula. The six grains of non-solar isotopic composition therefore only represent a lower limit to the number of presolar or interstellar grains in the sample. For three of the grains with non-solar isotopic ratios the mineralogical composition has been determined; two of them are found to be GEMS grains (glasses with embedded metals and sulfides, i.e. amorphous silicates; Bradley 1994) and one turns out to be a forsterite grain. From this one might conclude that 1/6 of the interstellar grains are crystalline, which contradicts our result. The IDP study clearly suffers from small number statistics, and their result will become more significant if more data on the composition of presolar grains can be acquired.
6 Conclusions
In this work, the results of a study on the crystallinity of silicates in the diffuse ISM have been presented. It is known that crystalline silicates are common in the circumstellar environment of both pre- and post-main-sequence stars. It is generally accepted that the dust particles found in the circumstellar environment of young stars originate from evolved stars, and have arrived in their current location after a long (several Gyr) residence time in the interstellar medium. The puzzling lack of evidence of crystalline silicates in the ISM, prompted us to set a firm upper limit on the crystallinity.
Studying the 10 m silicate feature in absorption towards Sgr A∗ we are able to determine that at most 0.4% of the silicates in the interstellar medium have a crystalline structure. The data are best fitted with a degree of crystallinity of 0.2%. In addition, we have determined the composition of the amorphous silicate component in the diffuse interstellar medium. We found that 84.9% of the amorphous grains are olivine (Mg2xFe2(1-x)SiO4) and 15.1% are pyroxene (MgxFe(1-x)SiO3). The amorphous grains were found to be spherical and smaller than m in radius. Detailed analysis of the 10 m feature indicates that the pyroxenes are probably slightly Mg-rich (with ) and the interstellar olivines may be Fe-rich (with ).
By comparison of these results with the crystallinity of the silicates produced by mass-losing stars, and the interstellar grain destruction rate, we have determined the interstellar amorphization rate, and found that crystalline silicates are effectively amorphitized in 5 Myr to achieve a final crystallinity of 0.2%, while an amorphization time scale of 9 Myr is consistent with the determined upper limit of 0.4%. These numbers are only estimates, as the crystallinity of stellar ejecta is not determined very accurately yet.
Amorphization by low energy ion bombardment has been explored as an explanation for the low degree of crystallinity of silicates in the ISM, but the results are not yet consistent with the observed low degree of crystallinity. In addition, dilution by other sources of amorphous silicates, such as supernovae, are not sufficient to explain the observed lack of crystalline silicates in the ISM.
We conclude that effectively all silicates in the diffuse interstellar medium become amorphous on a very short time scale, compared to the total residence time in the diffuse ISM. Hence, the crystalline silicates found in the circumstellar environments of young stars, in the solar system and in star formation regions have not survived the ISM unaltered, but are probably crystallized locally. Both annealing as well as evaporation and subsequent condensation seem to be significant crystallization processes.
References
- Arendt et al. (1999) Arendt, R. G., Dwek, E., & Moseley, S. H. 1999, ApJ, 521, 234
- Baganoff et al. (2003) Baganoff, F. K., Maeda, Y., Morris, M., et al. 2003, ApJ, 591, 891
- Barlow (1998) Barlow, M. J. 1998, Ap&SS, 255, 315
- Becklin et al. (1978) Becklin, E. E., Matthews, K., Neugebauer, G., & Willner, S. P. 1978, ApJ, 219, 121
- Bevington & Robinson (1992) Bevington, P. R. & Robinson, D. K. 1992, Data reduction and error analysis for the physical sciences (second edition) (New York: McGraw-Hill)
- Bohren & Huffman (1983) Bohren, C. F. & Huffman, D. R. 1983, Absorption and scattering of light by small particles (New York: Wiley)
- Borg et al. (1980) Borg, J., Chaumont, J., Jouret, C., Langevin, Y., & Maurette, M. 1980, in Proc. Conf. Ancient Sun, ed. R. O. Pepin, J. A. Eddy, & R. B. Merrill, 431–461
- Bouwman et al. (2001) Bouwman, J., Meeus, G., de Koter, A., et al. 2001, A&A, 375, 950
- Bowey & Adamson (2002) Bowey, J. E. & Adamson, A. J. 2002, MNRAS, 334, 94
- Bradley (1994) Bradley, J. P. 1994, Science, 265, 925
- Bringa & Johnson (2002) Bringa, E. M. & Johnson, R. E. 2002, Nuclear Instruments and Methods in Physics Research B, 193, 365
- Bringa & Johnson (2004) —. 2004, ApJ, 603, 159
- Brucato et al. (2003) Brucato, J. R., Strazzulla, G., Baratta, G., & Colangeli, L. 2003, A&A, 413, 395
- Carrez et al. (2002) Carrez, P., Demyk, K., Cordier, P., et al. 2002, Meteoritics and Planetary Science, 37, 1599
- Cesarsky et al. (2000) Cesarsky, D., Jones, A. P., Lequeux, J., & Verstraete, L. 2000, A&A, 358, 708
- Chiar et al. (1998) Chiar, J. E., Pendleton, Y. J., Geballe, T. R., & Tielens, A. G. G. M. 1998, ApJ, 507, 281
- Chiar et al. (2001) Chiar, J. E., Tielens, A. G. G. M., Whittet, D. C. B., et al. 2001, ApJ, 537, 749
- Chihara et al. (2003) Chihara, H., Koike, C., & Tsuchiyama, A. 2003, in Astrophysics of Dust, Estes Park, Colorado, May 26 - 30, 2003. Edited by Adolf N. Witt.
- Day (1974) Day, K. L. 1974, ApJ, 192, L15
- Day (1977) —. 1977, MNRAS, 178, 49P
- de Graauw et al. (1996) de Graauw, T., Haser, L. N., Beintema, D. A., et al. 1996, A&A, 315, L49
- Demyk et al. (2001) Demyk, K., Carrez, P., Leroux, H., et al. 2001, A&A, 368, L38
- Demyk et al. (2000) Demyk, K., Dartois, E., Wiesemeyer, H., et al. 2000, in ISO beyond the peaks: The 2nd ISO workshop on analytical spectroscopy, ESA-SP 456, 183–187
- Demyk et al. (1999) Demyk, K., Jones, A. P., Dartois, E., Cox, P., & d’Hendecourt, L. 1999, A&A, 349, 267
- Dorschner et al. (1995) Dorschner, J., Begemann, B., Henning, T., Jäger, C., & Mutschke, H. 1995, A&A, 300, 503
- Draine (2003) Draine, B. T. 2003, ARA&A, 41, 241
- Draine & Tan (2003) Draine, B. T. & Tan, J. C. 2003, ApJ, 594, 347
- Dunne et al. (2003) Dunne, L., Eales, S., Ivison, R., Morgan, H., & Edmunds, M. 2003, Nature, 424, 285
- Dwek (2004) Dwek, E. 2004, ApJ, in press
- Figer et al. (1999) Figer, D. F., McLean, I. S., & Morris, M. 1999, ApJ, 514, 202
- Fouks & Schubert (1995) Fouks, B. I. & Schubert, J. 1995, Proc. SPIE, 2475, 487
- Habing (1996) Habing, H. 1996, A&A Rev., 7, 97
- Honda et al. (2003) Honda, M., Kataza, H., Okamoto, Y. K., et al. 2003, ApJ, 585, L59
- Iatì et al. (2001) Iatì, M. A., Cecchi-Pestellini, C., Williams, D. A., et al. 2001, MNRAS, 322, 749
- Jäger et al. (2003a) Jäger, C., Dorschner, J., Mutschke, H., Posch, T., & Henning, T. 2003a, A&A, 408, 193
- Jäger et al. (2003b) Jäger, C., Fabian, D., Schrempel, F., et al. 2003b, A&A, 401, 57
- Jones et al. (1996) Jones, A. P., Tielens, A. G. G. M., & Hollenbach, D. J. 1996, ApJ, 469, 740
- Jones et al. (1994) Jones, A. P., Tielens, A. G. G. M., Hollenbach, D. J., & McKee, C. F. 1994, ApJ, 433, 797
- Jura & Kleinmann (1989) Jura, M. & Kleinmann, S. G. 1989, ApJ, 341, 359
- Jura & Kleinmann (1990) —. 1990, ApJS, 73, 769
- Keller & McKay (1993) Keller, L. P. & McKay, D. S. 1993, Science, 261, 1305
- Keller & McKay (1997) —. 1997, Geochim. Cosmochim. Acta, 61, 2331
- Kemper et al. (2002) Kemper, F., Jäger, C., Waters, L. B. F. M., et al. 2002, Nature, 415, 295
- Kemper et al. (2001) Kemper, F., Waters, L. B. F. M., de Koter, A., & Tielens, A. G. G. M. 2001, A&A, 369, 132
- Kessler et al. (1996) Kessler, M. F., Steinz, J. A., Anderegg, M. E., et al. 1996, A&A, 315, L27
- Kester (2003) Kester, D. J. M. 2003, in ESA SP-481: The Calibration Legacy of the ISO Mission, 243
- Knacke et al. (1993) Knacke, R. F., Fajardo-Acosta, S. B., Telesco, C. M., et al. 1993, ApJ, 418, 440
- Koike et al. (2000) Koike, C., Tsuchiyama, A., Shibai, H., et al. 2000, A&A, 363, 1115
- Koike et al. (1999) Koike, C., Tsuchiyama, A., & Suto, H. 1999, in Proc. 32nd ISAS Lunar Planet. Symp., 175–178
- Laor & Draine (1993) Laor, A. & Draine, B. T. 1993, ApJ, 402, 441
- Leech et al. (2003) Leech, K., Kester, D., Shipman, R., et al., eds. 2003, The ISO Handbook, Volume V: SWS - The Short Wavelength Spectrometer
- Li & Draine (2001) Li, A. & Draine, B. T. 2001, ApJ, 550, L213
- Lutz et al. (1996) Lutz, D., Feuchtgruber, H., Genzel, R., et al. 1996, A&A, 315, L269
- Mathis (1998) Mathis, J. S. 1998, ApJ, 497, 824
- Mathis et al. (1977) Mathis, J. S., Rumpl, W., & Nordsieck, K. H. 1977, ApJ, 217, 425
- Meeus et al. (2001) Meeus, G., Waters, L. B. F. M., Bouwman, J., et al. 2001, A&A, 365, 476
- Messenger et al. (2003) Messenger, S., Keller, L. P., Stadermann, F. J., Walker, R. M., & Zinner, E. 2003, Science, 300, 105
- Molster et al. (2002) Molster, F. J., Waters, L. B. F. M., Tielens, A. G. G. M., & Barlow, M. J. 2002, A&A, 382, 184
- Molster et al. (1999) Molster, F. J., Waters, L. B. F. M., Trams, N. R., et al. 1999, A&A, 350, 163
- Moneti et al. (2001) Moneti, A., Stolovy, S., Blommaert, J. A. D. L., Figer, D. F., & Najaro, F. 2001, A&A, 366, 106
- Morgan et al. (2003) Morgan, H. L., Dunne, L., Eales, S. A., Ivison, R. J., & Edmunds, M. G. 2003, ApJ, 597, L33
- Onaka & Okada (2003) Onaka, T. & Okada, Y. 2003, ApJ, 585, 872
- Pendleton et al. (1994) Pendleton, Y. J., Sandford, S. A., Allamandola, L. J., Tielens, A. G. G. M., & Sellgren, K. 1994, ApJ, 437, 683
- Press et al. (1992) Press, W. H., Teukolsky, S. A., Vetterling, W. T., & Flannery, B. P. 1992, Numerical recipes in Fortran 77 (second edition) (Cambridge University Press)
- Rieke et al. (1989) Rieke, G. H., Rieke, M. J., & Paul, A. E. 1989, ApJ, 336, 752
- Roche & Aitken (1984) Roche, P. F. & Aitken, D. K. 1984, MNRAS, 208, 481
- Roche & Aitken (1985) —. 1985, MNRAS, 215, 425
- Sofia et al. (1994) Sofia, U. J., Cardelli, J. A., & Savage, B. D. 1994, ApJ, 430, 650
- Speck et al. (1999) Speck, A. K., Hofmeister, A. M., & Barlow, M. J. 1999, ApJ, 513, L87
- Tanner et al. (2002) Tanner, A., Ghez, A. M., Morris, M., et al. 2002, ApJ, 575, 860
- Tielens (1998) Tielens, A. G. G. M. 1998, ApJ, 499, 267
- Tielens et al. (1996) Tielens, A. G. G. M., Wooden, D. H., Allamandola, L. J., Bregman, J., & Witteborn, F. C. 1996, ApJ, 461, 210
- Todini & Ferrara (2001) Todini, P. & Ferrara, A. 2001, MNRAS, 325, 726
- Vriend (1999) Vriend, W. J. 1999, Master’s thesis, Kapteijn Institute, Groningen University, The Netherlands
- Waelkens et al. (1996) Waelkens, C., Waters, L. B. F. M., de Graauw, M. S., et al. 1996, A&A, 315, L245
- Wang et al. (1998) Wang, S. X., Wang, L. M., Ewing, R. C., & Doremus, R. H. 1998, J. Non-Cryst. Solids, 238, 198
- Waters et al. (1996) Waters, L. B. F. M., Molster, F. J., de Jong, T., et al. 1996, A&A, 315, L361
- Wefel (1988) Wefel, J. P. 1988, in Genesis and propagation of cosmic rays, ed. M. M. Shapiro & J. P. Wefel (D. Reidel Publishing Company), 1–40
- Whittet (2003) Whittet, D. C. B. 2003, Dust in the galactic environment (second edition) (London: Institute of Physics Publishing)
- Whittet et al. (1990) Whittet, D. C. B., Duley, W. W., & Martin, P. G. 1990, MNRAS, 244, 427
- Witt et al. (2001) Witt, A. N., Smith, R. K., & Dwek, E. 2001, ApJ, 550, L201
- Wooden (2002) Wooden, D. H. 2002, Earth, Moon Planets, 89, 247


| object | (J2000) | (J2000) | AOT | speed | (s) | obs. date |
|---|---|---|---|---|---|---|
| Sgr A∗ | 17 45 40.0 | 29 00 29 | 1 | 4 | 6528 | 19-feb-96 |
| GCS 3 | 17 46 14.8 | 28 49 34 | 1 | 3 | 3454 | 29-aug-96 |
| GCS 4 | 17 46 15.7 | 28 49 47 | 1 | 3 | 3454 | 8-sep-96 |
| initial | add | oliv. | pyr. | forst. | diop. | c-enst. | o-enst. | |||
|---|---|---|---|---|---|---|---|---|---|---|
| amorph. | – | – | 69.9 | – | 84.9% | 15.1% | – | – | – | – |
| amorph. | forsterite | 40007 | 44.5 | 900 | 82.7% | 17.1% | 0.2% | – | – | – |
| amorph. | diopside | 11024 | 62.9 | 175 | 84.3% | 15.4% | – | 0.3% | – | – |
| amorph. | clino-enst. | 0 | – | 0 | – | – | – | – | – | – |
| amorph. | ortho-enst. | 552 | 69.6 | 7.9 | 84.7% | 15.2% | – | – | – | 0.07% |
| am. + forst. | diopside | 139 | 44.4 | 3.1 | 82.7% | 17.1% | 0.2% | 0.03% | – | – |
| 0.0 | 70 | – |
| 0.1 | 56 | 396 |
| 0.2 | 51 | 549 |
| 0.3 | 58 | 338 |
| 0.4 | 72 | 0 |
| 0.5 | 96 | 0 |
| 0.7 | 168 | 0 |
| 1.0 | 331 | 0 |
| 1.5 | 723 | 0 |
| 2.0 | 1231 | 0 |
| 3.0 | 2470 | 0 |
| type of star | (kpc-2) | ( yr-1) | ( yr-1 kpc-2) | ( )/ | |
|---|---|---|---|---|---|
| Miras | 11.4a,b | 10-9 | 40%d | 0.2% | |
| OH/IR stars | 1.1a,b | 10-6 | 10%d | 4–5% | |
| M Supergiants | 1–2c | 10-6 | 15–20%e | 7–13% | |
| Supernovae | n/a | n/a | ? | f | ? |