Modelling the Spectral Energy Distribution of Compact Luminous Infrared Galaxies: Constraints from High Frequency Radio Data
We have performed 23 GHz VLA observations of 7 compact, luminous infrared galaxies, selected to have evidence of starburst activity. New and published multi–frequency data are combined to obtain the spectral energy distributions of all 7 galaxies from the near–infrared to the radio (at 1.4 GHz). These SEDs are compared with new models, for dust enshrouded galaxies, which account for both starburst and AGN components.
In all 7 galaxies the starburst provides the dominant contribution to the infrared luminosity; in 4 sources no contribution from an AGN is required. Although AGN may contribute up to 50 percent of the total far–infrared emission, the starbursts always dominate in the radio. The SEDs of most of our sources are best fit with a very high optical depth of at .
The scatter in the far–infrared/radio correlation, found among luminous IRAS sources, is due mainly to the different evolutionary status of their starburst components. The short time–scale of the star formation process amplifies the delay between the far–infrared and radio emission. This becomes more evident at low radio frequencies (below about 1 GHz) where synchrotron radiation is the dominant process. In the far–infrared (at wavelengths shorter than 100 m) an additional source of scatter is provided by AGN, where present. AGN may be detected in the near–infrared by the absence of the knee, typical of stellar photospheres. However, near–infrared data alone cannot constrain the level at which AGN contribute because the interpretation of their observed properties, in this wave–band, depends strongly on model parameters.
Key Words.:
– Interstellar medium: dust extinction – Galaxies: stellar content – Infrared: galaxies – Radio continuum: galaxies1 Introduction
One of the most intriguing aspects of IRAS galaxies (Soifer et al., 1984, Sanders & Mirabel 1996), characterized by their extremely cool emission (peaking between 60 and ), is the origin of their high luminosities, often exceeding . In such galaxies it is clear that we observe radiation from dust at temperatures of a few 10s of Kelvin. However, the question of whether the heat source is baryonic nuclear processing in young stars, or accretion of baryons onto a central black hole is still debated. Recent evidence (e.g. Ferrarese 2002) that all spheroids harbour a central black hole, suggested by the existence of a tight correlation between the masses of black holes and the spheroidal components, implies that there may be a relationship between these two processes. The evidence that almost all ultra luminous IRAS sources (ULIRGs) exhibit signatures of on-going or recent interaction, suggests that the triggering mechanism is dynamical interaction.
Several questions remain:
-
1.
What are the relative fractions of mass going into star formation and accretion respectively?
-
2.
How tight is the link between star formation and nuclear activity? And is there any causal link between the two processes?
-
3.
How important is the role of mutual feedback in the termination of these processes?
The answers to these questions take on greater importance if, as deduced by deep ISO and sub–millimetric surveys (e.g. Franceschini et al., 2001, 2003; Elbaz et al., 2002; Smail et al., 2000; Barger et al., 2000), ULIRGs are the local counterparts of a larger population of luminous galaxies at redshifts z.
Recent spectroscopic determinations of the redshift of SCUBA sources (Smail et al., 2003) confirm that these objects have extreme luminosities. If these luminosities were due to starburst episodes (accounting for possible magnification by gravitational lensing), they would correspond to star formation rates (SFRs) in excess of several thousand M⊙/yr. If these extreme SFRs were maintained over a dynamical timescale, a spheroidal component of a typical L∗ galaxy could be assembled.
Both star formation and nuclear activity can be significant sources of energy feedback into the interstellar and intergalactic media – galactic winds and re-ionization respectively (e.g. Granato et al., 2001; Granato et al., 2003). The latter mechanism is one of the most important, if least understood, ingredients in current models of galaxy formation (Cavaliere, Lapi & Menci, 2002).
Bressan, Silva & Granato (2002) showed that comparison of the radio and far–infrared (FIR) emission may provide an accurate diagnostic for the study of the star formation history during the strong starburst phase characteristic of compact ULIRGs. By means of new starburst models they were able to show that deviations from the FIR/radio correlation could be used to derive the evolutionary status of the starburst. These deviations are expected in bursts of short duration because at early times (a few ) even the most massive stars formed in the burst will not have ended their lives as supernovae and no excess synchrotron emission should result from the starburst activity. Such starbursts would be relatively strong FIR emitters. Another important signature of a young starburst is its radio slope; as young starbursts are not yet dominated by synchrotron radiation from supernovae their radio slope should be flatter than , due to the large free-free component from ionized gas.
Bressan, Silva & Granato’s (2002) ability to derive the radio slope of objects in Condon’s (1991) sample of compact ULIRGs was limited by their use of existing radiometry at (which may be affected by free-free absorption). Moreover, they did not attempt to perform a complete fit to the complete SED of the galaxies, nor did they account for the effects of the AGN in the infrared.
The new fluxes presented here allow for both the determination of the radio spectrum, unaffected by free-free absorption, and place a useful constraint on the level of free-free emission. The combination of radio data with IRAS fluxes at 60 and provides a strong constraint on the age of starburst activity. FIR data below are sensitive to the contribution of AGN, which may then be estimated as the excess above the starburst component.
By studying local ULIRGs we can probe all of the important physical mechanisms involved in the formation of spheroidal systems: dynamical interaction; the triggering of star formation; QSO activation and, perhaps most important, feedback. In this paper we present new observations of 7 compact ULIRGs. With these new data and existing archival photometry/radiometry, we study their star formation history and possible AGN contributions.
Source selection is briefly discussed in Section 2, corresponding observations are presented in Section 3. In Section 4 we describe the procedure used to obtain the flux measurements of the observed sources while in Section 5 we present the data. In Section 6 we present starburst and AGN models adopted to fit the SEDs of the observed galaxies. Discussion of the results and conclusions are given in Sections 7 and 8, respectively.
| Source | log LFIR | |||||||||
| Name | / mJy | / mJy | / mJy | - | /mJy | /mJy | /mJy | /mJy | /mJy | L⊙ |
| (1) | (2) | (3) | (4) | (5) | (6) | (7) | (8) | (9) | (10) | |
| NGC0034 | … | 2.52 | 360 | 2380 | 16080 | 16970 | … | 11.54 | ||
| CGCG436-30 | 21.5 | 2.46 | 270 | 1410 | 10720 | 9600 | 11.77 | |||
| IRAS01364-1042 | … | 2.67 | 430 | 6530 | 7000 | … | 11.93 | |||
| IRAS08572+3915 | … | 3.11 | 340 | 1840 | 7660 | 5060 | 12.24 | |||
| NGC7469 | 2.29 | 1488 | 5430 | 25740 | 32466 | 11.68 | ||||
| IC5298 | 13.9 | 2.65 | 288 | 1690 | 7880 | 10480 | 11.61 | |||
| UGC12812 | 31.1 | 2.51 | 492 | 2470 | 16710 | 20130 | 11.54 |
(1): NVSS 1.4 GHz flux densities Condon et al. (1998); ∗ FIRST 1.4 GHz flux densities Becker et al. (1995); (2): Sopp & Alexander (1992); (3): Condon et al.’s (1991) total 8.44 GHz source flux densities, † main component flux density, †† indicates a relatively uncertain flux density due to surrounding diffuse emission. Errors in the 8.44 GHz fluxes were estimated from the observational parameters given in Condon et al. using the method described in Section 5.1 (4): logarithmic far infrared to 1.4 GHz luminosity ratio as defined by Condon et al. (1991); (5), (6), (7) & (8): IRAS-BGS flux densities (Soifer et al., 1989); (9): SCUBA flux densities Dunne et al. (2000); (10) far infrared luminosity in the range .
2 Sample Selection
Sources were selected from Condon et al.’s (1991) catalogue of compact ULIRGs. These, in turn, are a sub–set of sources in the Revised IRAS Bright Galaxy Survey (Soifer et al., 1989). Objects in our sample were selected to have a ratio of FIR to luminosity . Such a ratio should, according to the starburst models of Bressan, Silva & Granato (2002), help ensure emission is dominated by a young starburst. All sources were required to be bright enough, at 8.44 GHz, to ensure a strong detection (estimated to be in excess of ) within a few minutes integration and to be grouped close enough in R.A. to enable the entire sample to be observed within a few hours at the VLA. NGC 7469 () was added as a well studied comparison source, which is known to contain a central AGN and a circumnuclear starbursting ring.
Integrated radio, FIR and sub-mm fluxes of the sources are presented in Table 1. Flux densities at were taken from either the FIRST, NVSS or Condon et al. (1990) catalogues, fluxes from Sopp & Alexander (1992) and fluxes from Condon et al. (1991). Integrated near–infrared (NIR) fluxes from the 2MASS archive (Jarrett et al., 2003) are shown in Table 2.
3 Observations
K–band () observations were made with the VLA in D–array on 2002 January , 0800–0900 LST and 2002 January , 2100–2400 LST. We used a bandwidth of . During our observations 18 antennae were fitted with new low–noise K–band receivers, the remaining 9 with old receivers. The estimated point source r.m.s. noise in a naturally weighted image was then where is the integration time in seconds. At the angular resolution of D–array is approximately 2.5 arcsec.
Pointing errors for the VLA antennae are known to significantly degrade the sensitivity of the instrument at high frequencies. In order to obtain the most accurate possible flux density measurements we fine–tuned the pointing accuracy using the procedure termed second order referenced pointing111http://www.aoc.nrao.edu/vla/html/refpt.shtml. At the start of both observing runs the pointing offset was determined for the flux calibrator in the sensitive X () band. The second–order pointing correction was determined at the normal observing frequency, . This pointing offset was applied to measurements of the phase calibrators and the same procedure followed to find accurate pointing corrections near to each source position. Finally these phase calibrator offsets were applied when pointing at the target source. Each source and its associated phase calibrator was observed for 4 (IRAS 0136-10, NGC 34, NGC 7469, IRAS 08572+39) or 5 (CGCG 436-030, UGC 12812, IC 5298) snapshots.
The choice of flux density calibrators was dictated by the available hour angle coverage: on January 3C147 (0542+498) and on January 3C48 (0137+331) were observed. Phase calibration sources were chosen from the subset of the NRAO VLA calibrator list222http://www.aoc.nrao.edu/gtaylor/csource.html with positions known to better than 2 mas. Each source was associated with the nearest calibrator with tabulated 15 and (2 and 0.7 cm) fluxes and designated P or S at both these frequencies, none had tabulated (1.3 cm) flux densities. (For a P class calibrator amplitude closure errors are expected to be 3 percent; for an S class calibrator in the range 3 to 10 percent).
| Source | J | H | Ks |
|---|---|---|---|
| Name | /mJy | /mJy | /mJy |
| NGC0034 | 50.81.2 | 66.81.8 | 62.31.8 |
| CGCG436-30 | 14.40.51 | 18.30.65 | 20.11.1 |
| IRAS01364-1042 | 4.110.35 | 5.130.48 | 5.130.58 |
| IRAS08572+3915∗ | 1.70.11 | 3.00.20 | 3.90.26 |
| NGC7469 | 144 3.3 | 205 4.8 | 1935.2 |
| IC5298 | 33.30.9 | 45.21.4 | 46.51.7 |
| UGC12812 | 56.90.9 | 72.31.4 | 74.51.7 |
∗ From Spinoglio et al. (1995)
| Source | Calibrator | S1 /mJy | S2 /mJy |
|---|---|---|---|
| 3C48 (0137+331) | 1117.4 | 1120.2 | |
| IRAS08572+39 | 3C147 (0542+498) | 1794.9 | 1799.0 |
| NGC0034 | 2358-103 | ||
| CGCG436 | 0121+118 | ||
| IRAS0136-10 | 0141-094 | ||
| IRAS08572+39 | 0927+390 | ||
| NGC7469 | 2320+052 | ||
| IC5298 | 2321+275 | ||
| UGC12812 | 2358+199 |
∗: Except IRAS08572+39;
S1: Flux density in the band centered at ;
S2: Flux density in the band centered at .
4 Data Reduction
4.1 Calibration & Editing
Rapid ionospheric/tropospheric phase instabilities, coupled with angular resolution capable of resolving structure in the calibration sources, demands particular care when reducing data in the band. Calibration and editing were performed within the NRAO data reduction package aips, following the method suggested for high frequency data obtained with the VLA (e.g. AIPS Cookbook Appendix D).
Data were loaded such that nominal sensitivities were used to give relative weight to data points and opacity and gain curve corrections were applied. Throughout calibration both data and their associated weights were calibrated. To avoid the effects associated with resolving the structure of the primary flux calibrators, clean component models (available via the VLA website333http://www.aoc.nrao.edu/vla/html/highfreq/), were used for both flux calibrators, 3C 147 and 3C 48, when solving for antenna–based phase and amplitude calibration solutions. Calibration solution intervals were made short (20 seconds) to account for rapidly varying atmospheric phases.
| Source | RA | Dec | |||
|---|---|---|---|---|---|
| (J2000) | /mas | /deg | /mJy | ||
| NGC0034 | 00 11 06.550 | -12 06 26.330 | 1424.07 | 179.587 | |
| CGCG436-30 | 01 20 02.722 | +14 21 42.940 | 1221.50 | -108.351 | |
| IRAS0136-10 | 01 38 52.870 | -10 27 11.700 | 108.37 | -90.993 | |
| IRAS0857+39 | 09 00 25.390 | +39 03 54.400 | 419.781 | -63.642 | |
| NGC7469 | 23 03 15.623 | +08 52 26.390 | 346.625 | -177.478 | |
| IC5298 | 23 16 00.690 | +25 33 24.200 | 337.614 | -136.246 | |
| UGC12812 | 23 51 26.802 | +20 35 09.870 | 831.105 | -59.125 | |
|
|
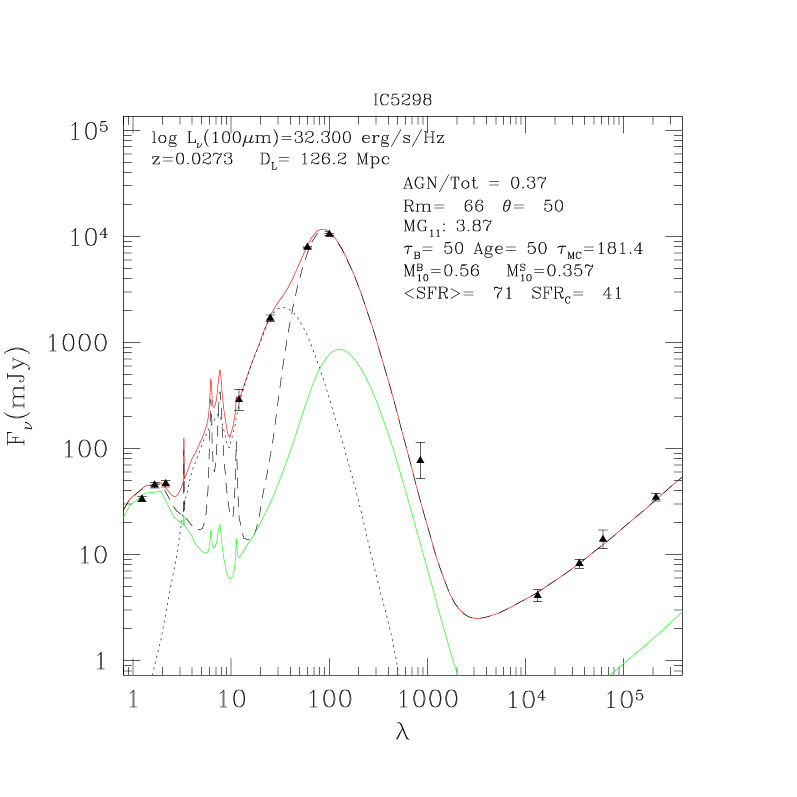
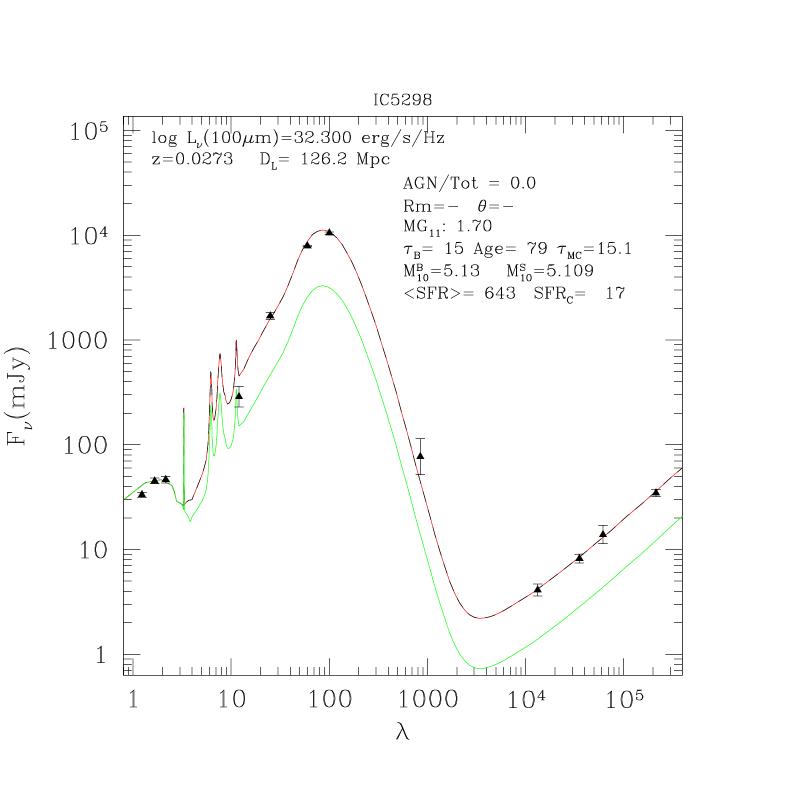
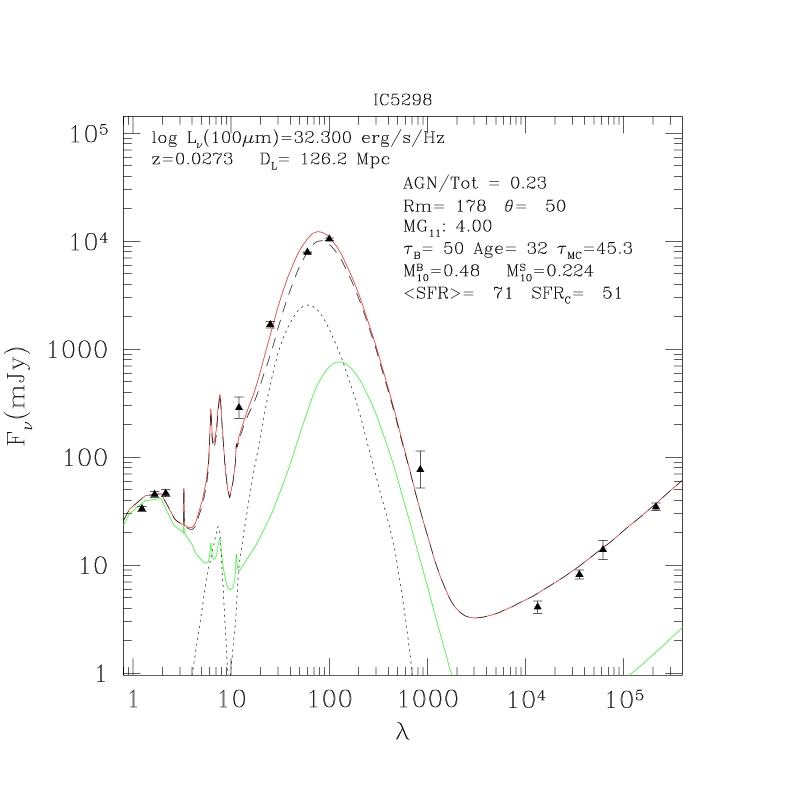
|
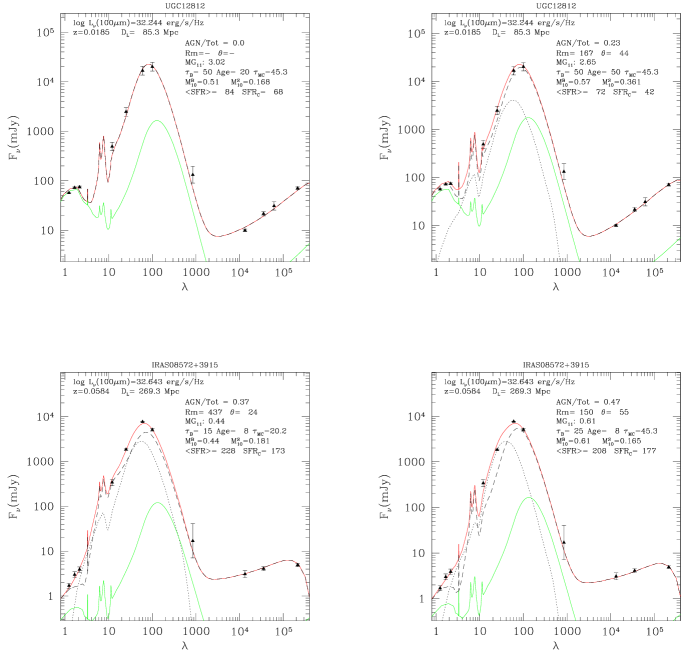
For other quantities reported in the figure see text. Left panel: without AGN component and small optical depth in molecular clouds, (a gas/dust ratio of 300 is required in this model). Middle panel: a fit with the AGN component and . Right panel: a fit with the AGN component and large optical depth in molecular clouds. Notice the large MBurst/MGal required by the model with small .
4.2 Mapping & Model-fitting
Mapping and model-fitting were carried out in a homogeneous manner within difmap (Shepherd 1997). Data were inverted onto a large map (1024 x 1024 pixels of 0.35 x 0.35 arcsec) the central quarter of which was cleaned (Högbom 1974) until the peak in the residual map (where here refers to the r.m.s. level of the residuals) and continued cleaning resulted in no further reduction in the residual level. For the stronger sources the data were then self–calibrated and re-cleaned until convergence. The data were re–mapped on to 512 x 512 pixels of side 0.35 arcsec and any further cleaning necessary was performed in a clean window just big enough to contain the high residuals surrounding the source position. When further cleaning resulted in no improvement in the reduction of the residual level, maps were restored.
Our maps show that, with the possible exception of NGC 7469, all sources are unresolved at an angular resolution of approximately 2.5 arcsec, as expected from the results of Condon et al. (1991). Flux densities were obtained directly from the restored maps and from modelling the sources in the visibility domain with difmap: modelfit. An initial model for the source was taken from the map; this consisted of its flux, major and minor axes, position angle, the radial distance and position angle of the source from the phase centre and the form (e.g. point–like or Gaussian). difmap: modelfit transforms the image plane model components into the u–v domain to enable a direct comparison of model visibilities with the observed, calibrated visibility data. A set of iterative adjustments were made to each of the model parameters to minimize the model’s –statistic. When successive iterations failed to provide an improvement and (where is the reduced –statistic) the iterations were halted. All fluxes presented in Table 4 are derived from source models with .
5 Results
5.1 Radiometry
The accuracy of our radiometry is critically dependent on the flux densities we determined for the calibration sources. In Table 3 we list the assumed flux densities of the flux calibrators (3C 48 and 3C 147) and the dependent measured fluxes of the phase calibrators. We note that, as expected, the phase calibrator with the worst determination of flux, 0927+390 (with flux density errors at the level of almost 1.5 percent), was that used on January 3 for source IRAS 08572+39.
The error estimates were calculated based on the assumption that the term due to measurement noise and that due to errors in gain calibration (and therefore proportional to the measured flux) may be added in quadrature. The first term was estimated by the noise in the background of the uniformly weighted map, the second by the fractional error in the associated phase calibrator’s flux density (Table 3). The phase calibrators were chosen to be near to the source and as opacity and gain curve corrections were performed on loading data into aips, no further dependence on zenith angle was considered.
| k | tinf | x | MLow | MUp | |
|---|---|---|---|---|---|
| 0.5 Gy-1 | 1 | 9 Gy | 1.35 | 0.15 M⊙ | 120 M⊙ |
We expect flux densities measured directly from visibility data to be more reliable than those determined from the map, being independent of imaging errors and of cleaning. These measured source flux densities are presented in Table 4. is the flux density determined from iteratively fitting model visibilities to the calibrated data as described above. Positions given in Table 4 refer to the phase centres and and to the radial offset and position angle (north through east) of the peak from the phase centre, as determined by the model–fitting procedure.
|
|
|
5.2 Comparing fluxes at different resolutions
It is important to note that data at different frequencies were obtained from observations at different resolutions and that all the radio data are from observations at much higher resolution than that of IRAS ( arcmin at ). For sources extended in the radio this could bias flux measurements at higher resolutions to lower values as flux becomes resolved out of interferometric maps. For the IRAS fluxes we also need to consider the potential of confusion with nearby sources. Using the maps of Condon et al. (1990) we find that all of our sources are smaller than arcsec diameter in the radio and often smaller than arcsec. Our observations will therefore not underestimate the fluxes in these objects because of their angular sizes. The only data for which resolution may be a problem are the VLA A-array observations at 8.4 GHz of Condon et al. (1991). These have a resolution of 0.25 arcsec and for the source NGC 7469 some flux is almost certainly not detected. The flux for this object is thus a lower limit, as indicated in Table 1.
We investigated the possibility of contamination of the IRAS fluxes by using NVSS images to look for sources sufficiently close to our target sources to cause confusion at . We then made use of the FIR/radio correlation to estimate the proportion of the IRAS flux contributed by the companion. The IRAS fluxes for 3 objects were thus estimated to have a small contribution (up to 10 percent) from a nearby source; these are the only three from our sample that show evidence of being resolved in the IRAS data of Soifer et al. (1989). The IRAS fluxes for these sources were reduced as follows. NGC 7469: 7 percent; IC 5298: 10 percent; UGC 12812: 3.5 percent. We note that these corrections are small and at least for the 12 and fluxes are of the same order as the errors on the fluxes.
6 Analysis of the spectral energy distribution
Observations of the spectral energy distribution from the FIR to the radio have been complemented by flux measurements in the NIR J, H and K bands by the Two Micron All Sky Survey (2MASS e.g. Jarrett et al., 2000). Berta et al., 2003 have convincingly shown that a J-K flux excess, over that expected from a pure starburst, is a strong indicator of the presence of an AGN. Further signature of the presence of an AGN comes from the dust temperature derived from fitting IRAS fluxes (eg. Sanders et al., 1988b). The contribution of an AGN in the radio is assumed to be zero (see Section 7) and we take the radio emission to be due entirely to star formation. We fit the spectral energy distribution with a combination of starburst models generated with the recent version of GRASIL (Silva et al. 1998, Bressan, Silva & Granato 2002), that includes radio emission from star forming regions, and AGN models generated with the radiative transfer code developed by Granato & Danese (1994).
6.1 Starburst models
The starburst model is described by the superposition of a burst of star formation on a quiescent disk. The SFR in the disk galaxy is obtained by an infall chemical evolution model with a Schmidt law and a Salpeter initial mass function (IMF) from 0.15 M⊙ to 120 M⊙.
The parameters of the chemical evolution models, i.e. the infall time-scale (tinf) and the SF law, SFR= are shown in Table 5.
At an epoch of 11.95 Gy the star formation rate is enhanced to mimic the burst. The intensity of the SFR is fixed by assuming that the mass of stars formed during the burst is a fraction of the underlying disk mass and by the e–folding time–scale taken to be = 10, 15, 25 or 50 My.
Half of the gas mass was assumed to be in the form of molecular clouds of , with the remaining gas distributed as a diffuse component. Stars form at the centre of these molecular clouds and suffer an extinction given by the cloud optical depth, . The obscuration time, t esc, was set to linearly decrease with time from down to a minimum of 3 My (characteristic of normal galaxies). Older stars are attenuated only by the diffuse component. The dust/gas ratio was selected to be 0.01. PAH features and temperature fluctuations of small grains were taken into account as described in Silva et al. (1998). Our main conclusions are not affected by the details of these parameters. However, since the mid infrared region (12 to ) is sensitive to the optical depth of the molecular clouds (), we considered three different values of 20, 45 and 180.
The ensemble of older stars, molecular clouds and diffuse component of the burst follow a spheroidal geometrical distribution (see Silva et al 1998 for more details).
6.2 AGN models
Dusty AGN SEDs were selected from libraries generated with the model of Granato & Danese (1994) and Granato, Danese & Franceschini (1997). Each library consists of several hundred cases, belonging to a given geometrical class, in which typically 4 to 5 parameters are varied, assigning 3 to 4 widely differing values to each. Libraries comprise both anisotropic flared discs and tapered discs (for definitions see for instance Efstathiou & Rowan-Robinson 1995). The effects of various parameters on the predicted SED have been explored in Granato & Danese (1994) and Granato et al. (1997). Also included in the libraries are models in which the size distribution of grains extend to radii larger than the standard value, as suggested for example by Maiolino et al. (2001a, b) and Galliano et al. (2003). We refer the reader to Galliano et al. (2003, in press) for a full description of these libraries.
6.3 Model Fitting
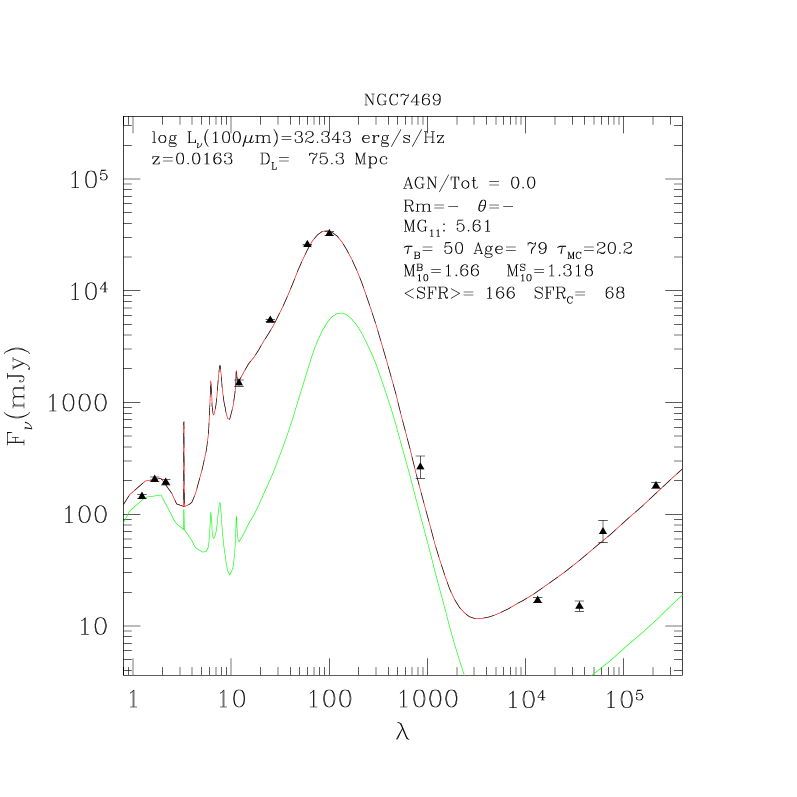
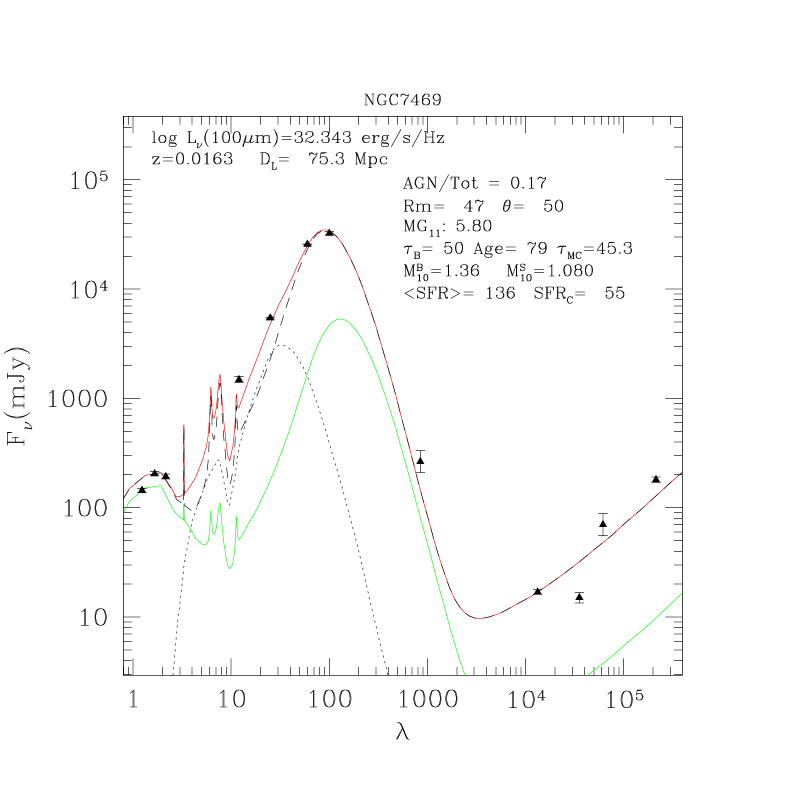
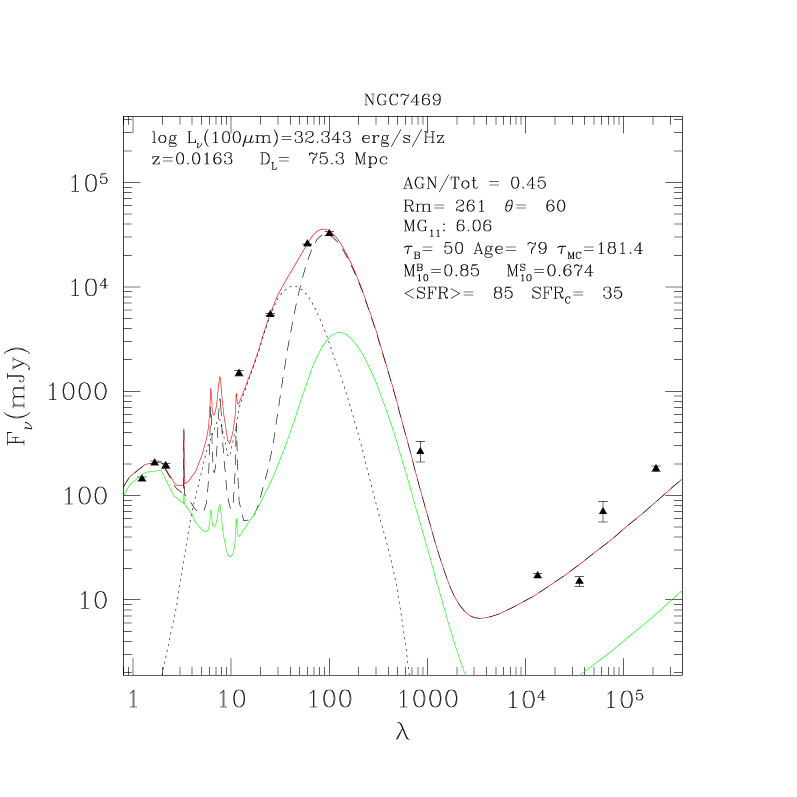
Model fits to the SEDs described above are shown in Figures 1 to 4; their parameters are shown in Table 6. Here is the total mass of gas and stars in units of 10; is the e-folding time of the SFR in units of 10y; is the current age of the burst in units of 10y; is the current mass in stars in units of 10M⊙; is the average SFR in units of M⊙/y over the lifetime of the burst; LAGN/LTot is the fractional contribution of the AGN to the total luminosity from 8 to ; and Rm are the inclination and the ratio of the external to internal radius of the torus, respectively. is the mass of the old disk, in units of 10, as determined by the fit to the NIR fluxes. It is worth noting that, when an AGN is present, and in particular when this is indicated by the shape of the SED in the NIR, must be considered an upper limit to the mass of the galaxy. This is because the AGN contributes flux in excess of that from the old stellar disk at NIR wavelengths.
is the current star formation rate derived from the of the modelled starburst spectrum. This is added as a comparison showing how the SFR might be estimated using one of the standard measures (Kennicutt, 1998). Kennicutt’s (1998) calibration was obtained from the ratio of the bolometric luminosity to SFR in a model of constant star formation over the last 100 My. Since it refers to a Salpeter IMF between and we have divided the values obtained with the Kennicutt relation by 1.16 to account for our different limits on the IMF (between and ).
Finally the last column reports the value of the merit function of the fit. The merit function is calculated as
| (1) |
where Mi, Oi and Ei are the model values, the observed values and the observational errors respectively, N is the number of passbands used for the fit.
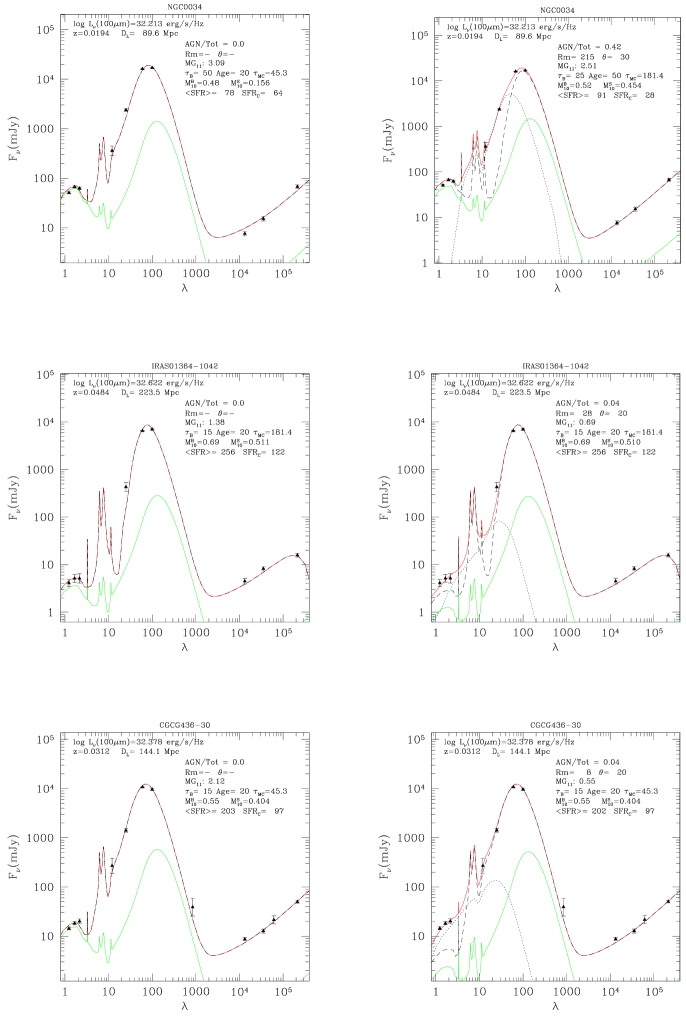
The models shown in Figures 1 to 4 result from the combined contribution (solid line) of a starburst model (dashed line) and an AGN model (dotted line). In the plots we also show the instantaneous, current star formation rate .
The starburst model includes the contribution of the underlying quiescent star forming disk. The spectral energy distribution of this disk is shown as the lower solid line. Its contribution to the total FIR and radio emission is negligible since its star formation rate amounts to only a few M⊙/yr while that of the starburst is, in general, an order of magnitude larger. However, due to the cooler temperature of the dust that characterizes the quiescent disk, its contribution to the sub-millimetre SED may be significant. This should serve as a warning against fitting the sub-millimetre SED of infrared sources with a single component starburst model. In the near–IR the old population of the disk always provides a significant contribution to the SED of the galaxy, in agreement with the results of Mayya et al. (2004).
7 Discussion
Almost since the discovery of the far-infrared/radio correlation it has been suspected that the scatter in the relation has a contribution from the delay between the infrared and radio emission during the star formation process (e.g. Helou, Soifer & Rowan-Robinson, 1985, Wunderlich & Klein, 1988). Bressan, Silva & Granato (2002) investigated this idea with a model in which the scatter in the value of , the FIR/radio ratio, in ULIRGs is caused by evolution i.e. the effect of an intense, short duration burst that is quenched rapidly. In particular, high values of , relative to the average for star forming galaxies, should be typical of young bursts because of the delay between FIR emission and radio emission. Moreover, a high value of should be associated with flat radio slopes because the radio emission in the early phases of the burst is dominated by free-free emission. This suggestion is generally confirmed by the present investigation. However, it is clear that this simple picture is complicated by the possible presence of AGN, which may contribute a significant fraction of the FIR luminosity shortward of .
Above , the FIR to radio SED provides fairly good constraints on the starburst component. In particular, flat radio slopes are associated with an excess of FIR flux with respect to the radio emission, in agreement with the predictions for young starburst models.
In fitting the model to the data we have neglected the possible contribution of an AGN at radio wavelengths. It has been shown, using VLBI observations of ULIRGs with compact radio cores (Smith et al., 1998), that the average value at of . These observations suggest that, in our sample, the AGN contribution in the radio is small.
Furthermore, the shape of the radio spectrum, both in objects with and without the signature of AGN contamination in the mid-IR, can be reproduced very well by starburst models.
If the contribution of the AGN were significant at radio frequencies the relative contributions of the starburst and AGN in the models would require fine tuning in order to reproduce the observed radio spectrum. In particular, it would be difficult to explain the variation of the radio slope as one moves from the synchrotron dominated (1.4GHz) to the free-free dominated (23GHz) regime.
It is also evident from our fits that the starburst almost entirely dominates the SED at , even when there is a strong contribution from the AGN to the total FIR luminosity.
The ratio between and radio fluxes is always well reproduced by starburst models. The presence of a radio–loud AGN will affect this ratio more than that between the total FIR and radio fluxes.
Thus, we argue that the contribution of the AGN at radio wavelengths must be small in our objects, 10%. This does not significantly modify our conclusions concerning the star formation history of the galaxy, if one considers that starburst radio fluxes change by about one order of magnitude from 1.4GHz to 23GHz.
Whether this is a common characteristic of the compact ULIRGs remains to be investigated by extending our method to the whole sample of Condon et al. (1991).
Observations close to are decisive because they significantly extend the frequency range that is not affected by free-free absorption. Condon et al. (1991) have argued that radio fluxes in compact ULIRGs may be affected by free-free absorption. Furthermore, Bressan, Silva & Granato (2002) have shown that this effect may be mistaken for evolution, i.e. a shallower radio slope determined from the radio flux may result either from free-free absorption or a younger sturburst.
Between and synchrotron emission fades by about an order of magnitude, disclosing the thermal emission from ionized gas, which is a more direct tracer of the ongoing star formation.
Since thermal and non-thermal radio emission appear in proportions that are dictated by the recent history of star formation, observations of the SED over such a wide range of frequencies prove to be essential for the determination of the burst parameters.
To clarify this point, figure 5 depicts the fractional contribution of free-free emission to the total radio emission for different frequencies as a function of the burst parameters: age and SFR decay–time in our models. Free-free emission from ionized HII regions always provides a significant contribution to the flux, being less than 50 percent only during the late evolution of the burst, when the radio emission is dominated by supernovae from less massive stars. At lower frequencies not only does the fractional contribution decrease but during the early phases of the burst it does not provide 100 percent of the radio emission, as may be expected, due to the supernova emission of the old stellar disk.
For bursts younger than 20 My more than half of the flux is contributed by free-free emission from HII regions, while at ages 10 My this fraction rises to 80 percent. Estimates of the ionizing photon flux (and therefore the SFR) based on the free-free emission may be affected by uncertainties in the fraction of ionizing photons lost by internal dust or escape (which can be as large as 30 percent, Panuzzo et al., 2003) but they are independent of the uncertainties that affect synchrotron emission. Effects such as the strength of the magnetic field and inverse Compton cooling on the strong radiation field of the starburst are discussed in Bressan, Silva & Granato (2002).

In three sources, NGC0034, IRAS01364-1042 and IRAS08572+3915 the determination of the burst parameters would not be possible without high frequency observations. Moreover in IRAS01364-1042 and IRAS08572+3915 the data allow us to conclude that the fluxes are affected by significant free-free absorption. In all other galaxies the observation unambiguously fixes the thermal contribution and then the age of the starburst.
Thus, the combination of accurate radio measurements with FIR data provides a good estimate of the relative contributions of the AGN and the starburst.
In some cases, the presence of an AGN is revealed by the NIR colours showing the shape of a typical, dominantly power–law spectrum, instead of the knee–dominated starburst spectrum. However, by means of these colours alone it is not possible to constrain the fractional contribution of the AGN, because the colours are a function of the torus model (optical depth, inclination etc.)
In summary, we find that all the compact ULIRGs in our sample are associated with strong, young bursts of star formation. The SF rates, averaged over the age of the burst, exceed /y. Typical total gas masses involved in the bursts are around 10 and the mass of stars formed so far is between 10 and 40 percent of this mass.
7.1 High optical depths
Our models generally require a large molecular cloud optical depth at 1 m, typically , but values as high as are necessary for IRAS 01364-1042. One might ask whether or not such high values are reasonable. Remembering that the extinction within our molecular clouds has a foreground screen geometry, an optical depth of 50 corresponds to an extinction of 54 mag. Assuming the Galactic interstellar extinction curve (Whittet, 1992) this implies a visual extinction . A corresponding total neutral ISM column density can be derived from the empirical relation of Bohlin et al. (1978) for sight-lines to reddened stars in the Galaxy. Again assuming the Galactic extinction curve we find where is the total neutral ISM column density in atomic and molecular gas. Several studies have measured the molecular gas column densities towards the centres of luminous and ultraluminous infrared sources using interferometric CO data (e.g. Downes & Solomon, 1998; Scoville et al., 1989; Sanders et al., 1988a). Peak column densities of are commonly found. The column density of the atomic gas has also been measured for those sources that show HI absorption (e.g., Mundell, Ferruit & Pedlar, 2001; Beswick et al., 2003; Clemens & Alexander, 2003) and for an assumed spin temperature of , peak column densities of are found. The column density of gas implied by our extinction measurements are therefore quite consistent with measured values for similar, extreme objects. In addition to these measurements of the gaseous ISM, which indirectly constrain the extinction, there have recently been direct measurements which make use of mid-infrared spectral features. Haas et al. (2001) find an extinction of for Arp 220 by comparing the PAH feature with the continuum flux and Soifer et al. (2002) find values of using spectroscopy of the absorption line. Values of are therefore quite reasonable and values 3 times higher should not be excluded.
| Name | LAGN/L | Rm | F | |||||||||
|---|---|---|---|---|---|---|---|---|---|---|---|---|
| NGC0034 | 0.48 | 50 | 20 | 0.156 | 78 | 45.3 | - | - | - | 3.08 | 47 | 29.3 |
| NGC0034 | 0.52 | 25 | 50 | 0.454 | 91 | 181.4 | 0.42 | 30 | 215 | 2.51 | 30 | 6.19 |
| CGCG436-30 | 0.55 | 15 | 20 | 0.404 | 203 | 45.3 | - | - | - | 1.89 | 87 | 83.2 |
| CGCG436-30 | 0.55 | 15 | 20 | 0.404 | 202 | 45.3 | 0.04 | 20 | 8.5 | 0.55 | 87 | 5.57 |
| IRAS01364-1042 | 0.69 | 15 | 20 | 0.511 | 256 | 181.4 | - | - | - | 1.38 | 110 | 13.2 |
| IRAS01364-1042 | 0.69 | 15 | 20 | 0.510 | 256 | 181.4 | 0.04 | 20 | 27.5 | 0.69 | 110 | 4.27 |
| IRAS08572+3915 | 0.44 | 15 | 8 | 0.181 | 228 | 20.2 | 0.37 | 24 | 436 | 0.44 | 145 | 6.97 |
| IRAS08572+3915 | 0.61 | 25 | 8 | 0.165 | 208 | 45.3 | 0.47 | 55 | 150 | 0.61 | 127 | 26.8 |
| NGC7469 | 1.66 | 50 | 79 | 1.318 | 166 | 20.2 | - | - | - | 5.61 | 65 | 31.4 |
| NGC7469 | 1.36 | 50 | 79 | 1.080 | 136 | 45.3 | 0.17 | 50 | 47 | 5.80 | 53 | 53.2 |
| NGC7469 | 0.85 | 50 | 79 | 0.674 | 85 | 181.4 | 0.45 | 60 | 260 | 6.05 | 38 | 103.0 |
| IC5298h | 5.13 | 15 | 79 | 5.109 | 643 | 15.1 | - | - | - | 1.96 | 64 | 12.1 |
| IC5298 | 0.48 | 50 | 32 | 0.224 | 71 | 45.3 | 0.23 | 50 | 178 | 3.99 | 48 | 29.4 |
| IC5298 | 0.56 | 50 | 50 | 0.357 | 71 | 181.4 | 0.36 | 50 | 66 | 3.86 | 40 | 1.96 |
| UGC12812 | 0.51 | 50 | 20 | 0.168 | 84 | 45.3 | - | - | - | 3.02 | 50 | 7.52 |
| UGC12812 | 0.57 | 50 | 20 | 0.361 | 72 | 45.3 | 0.23 | 44 | 167 | 2.64 | 41 | 2.51 |
(a) Total mass of gas & stars in units of 10M⊙; (b) time in 10 y; (c) Current mass in stars in units of ; (d) Average SFR in units of M⊙/y; (e) Luminosity integrated from 8m to (f) Total mass of the galaxy in units of ; (g) SFR calculated from the derived from the modelled starburst component; (h) gas/dust ratio = 300
7.2 Notes on Individual Sources
NGC 34 (MRK 0938): The presence of two nuclei separated by approximately 1.2 arcsec in the mid-infrared (Miles et al., 1996) and optical tidal tails indicate this galaxy is undergoing a merger (e.g. Mulchaey, Wilson & Tsvetanov 1996). The nature of the activity has been controversial, some authors (e.g. Véron–Cetty & Véron 1991) claiming a Seyfert 2 nucleus, while others suggest a composite spectrum. Mulchaey, Wilson & Tsvetanov’s (1996) emission–line images show the galaxy to be a weak emitter of [OIII] when compared with Seyfert galaxies in their sample. In addition they argue its strong emission, distributed over the entire galaxy, as indicative of a starburst.
A fit with no AGN component is marginally consistent with the radio data. On the other hand, a large ( 40 percent) AGN contribution to the luminosity is obtained by assuming . In this case the AGN is quite dust enshrouded and the spectrum falls off rapidly in the NIR. It is interesting to note that, in both cases, the average SFR during the burst is of the order of /y.
CGCG 436-30: This galaxy is almost certainly interacting and is detected in HI in both emission and absorption; the deduced atomic gas mass is greater than and must be concentrated near the core in order to explain the absorption feature (Mirabel & Sanders 1988).
There is evidence of a compact radio core that may be difficult to explain as an ensemble of young supernovae associated with the starburst; the major contribution to the FIR and radio emission originates on larger spatial scales (Lonsdale, Smith, & Lonsdale, 1993; Smith, Lonsdale, & Lonsdale 1998).
The monotonically rising NIR fluxes require a small AGN contribution but all measured fluxes longward of can be fitted with a pure starburst.
Our best fit SEDs, with or without the AGN component, indicate a gas consumption time–scale of about 15 My and a starburst age of 20 My. The total mass involved in the burst is and the residual gas mass . The average SFR /y.
An upper limit to the mass of the galaxy is provided by the fit of the NIR fluxes in the model without the AGN component.
IRAS 0136-1042: The relatively low flux at requires a large value of (181 in Fig. 2). As for CGCG 436-30, the NIR could require a small (4 percent) AGN contribution, but the overall fit is also compatible with that of a pure starburst.
An upper limit to the mass of the galaxy is provided by the fit of the NIR fluxes in the model without the AGN component.
IRAS 0857+3915: Consists of two nuclei separated by arcsec. It is the north-west component which dominates in both the infrared and radio (Sanders et al., 1988b; Condon et al., 1991). Surace & Sanders (2000) found evidence for stars no older than 100 My and despite the warm IRAS colours Veilleux, Sanders & Kim (1999) found no clear evidence for the presence of an AGN from NIR spectroscopy.
We fail to obtain a fit to the radio–100 and 12-60 data simultaneously with a starburst model alone. As expected from the J, H and K fluxes a significant AGN component is required. Radio data themselves are well fitted by a starburst model, if one assumes 0.7 at 1.4 GHz (ie. significant free-free absorption). The AGN component is large and L/L () ranges from 37 to 47 percent, in the case of a small or a large , respectively.
The total mass involved in the burst and the residual gas mass . The average star formation rate /y and the recent star formation history is essentially fixed by the shape of the SED from the radio to .
IRAS 0857+3915 is the only source common to both our study and the more extended sample of ULIRGs analysed by Farrah et al. (2003). Our estimate of the AGN contribution to the total FIR luminosity (Table 6), is in very good agreement with their quoted value ( 34%), despite their analysis being based on entirely different models (which make no use of the radio measurements). Using radio data we are able to provide a more accurate quantification of the starburst parameters. Our derived age is 8 Myr versus Farrah et al.’s upper limit of 57 Myr and our average SFR is 228 M⊙/yr against their quoted value of 173 M⊙/yr. (Distance effects and IMF effects almost cancel out since our luminosity is 17% higher and our IMF limits imply a 16% lower total mass). As anticipated, the observation allows the determination of significant free-free absorption at , an important source of scatter around the FIR/Radio correlation, not included in the analysis of Farrah et al. (2003).
NGC 7469: This source is thought to have a Sy 1.2 nucleus and a circumnuclear starburst. Using high resolution mid-infrared observations, Soifer et al. (2003) argued that the central source is an AGN rather than a nuclear starburst because of its very high surface brightness. Miles, Houck & Hayward (1994) and Nikolic et al. (2003) both found that PAH features in the mid-infrared spectrum, thought to trace star formation, are found in the ring of emission surrounding the nucleus but not in the nucleus itself. If the hard ionizing photons from the AGN destroy PAH molecules this supports the picture of a central AGN surrounded by a starburst ring.
Our best fit model has . At mid-infrared wavelengths we predict the AGN and starburst contributions to both be significant. This is the only source in our sample for which spatially resolved mid-infrared data are available, and in this case our model prediction is consistent with these data. A larger contribution from the AGN is inconsistent with the mid-infrared observations mentioned above, which show that significant flux comes from both the starburst ring and the AGN. A larger AGN fraction is also not consistent with the simultaneous fit of the FIR and radio data.
IC 5298: Our best fit model has , a very high optical depth for the molecular clouds, and an average SFR of /y.
Wu et al. (1998a,b) found that IC 5298 has properties that are intermediate between H II regions and liners; it was classified as a Seyfert 2 by Veilleux et al. (1995) although the [O I] lines are rather weak. Poggianti & Wu (2000) classify this galaxy as e(a) type, namely with H in emission with moderate equivalent with (52Å) and H in absorption (4Å). They derived a SFR of about /y from the FIR emission.
Molecular gas observations indicate a gas mass of while H I observations suggest an atomic gas mass of (Mirabel & Sanders 1988).
Our best fit models indicate a total gas mass of about 5.6 10, of which half is assumed to in the form of molecular clouds. About 63 percent of the gas has been converted into stars by the present epoch.
A fit to the SED of IC 5298 is also possible without the inclusion of the AGN component by assuming a small optical depth for the molecular clouds, . This is achieved by decreasing the dust to gas ratio to 1/300. In this case the best fit to the FIR and radio data require that about 25 percent of the mass of the galaxy is formed during a short intense burst; this galaxy is actually a post–starburst galaxy.
UGC 12812 (MRK 0331): Observational data show evidence of both starburst (e.g. Lancon, Rocca-Volmerange & Thuan, 1996; Veilleux et al., 1995; Roche et al., 1991) and AGN (Lonsdale, Smith & Lonsdale, 1993) activity.
The observation indicates a relatively low thermal contribution, hence a relatively old starburst, the model also requires a mild AGN contribution to fit IRAS data. A younger model, not requiring the AGN contribution, is marginally compatible with the observation.
Our fits indicate a fair upper limit to the contribution of the AGN of about 23 percent of the total luminosity. The average SFR is between 72 and /y, for the case with and without an AGN respectively.
8 Conclusions
We have performed new high frequency VLA radio measurements () of 7 compact ULIRGs chosen from Condon et al.’s (1991) sample. We have combined the new observational data with existing data at other radio frequencies (1.4 GHz, 5.4 GHz, 8.4 GHz); in the millimetre; from SCUBA ; infrared IRAS 100, 60 25, bands and in the NIR with J, H and K band observations from 2MASS.
We fit the global SEDs by means of a combination of new AGN and starburst models. We find:
-
1.
The high frequency radio data have proven essential for the determination of the relative contribution of the star-burst and the AGN. Although AGN can be detected in several ways (such as via their hard X-ray emission, near-infrared colours or optical line emission), quantifying the energy contribution of the AGN to the bolometric luminosity of the source requires an evaluation of the starburst power. On one hand, the new radio observations at allow a clean definition (unaffected by free-free absorption) of the shape of radio emission over a wide range of frequencies. On the other, the flux at is mostly contributed (50 percent) by free-free emission from ionized HII regions and is therefore directly related to ongoing star formation. The flux at lower frequencies is instead sensitive to the supernova rate and thus carries information about the previous history of the starburst.
-
2.
We have found that radio data, together with the flux define almost unequivocally the recent star formation history of the burst. This confirms the suggestion by Bressan, Silva & Granato 2002, that combining FIR and Radio data provides a fine resolution age determination, for these obscured sources.
-
3.
While the starburst contribution is generally well constrained by the SED longward of , the SED below is sensitive to the contribution from the hot dust of the AGN. Thus, the excess emission above the starburst contribution at 12, 25 and may be used to quantify the contribution from the AGN. A degree of uncertainty remains regarding the strength of the AGN. Low optical depth in molecular clouds favours warm emission from the starburst, thus a smaller contibution from AGN is required to fit the mid-infrared data. However, as the emission from the starburst gets warmer, its contribution at decreases and to fit this data point a larger SFR is required; eventually becoming incompatible with the radio data. Thus, while still affected by uncertainties, the method we propose proves to be useful in providing an estimate of the relative contribution of AGN and starburst.
-
4.
The effect of the AGN is also visible from the total J, H and K fluxes but its quantification is impossible from these NIR colours alone because of the strong dependence of the AGN emission on the model parameters at these wavelengths.
-
5.
It is possible to fit the SEDs of most of the sources in our sample with no contribution from an AGN. However, better fits, especially for the near infrared colours, are obtained when the bolometric luminosity has a small AGN contribution. We note that Farrah et al. (2003), who fitted the SEDs of ULIRGs with template spectra, find that in general the starburst contributions dominante.
-
6.
To fit the mid-infrared data a very high optical depth at 1 micron is generally required. In the most extreme case, IRAS01364-1042, the SED cannot be fit unless . Although we cannot do an object by object comparison, values as high as at least 50 are consistent with gas column densities measured in the centre of ULIRGs. The fact that extinction measurements at shorter wavelengths give much lower values probably indicates that such observations penetrate only a surface layer of the ISM and do not probe the whole sight-line towards the central energy source.
Acknowledgements.
We thank Greg Taylor, Claire Chandler and Ylva Pihlstroem for invaluable advice regarding the observations and data reduction. A.B. and G.L.G. acknowledge warm hospitality by INAOE and discussions with I. Aretxaga, O. Vega, D. Hughes, T.N. Rengarajan and R. Terlevich. We thank the referee, M. Rowan-Robinson, for useful suggestions. This research was partially supported by the European Commission Research Training Network ‘POE’ under contract HPRN-CT-2000-00138 and by the Italian Ministry for University and Research (MURST) under grant Cofin 92001021149-002. The National Radio Astronomy Observatory is a facility of the National Science Foundation operated under cooperative agreement by Associated Universities, Inc. This publication makes use of data products from the Two Micron All Sky Survey, which is a joint project of the University of Massachusetts and the Infrared Processing and Analysis Center/California Institute of Technology, funded by the National Aeronautics and Space Administration and the National Science Foundation.References
- (1) Becker, R.H., White, R.L., Hefland, D.J. 1995, ApJ, 450, 559
- (2) Barger, A.J., Cowie L.L., Richards, E.A. 2000, AJ, 119, 2092
- (3) Beswick R.J., Pedlar A., Clemens M.S., Alexander P., 2003, MNRAS, 346, 424
- (4) Berta S., Fritz J., Franceschini A., Bressan A., Pernechele, C., 2003, A&A, 403, 119
- (5) Bohlin R.C., Savage B.D., Drake J.F., 1978, ApJ, 224, 132
- (6) Bressan, A., Silva, L., Granato, G.L. 2002, A&A, 392, 377
- Cavaliere, Lapi, & Menci (2002) Cavaliere, A., Lapi, A., Menci, N. 2002, ApJ, 581, L1
- (8) Clemens M.S., Alexander P., 2003, RMxAC, 17, 87
- (9) Condon, J.J., Helou, G., Sanders, D.B., Soifer, B.T. 1990, ApJS, 73, 359
- (10) Condon, J.J., Huang, Z.P., Yin, Q.F., Thuan, T.X. 1991, ApJ, 378, 65
- (11) Condon, J.J., Frayer, D.T., Broderick, J.J. 1991, AJ, 101, 362
- (12) Condon, J.J., Cotton, W.D., Greisen, E.W., Yin, Q.F., Perley, R.A., Taylor, G.B., Broderick, J.J. 1998, AJ, 115, 1693
- (13) Downes D., Solomon P.M., 1998, ApJ, 507, 615 1984, ApJ, 285, 89
- (14) Dunne. L., Eales, S., Edmunds, M., Ivison, R., Alexander, P., Clements, D.L. 2000, MNRAS, 315, 115
- (15) Elbaz D., Cesarsky C.J., Chanial P., Aussel H., Franceschini A., Fadda D., Chary R.R., 2002, A&A, 384, 848
- Efstathiou & Rowan-Robinson (1995) Efstathiou A., Rowan-Robinson M., 1995, MNRAS, 273, 649
- (17) Farrah D., Afonso J., Efstathiou A., Rowan-Robinson M., Fox M., Clements D., 2003, MNRAS, 343, 585
- Ferrarese (2002) Ferrarese, L. 2002, ApJ, 578, 90
- (19) Franceschini A., Berta S., Rigopoulou D., Aussel H., Cesarsky C.J., Elbaz D., Genzel R., Moy E., Oliver S., Rowan-Robinson M., Van der Werf, P.P. 2003, A&A, 403, 501
- (20) Franceschini A., Aussel H., Cesarsky C.J., Elbaz D., Fadda D., 2001, A&A, 378, 1
- Granato & Danese (1994) Granato, G. L. Danese, L. 1994, MNRAS, 268, 235
- Granato, Danese, & Franceschini (1997) Granato, G. L., Danese, L., Franceschini, A. 1997, ApJ, 486, 147
- (23) Granato, G. L., Silva, L., Monaco, P., Panuzzo, P., Salucci, P., De Zotti, G., Danese, L. 2001, MNRAS, 324, 757
- (24) Granato, G. L., De Zotti, G., Silva, L., Bressan, A., Danese, L. 2003, ApJ, in press
- (25) Haas M., Klaas, U., M ller S.A.H., Chini R., Coulson I., 2001, A&A, 367, L9
- (26) Helou G., Soifer B.T., Rowan-Robinson M., 1985, ApJ, 298, L7
- (27) Högbom, J. 1974, ApJS, 15, 417
- (28) Jarrett, T.H., Chester, T., Cutri, R., Schneider, S., Huchra, J. P., 2003, AJ, 125, 525
- (29) Kennicutt, R.C., 1998, ARA&A, 36, 189
- (30) Lancon A., Rocca-Volmerange B., Thuan T.X., 1996, A&AS, 115, 253
- (31) Lonsdale C.J., Smith H.J., Lonsdale C.J., 1993, ApJ, 405, L9
- Maiolino et al. (2001) Maiolino R., Marconi A., Salvati M., Risaliti G., Severgnini P., Oliva E., La Franca F., Vanzi L., 2001a, A&A, 365, 28
- Maiolino et al. (2001) Maiolino R., Marconi A., Oliva E., 2001b, A&A, 365, 37
- (34) Mayya, Y. D., Bressan, A., Rodríguez, M., Valdes, J. R., & Chavez, M. 2004, ApJ, 600, 188
- (35) Miles J.W., Houck J.R., Hayward T.L., 1994, ApJ, 425, L37
- (36) Miles, J., Houck, J., Hayward, T., Ashby, L. 1996, ApJ, 465, 191
- (37) Mirabel, I. F.; Sanders, D. B., 1988, ApJ, 335, 104
- (38) Mulchaey, J.S., Wilson, A.S., Tsvetanov, Z. 1996, ApJS, 102, 309
- (39) Mundell C.G., Ferruit P., Pedlar A., 2001, ApJ, 560, 168
- (40) Nikolic B., Alexander P., Cotter G., Longair M., Clemens M.S., 2003, Ap&SS, 284, 573
- (41) Panuzzo, P., Granato, G.L., Bressan, A., Silva, L. Danese, L., 2003, A&A, 409, 99
- Pier & Krolik (1993) Pier E. A., Krolik J. H., 1993, ApJ, 418, 673
- (43) Roche P.F., Aitken D.K., Smith C.H., Ward M.J., 1991, MNRAS, 248, 606
- (44) Sanders, D.B., Mirabel, I.F. 1996, ARA&A, 34, 749
- (45) Sanders D.B., Soifer B.T., Scoville N.Z., Sargent A.I., 1988a, ApJ, 324, L55
- Sanders et al. (1988) Sanders, D. B., Soifer, B. T., Elias, J. H., Neugebauer, G., Matthews, K. 1988b, ApJ, 328, L35
- (47) Scoville N.Z., Sanders D.B., Sargent A.I., Soifer B.T., Tinney C.G., 1989, ApJ, 345, L25
- (48) Shepherd, M.C. 1997, in ASP Conf. Ser. 125, Astronomical Data Analysis Software and Systems VI, ed. G. Hunt & H. E. Payne (San Francisco: ASP), 77
- Silva et al. (1998) Silva L., Granato G. L., Bressan A., Danese L., 1998, ApJ, 509, 103
- (50) Smail, I., Ivison, R.J., Owen, F.N., Blain, A.W., & Kneib, J.P. 2000, ApJ, 528, 612
- Smail et al. (2003) Smail, I., Ivison, R. J., Gilbank, D. G., Dunlop, J. S., Keel, W. C., Motohara, K., Stevens, J. A. 2003, ApJ, 583, 551
- (52) Smith, H.E., Lonsdale, C.J., Lonsdale, C.J. 1998, ApJ, 492, 137
- (53) Soifer, B. T.; Neugebauer, G.; Helou, G.; Lonsdale, C. J.; Hacking, P.; Rice, W.; Houck, J. R.; Low, F. J.; Rowan-Robinson, M., 1984, ApJ, 283, L1
- (54) Soifer, B.T., Boehmer, L., Neugebauer, G., Sanders, D.B. 1989, AJ, 98, 766
- (55) Soifer B.T., Neugebauer G., Matthews K., Egami E., Weinberger A.J., 2002, AJ, 124, 2980
- (56) Soifer B.T., Bock J.J., Marsh K., Neugebauer G., Matthews K., Egami E., Armus L., 2003, AJ, 126, 143
- (57) Sopp, H., Alexander, P. 1992, MNRAS, 259, 425
- (58) Spinoglio L., Malkan, M.A., Rush, B., Carrasco, L., Recillas-Cruz, E., 1995, ApJ, 453, 616
- (59) Veilleux, S., Sanders, D. B., Kim, D.-C., 1999, ApJ, 522, 139
- (60) Veilleux, S., Kim, D.-C., Sanders, D. B., Mazzarella, J. M., Soifer, B. T. 1995, ApJS, 98, 171
- (61) Véron–Cetty, M.P., Véron, P. 1991, ESO, Sci. Rep., 10
- (62) Whittet D.C.B., 1992, ‘Dust in the Galactic environment’, I.O.P. publishing Ltd.
- (63) Wunderlich E., Klein U., 1988, A&A, 206, 47