Spectral transitions in X-ray Binaries
Abstract
We systematically analyzed about a terabyte of data from Galactic binary systems to characterize how these spectra change as a function of mass accretion rate. With this volume of data we are able to identify the differences in behaviour of black holes and neutron stars, implying that black holes really do have an event horizon. The spectral evolution seen as a function of can be linked to current state-of-the-art numerical simulations of accretion flows, and we develop qualitative and quantitative models of the spectral changes in all types of binary systems. The key ingredient of this picture is that the major hard-soft spectral transition is driven by a changing inner radius of the accretion disc. This also qualitatively explains the changes seen in the variability power spectra of these objects. This lays the foundation for a self-consistent, theoretically motivated framework in which to explain both the spectral and timing properties of accreting compact objects.
1 Introduction
One of the key puzzles in X-ray astronomy is to understand accretion flows in a strong gravitational field. This applies to both Active Galactic Nuclei (AGN) and Quasars, where the accretion is onto a supermassive black hole, the puzzling ultraluminous compact sources which may be intermediate mass black holes, the stellar mass Galactic black holes (GBH) and even the neutron star systems. Neutron star radii are of order three Schwarzchild radii, i.e. the same as that for the last stable orbit of material around a black hole. Thus they have very similar gravitational potentials so should have very similar accretion flows, though of course with the major difference that neutron stars have a solid surface, so can have a boundary layer and a stellar magnetic field.
The main premise is that progress in understanding accretion in any of these objects should give us some pointers to understanding accretion in all of them. Galactic sources are intrinsically less luminous, but a great deal closer than the AGN, so generally are much brighter. Galactic black holes are also often generically transient, showing large variability on timescales from milliseconds to years. These give us a sequence of spectra at differing mass accretion rates onto the central object, allowing us to test accretion models.
2 Accretion Flows in Galactic Black Holes
Black holes are very simple objects, possessing only mass and spin. In steady state the appearance of the accretion flow should be completely determined by these parameters, together with the mass accretion rate and some weak dependence on inclination angle. Much of the dependence on mass can be removed by scaling the accretion rate to the Eddington accretion rate, as sources emitting at similar fractions of the Eddington luminosity, , should have similar accretion flows.
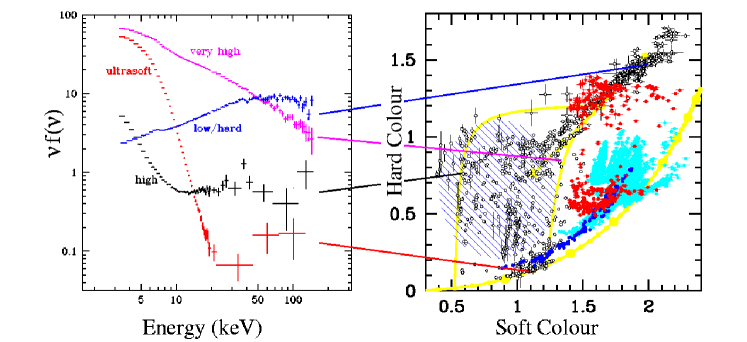
The best known solution for the accretion flow equations is the Shakura–Sunyaev optically thick disc[25], hereafter SS. Viscous stresses convert some of the gravitational potential energy to heat, producing a rather robust, quasi-blackbody spectrum, with temperature of keV for accretion rates around Eddington onto a GBH. Such spectra are seen, but are generally accompanied by a weak (ultrasoft state: US), moderate (high state: HS) or strong (very high state and intermediate state: VHS) X-ray tail to higher energies. Together these form the soft states, which are seen at high . However, at low these objects can also show spectra which look entirely unlike a disc, peaking instead at keV (low/hard states: LS). Fig. 1a shows representative spectra from all these GBH states[26].
To produce any emission at energies substantially higher than that of the disc requires that some fraction of the gravitational energy is dissipated in regions which are optically thin, so that a few electrons gain a large fraction of the energy. These energetic electrons can produce hard X-rays by Compton upscattering lower energy photons, and the shape of this spectrum is determined by the ratio of power in the hot electrons to that in the seed photons illuminating them, .
While such Comptonization models can explain the broad band spectral shapes, they do not address the underlying problem of the physical origin of the hot electrons, or indeed the range required to produce the very different spectra shown in Fig. 1a. We can get some insight into these more fundamental issues from recent advances in understanding the physical nature of the accretion disc viscosity as a magnetic dynamo[1]. Numerical simulations show that any seed magnetic field can be continuously amplified by the differential rotation of the disc material, and dissipated through reconnection events. Including radiative cooling gives an accretion disc structure which bears some resemblance to the standard accretion disc models, but with some of the magnetic reconnection occurring above the disc as magnetic field loops buoyantly rise to the surface, reconnecting above the bulk of the material in an optically thin environment[27][20].
However, these physical viscosity simulations also show that an alternative, non-disc solution exists where the whole accretion flow is optically thin, so cannot efficiently cool. The accretion flow forms a hot, geometrically thick structure, qualitatively similar to the Advection Dominated Accretion Flows[23], but considerably more complex in detail, with convection and outflow as well as advection[18].
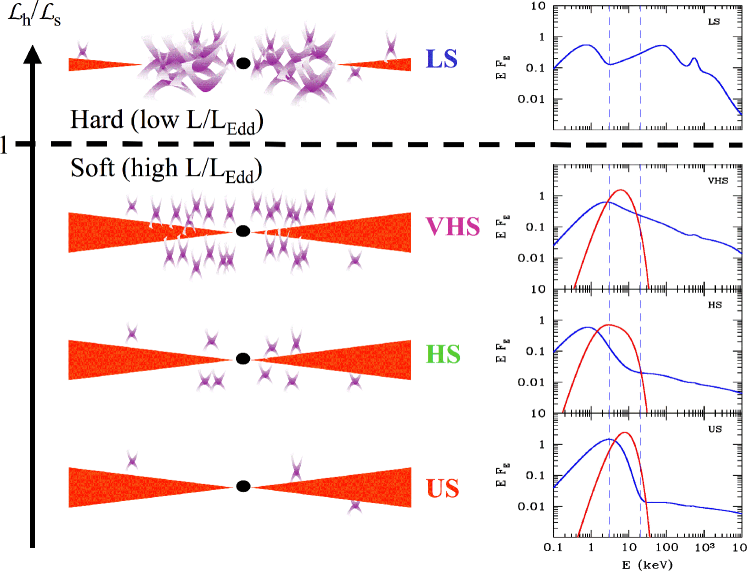
The existence of two very different accretion flow structures gives a very natural explanation for the two very different types of spectra seen from the GBH. At low the inner optically thick disc could be replaced by an optically thin flow. There are few photons from the disc which illuminate the flow, so and the Comptonized spectra are hard. When the mass accretion rate increases, the flow becomes optically thick, and collapses into an SS disc. The dramatic increase in disc flux drives the hard-soft state transition[10]. A weak tail on the dominant disc emission can be produced by occasional magnetic field loops buoyantly rising to the surface, reconnecting above the bulk of the material in an optically thin environment (US). Increasing the ratio of power dissipated above the surface to that in the disc increases , increasing the importance of the hard X-ray tail. However, the geometry of the soft states sets a limit to . Flares above a disc illuminate the disc surface, where some fraction are absorbed and thermalized. This adds to the intrinsic disc emission, fixing in the limit where the flares cover most of the disc surface[17], which always results in a soft Comptonized spectrum, forming a power law with energy index (VHS). Fig. 2 illustrates the geometries inferred for each state.
3 Spectral evolution as a function of luminosity for Black Holes
The previous section outlined a physically motivated model in which spectral changes (particularly the hard-soft spectral transition) are driven by a changing geometry. There now exists an enormous amount of data from the X-ray binary systems which can be used to test this. We looked at of order a terabyte of data from the RXTE satellite to systematically analyze all the available spectra from many black hole systems. Clearly, doing a detailed spectral analysis of so much data is impractical. Broad band ’colours’ have long been used in neutron star X-ray binaries to get an overview of source behaviour. The problem is that these colours are often defined using counts within a certain energy range, so are generally dependent on the instrument response, as well as on the absorbing column toward the source. We want to compare many different black holes, so instead use intrinsic colour, i.e. unabsorbed flux ratios over a given energy band. To do this we need a physical model. Plainly there can be emission from an accretion disc, together with a higher energy component from Comptonization. Reflection of this emission from the surface of the accretion disc can also contribute to the spectrum. Thus we use a model consisting of a multicolour accretion disc, Comptonized emission (which is not a power law at energies close to either the seed photon temperature or the mean electron energy), with Gaussian line and smeared edge to roughly model the reflected spectral features, together with galactic absorption.
We use this model to fit the RXTE PCA data from all available black holes which are not strongly affected by absorption cm-2. We choose 4 energy bands, 3-4 keV, 4-6.4 keV, 6.4-9.7 keV and 9.7-16 keV, and integrate the unabsorbed model over these ranges to form intrinsic colours, which roughly describe the intrinsic spectral slope (corrected for absorption and instrument response by model fitting) below and above 6 keV, respectively. We use the (generally) fairly well known distance to convert the extrapolated bolometric flux to total luminosity. Again, since the mass of the central object is fairly well known we can translate the bolometric luminosity into a fraction of the Eddington luminosity.
Fig. 1b shows all the data from many different black holes as a colour-colour diagram. All the black holes are consistent with the same spectral evolution as a function of increasing luminosity (scaled in terms of the Eddington luminosity, ) for 0.001–0.5. At low luminosity the spectra are hardest (with largest values of both soft and hard colours). As the luminosity increases the spectrum softens, forming a well defined diagonal track in the colour-colour plots. This expands into a much wider range colours for the soft states, where there is an amazing variety of spectral shapes for the same [8].
 |
 |
4 Accretion flows in neutron star binaries
Neutron stars without a strong magnetic field ( G) come in two flavors, named atolls and Z sources. Z sources are named after a Z-shaped track they produce on an X-ray colour-colour diagram, while atolls are named after their C (or atoll) shaped track. These differences between the two Low Mass X-ray Binary categories probably reflect differences in both mass accretion rate and magnetic field, , with the Z sources having high luminosity (typically more than 50 per cent of the Eddington limit) and magnetic field ( G) while the atolls have lower luminosity (generally less than 10 per cent of Eddington) and low magnetic field ( G) [16].
We repeat the intrinsic colour analysis for 4 different transient atoll systems spanning 0.001–0.5. These are plotted as the red points in Fig. 1b, and are all consistent with the same spectral evolution, forming a large, Z shaped track with increasing . The spectra at low luminosities are hard, resembling the black hole low/hard spectra[2], then as the luminosity increases the colours move horizontally to the right, then there is an abrupt transition, where both hard and soft colour decrease, forming the start of the lower branch of the Z (termed the banana branch). This hard-soft transition is plainly reminiscent of the black hole behaviour, but the atolls evolve very differently with on the colour-colour diagram.
Ironically, the atolls actually form a much more convincing Z shaped track on the colour-colour diagrams than the Z sources! The newly discovered upper branch of the Z in atolls is only seen at low luminosities, and transforms their C (or atoll) shape into a Z[13][22]. The Z sources (cyan points in Fig. 1b) form a much less coherent picture, with different Z sources having different colours rather than forming a single track despite all being at similar luminosities of , except for the odd source Cir X–1 (blue points) which spans .
Since we have calculated intrinsic colours, then not only can we compare many objects in a given class, we can also put the black holes and neutron star systems on the same diagram (Fig. 1b). The differences in the black hole and atoll tracks are then obvious, as is the fact that there are parts of the colour-colour diagram which are only occupied by black holes. This is not simply that the source shows soft colours, as it has long been known that Cir X-1 can show colours similar to those of the ultrasoft black hole spectra. However, no type of disc acceting neutron star even has colours similar to those of the classic high/soft spectra (Fig. 1a), where there is low temperature thermal emission from the disc together with a power law tail to much higher energies. The obvious interpretation is that there are physical, observable spectral differences due to the presence/absence of a solid surface[8].
5 Detailed modeling of the accretion flows in GBH and atolls
The colour-colour data shown in Fig. 1b can be qualitatively and quantitatively tied into the theoretical models of accretion flows discussed in §2. Taking the black holes first, if the inner disc is replaced by a hot flow at low then there are few seed photons from the disc so the spectrum is hard. As the mass accretion rate increases, the truncation radius of the disc decreases, so it penetrates further into the hot flow. A larger fraction of the disc photons are intercepted by the hot flow, increasing the Compton cooling. This steepens the Comptonized spectrum, but since this dominates the whole X-ray band then the whole spectrum softens, giving rise to the diagonal track on the colour-colour diagram. When the mass accretion rate is such that the hot flow starts to become optically thick then it collapses into a standard SS disc, abruptly softening the spectrum.
This schematic picture (see Fig. 2) can be translated into a quantitative model using the sophisticated Comptonization code, eqpair[7]. The key advantage of this code is that it does not assume the steady state electron distribution, rather it calculates it by balancing heating (injection of power into thermal and/or non-thermal electrons) and cooling processes (Compton cooling, which depends on , and Coulomb collisions). The resulting spectrum depends primarily on , i.e. on the geometry, and can have complex curvature in the Comptonized emission. This non-power law Comptonized continuum is required in order to fit broad bandpass individual spectra from all states (HS[12], VHS[31, 14], LS[32]).
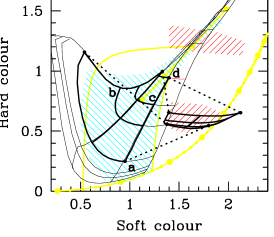
Fig. 3a shows a grid of colours resulting from the eqpair code for changing from 30 (top right of the diagonal branch) – 0.01 (softest hard colours), assuming seed photons from the disc at 0.3 – 1.2 keV as expected for the observed range in for a standard disc. Changing only these two physical parameters can describe all the spectra seen from the GBH. These model spectra for each state are shown by the blue lines in the right hand panel of Fig. 2, with the blue dotted lines showing the energy range of the PCA data over which the colours are measured[8].
|
The same models can also describe the disc accreting neutron stars but with the difference that there is a solid surface/boundary layer. Schematically, at low luminosity, the disc is truncated a long way from the neutron star, and the boundary layer is mostly optically thin, so it joins smoothly onto the emission from the inner accretion flow. Reprocessed photons from the X-ray illuminated surface form the seed photons for Compton cooling of the inner flow/boundary layer emission, so the PCA spectrum is dominated by this Comptonized component. As the mass accretion rate increases, the disc starts to move inward, but the cooling is dominated by seed photons from the neutron star rather than from the disc, so the geometry and hence the high energy spectral shape does not change. The atolls keep constant hard colour, but the soft colour increases as the seed photon energy moves into the PCA band. Eventually the mass accretion rate becomes high enough to make the inner flow/boundary layer become optically thick. This triggers the collapse of the inner flow into a standard disc, softening the spectrum at low energies, abruptly decreasing the soft colour. The boundary layer properties also change as it is now optically thick, so its cooling is dominated by quasi-blackbody rather than Compton processes. Since blackbody cooling is much more effective, the temperature of the boundary layer drops, softening the hard spectrum and decreasing its colour. Thus as the inner flow/boundary layer becomes optically thick this causes both the inner flow to change to a disc and the boundary layer emission to thermalize. This reduces both the hard and soft colours, so the track moves abruptly down and to the left during this transition. After this then increasing the mass accretion rate increases the disc temperature, so the track moves to higher soft colour[13][8]. The ’banana branch’ is then analogous to the high/soft state in the galactic black holes, but with additional luminosity from the boundary layer.
We can look at the quantitative predictions of the model for the high mass accretion rate atolls by simply adding optically thick emission from a boundary layer to the previous black hole eqpair models, as shown by the red lines on the spectra in Fig. 2. With this addition, the same eqpair model grid which gave a whole variety of soft state spectra for the black holes collapses into a well defined ’banana branch’ for the atoll systems (Fig. 3a)[8].
The similarity of topology on the colour-colour diagram of the atolls and Z sources again supports the truncated disc models. It has long been suggested that the jump between the upper and lower tracks of the Z in Z sources is formed by the interaction of the disc and magnetic field[19]. At the lower mass accretion rates the disc is truncated by the magnetic field, but as increases, the increasing ram pressure of the disc material finally overcomes the magnetic pressure, allowing the disc to penetrate to the neutron star surface. The high mass accretion rates mean that the inner flow/boundary layer is always optically thick, so these systems never show the hard spectra seen from upper branch of the Z in atolls. There are real physical differences between Z sources and atolls[24]. The topology of their tracks on the colour-colour diagram are both driven by the same changing geometry, but the mechanism causing the disc truncation is different.
6 GRS 1915+105
Even the pathologically strange source GRS 1915+105 can be fit into this picture. This black hole shows a unique variability behaviour in about 50% of the XTE data collected from this source, where the disc continually switches between being hot and bright with small inner disc radius to cooler and dimmer with much larger inner disc radius. This can be interpreted as resulting from a limit-cycle instability in the inner accretion disc, such that it is continually emptying and refilling[4][5].
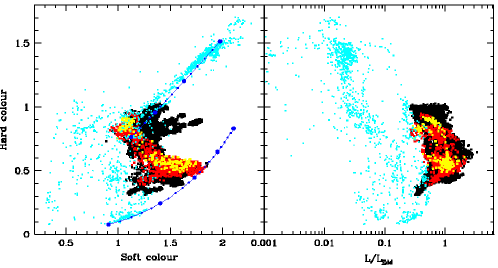
Fig. 3b and c shows the colours and inferred luminosity (assuming a distance of 12.5 kpc) for all the GRS1915+105 data in the XTE database. We fit each 128s spectra as before, including careful modeling of the heavy absorption[9]. Spectra taken from periods where the limit cycle variability is present are coloured red (most extreme, rms variability 60 %) and yellow (rms variability between 40–60 %). The cyan points mark the data from all the other ’normal’ black holes. It is plain that the instability occurs in only the most luminous spectra, those which have . The luminosity never drops below 0.3 , explaining why it never goes into the hard state (typically seen only at luminosities lower than a few percent of Eddington). It also explains why it never goes into the ‘black hole only’ area of the colour-colour diagram. Spectra in this region, characterized by a low-temperature disc component together with a weak hard tail, are seen predominantly around 0.1 . The persistently high luminosity of GRS1915+105 takes it above these low disc temperatures.
However, superEddington luminosity seems to be only a necessary, not sufficient condition for the disc instability. There are several low variability spectra from GRS1915+105 which exceed the Eddington limit, and there are several of the other black holes which reach comparable luminosities, but do not show the limit cycle. The colour-luminosity diagram for the ’normal’ black holes shows clearly that there is not a one-to-one relation between luminosity and spectral state. It seems that the spectral evolution is driven by the average mass accretion rate, not the instantaneous mass accretion rate as inferred from the X-ray luminosity. There is some much longer timescale in the system, presumably tied to the response of the disc and/or inner flow [28, 29].
GRS1915+105 is not in a separate class from ‘normal’ black holes. When it is at the same then its spectra and (more importantly) time variability behaviour are similar to that seen in the ’normal’ black holes. Its unique limit cycle variability is probably linked to the fact that it is the only black hole to radiate at high (super Eddington) luminosities for a sustained period of time.
7 Reflection and QPO’s
A truncated disc/inner hot flow model can explain the spectral evolution of all the different classes of low mass X-ray binaries. It is also consistent with results from detailed spectral fitting of individual, broad bandpass spectra. One of the best ways to track the disc is to look at the reflected line and continuum which results from X-ray illumination of the optically thick material. The amount of reflection and line show the solid angle subtended by the optically thick material, while the strength of relativistic smearing by special and general relativistic effects shows the extent to which the disc penetrates into the strong gravitational field[11].
All detailed fits to the low/hard state spectra in black holes are consistent with a rather smaller amount of reflection and relativistic smearing than would be expected for a disc which extends down to the last stable orbit at 3 Schwarzchild radii[15, 30, 3] More reflection and smearing are seen in high state spectra[12, 15, 21].
Models with a moving inner disc radius at low mass accretion rates also can qualitatively explain the variability power spectra of these sources, which show characteristic frequencies in the form both of breaks and Quasi Periodic Oscillations (QPO’s). These features are related ( for the low frequency QPO), and they move, with the frequencies generally being higher (indicating smaller size scales) at higher [28]. Recent progress has concentrated on the similarity between the relationship between the QPO and break frequencies in black holes and neutron star systems[28]. If they truly are the same phenomena then the mechanism must be connected to the accretion disc properties and not to the magnetosphere or surface of the neutron star. While the variability is not yet understood in detail, all QPO and break frequency models use a sharp transition in the accretion disc in some form to pick out a preferred timescale[28], so by far the easiest way to change these frequencies is to change the inner disc radius[6].
8 Conclusions
We can form a unified picture of the spectral evolution of all types of low mass X-ray binaries, where the major hard-soft spectral transition is driven by a changing inner disc radius linked to the collapse of an optically thin, hot inner flow. We see clear differences between the black holes and disc accreting neutron stars, both in the form of a unique black hole spectral signature (the high/soft state) and in terms of the evolution of their spectral shape with . These differences can be modeled qualitatively and quantitatively as the same accretion flow onto a different object: neutron stars have a surface so have a boundary layer, while black holes have an event horizon!
References
- [1] Balbus S.A., Hawley J., 1991, ApJ., 376, 214
- [2] Barret D., Vedrenne G., 1994, ApJS, 92, 505
- [3] Barrio F.E., Done C., Nayakshin S., 2003, MNRAS, 342, 557
- [4] Belloni T., Méndez M., King A. R., van der Klis M., van Paradijs J., 1997, ApJ, 488, L109
- [5] Belloni T., Klein-Wolt M., Méndez M., van der Klis M., van Paradijs J., 2000, A&A, 355, 271, B00
- [6] Churazov E., Gilfanov M., Revnivtsev M., 2001, MNRAS, 321, 759
- [7] Coppi P. S., 1999, in ASP Conf. Ser. 161, 375
- [8] Done C., Gierliński M., 2003, MNRAS, 342, 1041
- [9] Done C., Wardziński G., Gierliński M., 2004, MNRAS, in press
- [10] Esin A.A., McClintock J.E., Narayan R. 1997, ApJ, 489, 865
- [11] Fabian A.C., Iwasawa K., Reynolds C.S., Young A.J., 2000, PASP, 112, 1145
- [12] Gierliński M. et al., 1999, MNRAS, 309, 496
- [13] Gierliński M., Done C., 2002, MNRAS, 331, 47
- [14] Gierliński M., Done C., 2003, MNRAS, 342, 1083
- [15] Gilfanov M., Churazov E., Revnivtsev M., 1999, A& A, 352, 182
- [16] Hasinger G., van der Klis M., 1989, A&A, 225, 79
- [17] Haardt F., Maraschi L., 1993, ApJ, 413, 507
- [18] Hawley J.F., Balbus S.A., 2002, ApJ, 573, 738
- [19] Lamb F.K., 1991, in Neutron stars: theory and observation Eds J. Ventura & D. Pines, NATO ASI Series C 344, p445, Kulwer.
- [20] Miller K.A., Stone J.M., 2000, ApJ., 534, 398
- [21] Miller J., et al., 2004, ApJ., 601, 450
- [22] Muno M., Remillard R., Chakrabarty D., 2002, ApJ, 568, L35
- [23] Narayan R., Yi I., 1995, ApJ., 452, 710
- [24] Reig P., van Straaten S., van der Klis M., 2004, ApJ, 602, 918
- [25] Shakura, N.I., Sunyaev, R.A. 1973, A& A, 24, 337
- [26] Tanaka Y., Lewin W. H. G. 1995, in X–Ray Binaries, ed. W. H. G. Lewin, J. van Paradijs & E. van den Heuvel (Cambridge: Cambridge Univ. Press), 126
- [27] Turner, N., 2004, ApJL., in press (astro-ph/0402539)
- [28] van der Klis M., 2000, ARAA, 38, 717
- [29] van der Klis M., 2001, 2001, ApJ, 561, 943
- [30] Zdziarski A.A., Lubinski P., Smith D.A., 1999, MNRAS, 303, 11
- [31] Zdziarski A.A., et al., 2001, ApJ, 554, L45
- [32] Zdziarski A.A., Poutanen J., Paciesas W.S., Wen L., 2002, ApJ., 578, 357