The LEDA galaxy distribution : I. Maps of the Local Universe
In order to investigate the properties of large-scale structures of galaxies in the universe, we present an analysis of their spatial distribution at z0.033. We used the LEDA extragalactic database containing over 1 million of galaxies covering the all-sky and the SDSS data included in the public release DR1, yielding to a sample of around 134,000 galaxies having a measured redshift in two survey areas representing 690 sq. degrees. The results of the study are 2D, 3D maps and magnitude number counts of galaxies, drawn from B-band samples.
Key Words.:
large scale structures – galaxy – cosmology–1 Introduction
Angular and radial maps of the Local Universe are the first step for astronomers to investigate the nature of large scale structures observed in the galaxy distribution. An early discovery of a large scale structure was the ”great wall” of galaxies, in the CfA1 redshift survey Geller and Huchra (1989) and Huchra and Burg (1992). Building on this promising technique for tracing 3-D structures, deeper redshift surveys including: CfA2 Huchra et al. (1995), IRAS, LCRS, 2dF Colless et al. (2001), and SDSS Abazajian et al. (2003), all show new more extensive and complex structures such as walls, chains, voids, and superclusters. A related approach to quantify the complexity of the galaxy distribution is to construct the galaxy number counts in mag, N(m), and in distance, N(r), using statistical indicators: spatial and angular two-point correlation functions. Combining approaches, physical interpretation of these counts leads to the understanding of the nature of large scale structure, and to its cosmological implications for the models of formation of galaxies. Much attention is focused on the determination of the scale of homogeneity in the universe. It is not a trivial concern, some statistical indicators are interpreted as showing the scale of homogeneity to be as small as 15 Mpc; while the new redshift surveys show extended structures larger than 100 Mpc, dwarfing even cluster sized stucture. In this present paper, we will not directly address this issue, but instead focus on the nearby Universe, creating a global picture for the redshift and number count distribution of galaxies.
The paper is organized as follows : section 2 presents the data, the completness studies, the number counts and the construction of volume limited subsamples; section 3 shows the 2D and 3D maps of the Local Universe in various coordinates systems and preliminary comparison with SDSS DR1 and section 4 gives our conclusions.
2 Building the samples
2.1 The LEDA database
The Lyon-Meudon Extragalactic Database : LEDA, was the first database created in order to collect all published measurements on galaxies related to studies of the structure and kinematics of the Local Universe. On this purpose, the database is limited to galaxies closer than 60,000 . It was created by Georges Paturel in 1983 (see Paturel et al. (1997)) relaying the work of Gérard De Vaucouleurs and his famous RC1 and RC2 catalogs (de Vaucouleurs et al. (1976)). The RC3 catalog (de Vaucouleurs et al. (1991)) was made using the LEDA database. This archive has stimulated a large and varied number of studies, over 100 refereed papers, that address large scale structure and peculiar velocity flows. In the year 2000, the database galaxy number was increased to over 1 Million. And for the 20th anniversary of LEDA in 2003, completely new studies of the all-sky Local Universe are possible. One should insist on the fact that there is no other possibility to work with all-sky homogeneized magnitudes in a volume of . This is true for B selected surveys, however the 2MASS survey, was designed precisely to be a homogenized , allsky, uniform survey of galaxies (as well as the Milky Way). In the NIR, 2MASS is more complete than optical survey since it penetrates the Zone of Avoidance. One can see the spectacular results in the allsky data release (XSC: extended source catalog, see Cutri et al. (2003) and Jarrett et al. (2000)).
In all the paper we use H0=100 Mpc/km/s. The non-Beta-version of the DR1 of SDSS has been released in June 2003, and is simultaneously employed to discern the large scale structures in a slice of 600Mpc depth. The extinction correction on LEDA B magnitudes is now made according to Schlegel et al. (1998) since 2002 in LEDA. Hereafter we refer to these B total magnitudes corrected for galactic extinction as Btc magnitudes.
| data | number |
|---|---|
| galaxies | 1,316,143 |
| B magnitudes | 929,815 |
| radial velocities | 213,446 |
| HI width measurements | 51,621 |
2.2 Completness studies
In order to build representative maps of the Local Universe, we should first test the completness of the samples. In the case of the LEDA database, we compare the number counts in apparent magnitude in the B band. The magnitudes are corrected from galactic extinction, as notified before, and thus noted hereafter Btc. In the database there are about 930,000 galaxies with a measured B magnitude (hereafter photometric catalog), while 125,685 of them have also a measured redshift (hereafter redshift catalog).
Before testing the completness of the catalogs available in LEDA, we cut out the Zone of Avoidance (-15deg galactic latitude 15 deg). The Zone is woefully incomplete, so one would expect many galaxies to be missing (as well as galaxy clusters and superclusters, including the Great Attractor). Galactic extinction is accounted for in LEDA Btc magnitudes, but that really only works for the low extinction cases (Av 1). In the Galactic Plane the extinction is very patchy and is not always well traced with the Schlegel maps. So it is better for our studies of completness to cut this zone out.
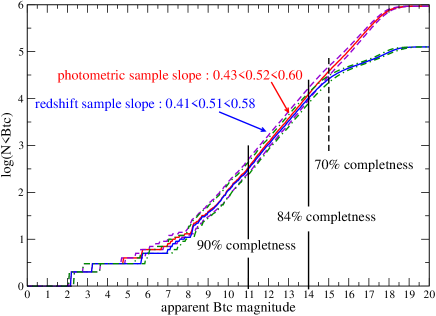
On Figure 1 we plot the magnitude number counts of the two subsamples : the ”photometric” one and the ”redshift” one. One can see that there is a linear growth of the number of galaxies with the tested volume. However the slopes are not following the 0.6m expected if the distribution of galaxies was homogeneous in the Local universe. For the photometric sample, the slope is 0.52 and for the redshift one it is 0.51. These slopes are measured only in the part where the incompleteness can be neglected. If we suppose that the photometric catalog is complete, then the redshift one contains 84% of the galaxies at Btc=14.5 and 90% at Btc=11.
In the literature there are various interpretations for the values of these slopes : local underdensity, fractal behaviour below the scale of homogeneity, incompletness of the low surface brightness galaxies. The studies of the SDSS data which are much deeper, showing a slope of 0.45 as we will see in a following paper, tends to cancel out the local underdensity explanation, or at least extend this local underdensity to scales of 600 Mpc depth. Recent surveys dedicated to low surface brightness galaxies tend to show that those galaxies are not present in large-scale voids nor in our vicinity. We can then neglect their effect on the magnitude number counts slopes. The departure from linearity of these slopes gives us the limit of completness of the samples. It is Btc=14.5 for the redshift catalog and Btc=17 for the photometric one. Knowing those limits we will be able to cut volume limited samples.
We did various tests to quantify the error on the magnitude number count slope due to the errors on the magnitudes. One can find previous studies of LEDA galaxy number counts in Di Nella et al. (1996) and Paturel et al. (1994). It is not the purpose of this paper to discuss deeply those counts, here we use them only in order to build representative samples of galaxies to allow a construction of a set of maps. We measured the slope in 3 cases taking into account an error on the magnitudes which is respectively zero, equal to the real error and the double of the real error. In this manner we check that the error has low influence on the slope of the magnitude number counts.On Figure 1 we wrote the smallest and the largest values of the slopes, we could obtain when accounting for the maximum of the error bars on each value of the magnitude.The errors on the magnitudes in LEDA are so large, that the error on the slope is about 0.09, so we can not totally exclude a slope of 0.6, in particular for the photometric catalog.
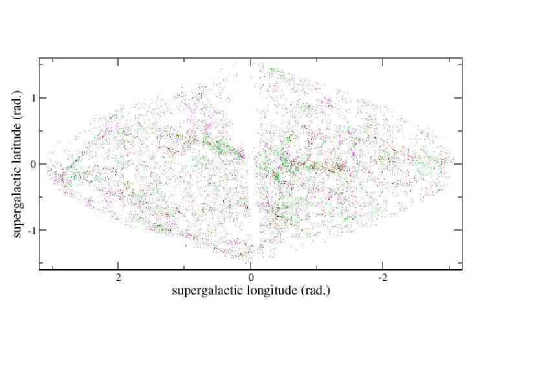
2.3 Volume limited subsamples
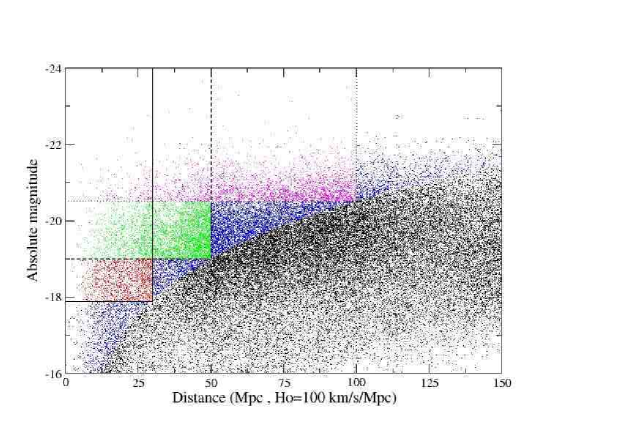
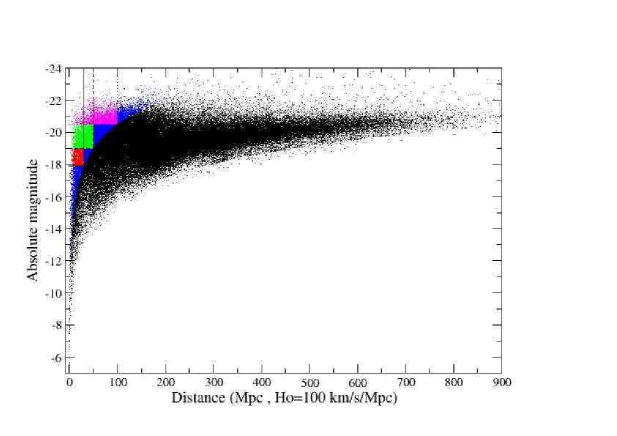
On Figures 2 and 3 we can see how the cut in apparent magnitude Btc 14.5 affects the redshift samples. From 125,685 galaxies (in black) we have now (in blue) only 16,906 galaxies left. Those samples have been observed with selections in apparent magnitude, thus they contain a wide variety of galaxies. The distribution in absolute magnitude within these samples is incomplete. They contain dwarf galaxies, normal galaxies and giant galaxies, but each of these classes is not complete. The apparent magnitude surveys do not contain all dwarf, all normal and all giant galaxies. In order to select only galaxies statistically representative, ie, having the same absolute magnitude, we apply a cut in distance and in absolute magnitude. We build three volume limited subsamples at 30 (red), 50 (green) and 100 (purple) Mpc. The number of galaxies left in those samples can be read from the table 2. As we go deeper with the volume limited samples, we select only luminous galaxies. However, one can see on figure 3 that the resulting number of galaxies in the deepest volume limited subsample at 100 Mpc contains only about 2% of the initial redshift catalog of 125,685 galaxies.
| lim. distance | lim. abs. magnitude | number of gal. |
|---|---|---|
| 30 Mpc | -17.9 | 2,504 |
| 50 Mpc | -19 | 4,434 |
| 100 Mpc | -20.5 | 2,814 |
3 Maps of the Local Universe
3.1 2D maps
On Figures 4, 5 and 6 we show angular maps of the Local Universe. They are Flamsteed projections in supergalactic coordinates. This method of representing an angular catalog has the advantage to be an ”equal area projection”, thus conserving the projected areas. But of course, as any projection, there are deformations effects near the poles (up and bottom of the figures) and all along the sides.
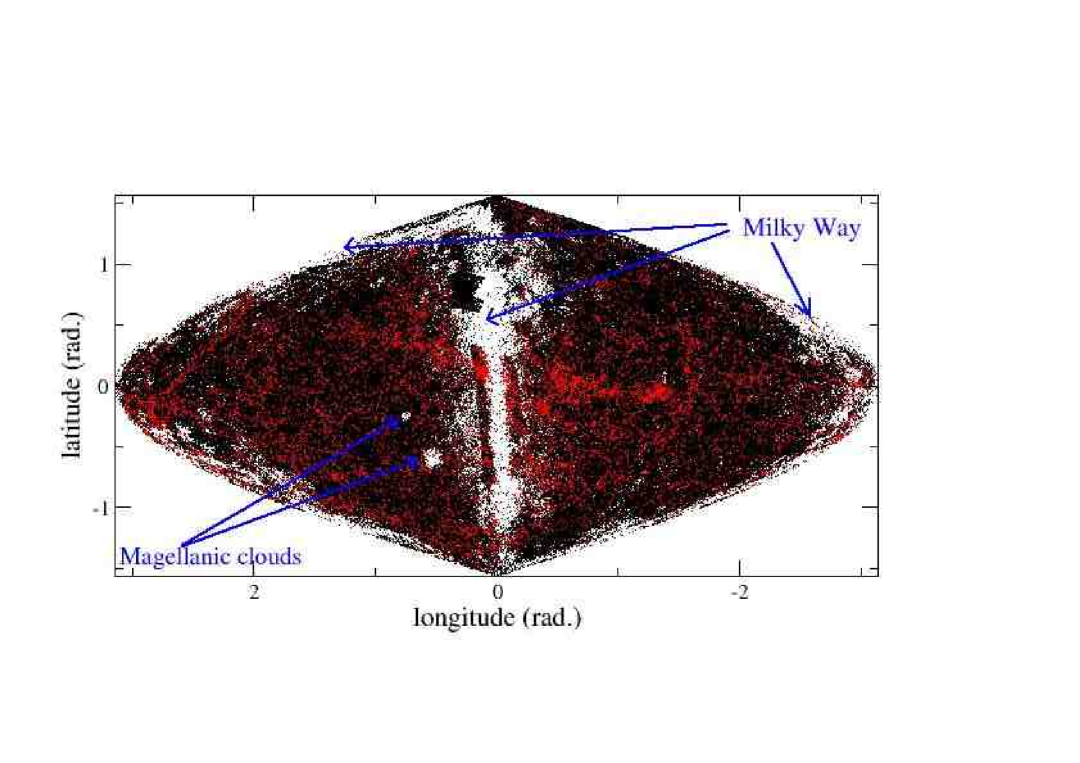
On Figure 4, the catalog of all galaxies having a measured B magnitude is shown in black. The galaxies having a magnitude brighter than 14.5 are in red. We can see that only this first selection step allows to distinguish between real structures and incompletness effects. For example near the zone of avoidance, in the center of the figure, one can see two vertical bands corresponding to the Las Campanas Redshift Survey (LCRS). These bands do disappear after the cut in apparent magnitude, ie this survey has a completness limit much deeper than the completness limit of the composite all-sky collection of redshift surveys in LEDA.
One structure that can be seen very clearly on Figure 5 is a kind of wave in the structures appearing in the upper left part of the figure and in the lower right part. Such a deformation in a 2D map can be due to a large scale plane of galaxies in the 3D distribution. As a matter of fact, this wave is passing through Perseus-Pisces, Pavo-Indus, Hydra-Centaurus, Virgo and Coma superclusters. It is known and described as the hypergalactic plane in Di Nella and Paturel (1994). The hypergalactic plane is not equivalent to the supergalactic plane. The supergalactic plane describes the local supercluster (LSC) plane at a shorter distance from the observer.
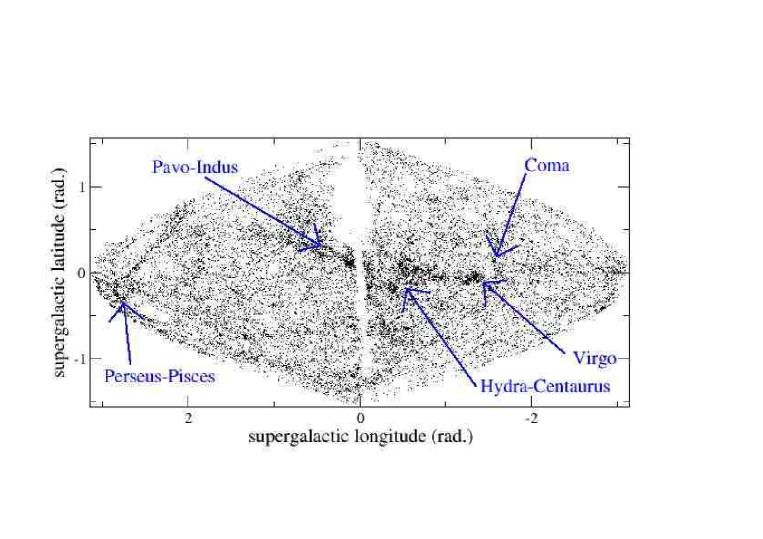
In fact the hypergalactic plane contains the local supercluster as Virgo cluster (the center of the LSC) is lying on this plane extending to larger scale.
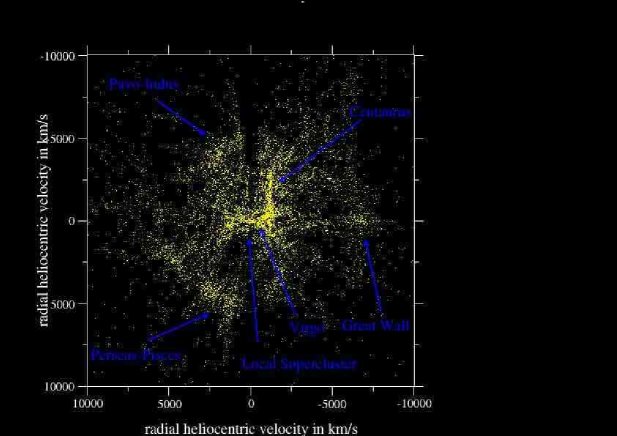
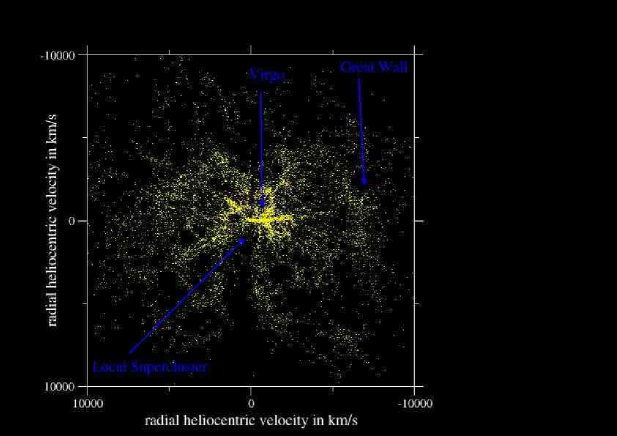
3.2 3D maps
After inspection of the galaxy distribution using 2D maps, it is constructive to view the allsky maps with a 3-D projection using the VL redshift sample. Here we project the supergalactic coordinates and redshift into an XYZ volume; figures 7 and 8. The latest largest all-sky 3D maps where published almost ten years ago (Di Nella and Paturel (1994), Di Nella and Paturel (1995), Di Nella et al. (1997), Amendola et al. (1997)), this paper improves the data number and more importantly the quality of the magnitudes used.
2A
3.3 Preliminary comparison with SDSS DR1
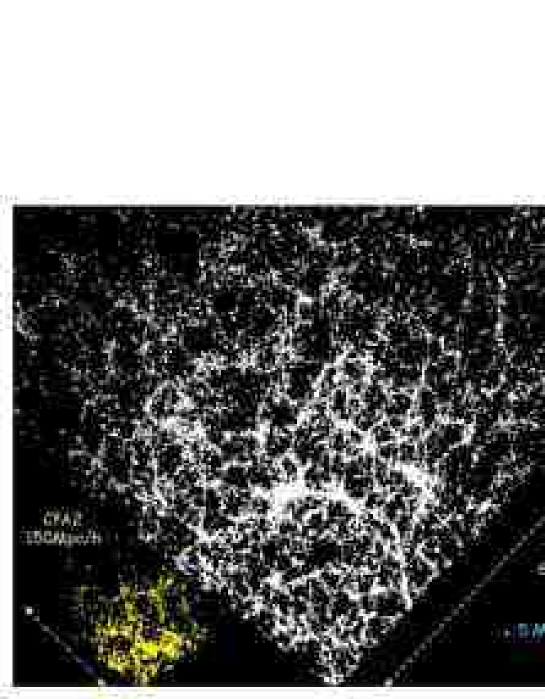
To go further in the mapping of the Local Universe, every astronomer working on large-scale structures has been waiting for Sloan Digitized Sky Survey (SDSS). These data are of first quality order because they provide the magnitudes in 5 bands, which will be very helpfull to quantify the evolution effects on the number counts. On Figure 9, one can see the first public datarelease (DR1) of the Sloan Digitized Sky Survey (SDSS) Abazajian et al. (2003). The first amazing fact to note is the continuity of bubbles, walls, and voids sequence up to a scale 6 times larger than the one we just discussed : up to z =0.2. The second point is the structures size : we can see a chain (or a wall ??) of galaxies extending on about 300 Mpc. As a comparison, we ploted the CfA2 (Huchra and Burg (1992) and Huchra et al. (1995))redshift survey containing the Great Wall of galaxies, which is about 100 Mpc long. We are now seeing a structure 10 times larger than the Great Wall.. The 2dF redshift survey (Colless et al. (2001)) probed a region with comparable depth to SDSS, revealing large scale structure with equally impressive detail and complexity. Combined, these redshift surveys suggest structures as large as 300 Mpc in extent, probably associated with ”walls” of galaxy clusters.
To help visualize structure in the Local Universe, we have created 3 animated renderings of the LEDA and SDSS redshift samples in XYZ space. The first, LEDA.avi, shows all LEDA galaxies with redshifts measurements; the second, LEDA145.avi, shows the LEDA galaxies brighter than 14.5 mag in Btc; and the third, LEDASDSSDR1.avi, combines the LEDA redshifts with those of SDSS (DR1). The movies show the galaxy distribution in 3-D space, rotated about each axis separately. For the LEDA/SDSS movie, the LEDA points are colored blue, while the SDSS points are colored yellow. Note the much greater depth, but more patchy coverage, of the SDSS sample compared to the LEDA redshift sample.
It is striking to see that the very local view of the local universe with bubbles, chains, walls can still be seen at a scale 10 times larger. One cannot guess the intrinsic scale of the structures by looking at these maps. We can really begin to speak about hierarchy in the large scale structures, another word for scale invariance. Studies of the statistical properties of such distributions are ongoing and we will present them very soon. For the moment, it is for instance clear that a galaxy correlation length of 15 Mpc, could hardly be a meaningfull statistical indicator tracing the galaxy clustering properties in the Local Universe.
4 Conclusions
With the astonishing large scale structure observed by 2MASS, SDSS, 2dF and through the LEDA archive, it is increasingly clear that the cosmological models must account for structures ten times larger than previous convention, upwards of 300 Mpc. The second idea is that we cannot simply estimate the scale at which one is looking at the structures, just by looking at the maps : we are seeing similar structures at different scales. This could be another argument in favor of using general tools that can describe both homogeneous and scale invariant distributions, to analyse the galaxy point distribution.
Acknowledgements.
We thanks very much the referee Thomas Jarrett for his help in improving this paper.References
- Abazajian et al. (2003) Abazajian et al. (The SDSS Collaboration), 2003, AJ, 126, 2081
- Amendola et al. (1997) Amendola L., Di Nella H., Montuori M., Sylos-Labini F., 1997, Fractals, vol.5, number 5, p.635
- Colless et al. (2001) Colless M. et al. (2dFGRS team), 2001, MNRAS, 328, 1039
- Cutri et al. (2003) Cutri R., et al., 2MASS Explanatory Supplement, 2003
- de Vaucouleurs et al. (1976) de Vaucouleurs G., de Vaucouleurs A., Corwin H.G., 1976, Second Reference Catalog of Bright Galaxies, Texas University Press, Austin (RC2)
- de Vaucouleurs et al. (1991) de Vaucouleurs G., de Vaucouleurs A., Corwin H.G., Buta R.J., Paturel G., Fouqué P., 1991, Third Reference Catalog of Bright Galaxies, Springer-Verlag (RC3)
- Di Nella and Paturel (1994) Di Nella H., Paturel G., 1994, Comptes rendus de l’académie des sciences Paris, série II, t319, 57
- Di Nella et al. (1997) Di Nella H., Parker Q.A., Couch W.J., Paturel G., 1997, MNRAS 287, 472
- Di Nella and Paturel (1995) Di Nella H., Paturel G., 1995, Publ. Astro. Soc. Australia, vol. 12, 26
- Di Nella et al. (1996) Di Nella H., Montuori M., Paturel G., Pietronero L., Sylos-Labini F., 1996, A&A Letter. 308, L33
- Geller and Huchra (1989) Geller M.J., Huchra J.P., 1989, Science 260, 1175
- Huchra and Burg (1992) Huchra J., Burg R., 1992, ApJ,393, 90
- Huchra et al. (1995) Huchra J.P., Geller M.J., Corwin H.G. Jr., 1995, ApJS,99,391
- Jarrett et al. (2000) Jarrett T.H., Chester T.,Cutri R., Schneider S., Skrutskie M., Huchra J.P. 2000, AJ, 119, 2498
- Paturel et al. (1997) Paturel G., Bottinelli L., Di Nella H., Durand N., Garnier R., Gouguenheim L., Marthinet M.C., Petit C., Rousseau J., Theureau G., Vauglin I., 1997, A&A Suppl. Ser. 124, 109-122
- Paturel et al. (1994) Paturel G., Bottinelli L., Di Nella H., Fouqué P., Gouguenheim L., 1994, A&A 289, 711
- Schlegel et al. (1998) Schlegel D.J., Finkbeiner D.P., Davis M., 1998, ApJ 500, 525