Resolving the Host Galaxy of the Nearby QSO I Zw 1 with Sub-Arcsecond Multi-Transition Molecular Line Observations11affiliation: Based on observations carried out with the Berkeley Illinois Maryland Association (BIMA) observatory. The BIMA observatory is supported by NSF grant AST-9981289 22affiliation: Based on observations carried out with the IRAM Plateau de Bure Interferometer. IRAM is supported by INSU/CNRS (France), MPG (Germany) and IGN (Spain)
Abstract
We present the first sub-kpc pc resolution 12CO(1-0) molecular line observations of the ISM in the host galaxy of the QSO I Zw 1. The observations were obtained with the BIMA mm-interferometer in its compact A configuration. The BIMA data are complemented by new observations of the 12CO(2-1) and 13CO(1-0) line with IRAM Plateau de Bure mm-interferometer (PdBI) at and resolution, respectively. These measurements, which are part of a multi-wavelength study of the host galaxy of I Zw 1, are aimed at comparing the ISM properties of a QSO host with those of nearby galaxies as well as to obtain constraints on galaxy formation/evolution models. Our images of the 12CO(1-0) line emission show a ring-like structure in the circumnuclear molecular gas distribution with an inner radius of about 1.2 kpc. The presence of such a molecular gas ring was predicted from earlier lower angular resolution PdBI 12CO(1-0) observations. A comparison of the BIMA data with IRAM PdBI 12CO(2-1) observations shows variations in the excitation conditions of the molecular gas in the innermost comprising the nuclear region of I Zw 1. The observed properties of the molecular cloud complexes in the disk of the host galaxy suggest that they can be the sites of massive circumnuclear star formation, and show no indications of excitation by the nuclear AGN. This all indicates that the molecular gas in a QSO host galaxy has similar properties to the gas observed in nearby low luminosity AGNs.
1 Introduction
One of the open questions in galaxy evolution is concerned with the formation of active galactic nuclei (AGN) and its relation to star formation (SF) in early type galaxies. The separation of starburst and AGN components in extragalactic objects – especially in host galaxies of quasars and QSOs – is a key problem in the investigation of evolutionary sequences proposed for AGNs (Norman & Scoville, 1988; Sanders et al., 1988; Rieke et al., 1988; Haas et al., 2003). Although it is not exactly known how the host galaxy affects the energy release of the QSO, there is statistical evidence for preceding mergers or current interaction of QSO host galaxies with a companion galaxy (McLeod & Rieke, 1994; Lim & Ho, 1999). It is believed that quasar activity is a common, but short lived, phenomenon in galaxy evolution (McLeod et al., 1999). Furthermore, host galaxies of QSOs show enhanced SF activities (Courvoisier, 1998). The transition between Ultra Luminous Infrared Galaxies (ULIRG) and AGN seems to be continuous, all showing signs of enhanced star formation in their nuclear regions (Genzel et al., 1998; McLeod et al., 1999).
Millimeter molecular line observations are ideal for studying the mechanisms which transport the molecular gas into the AGN. Observations of abundances, excitation and dynamics of the molecular interstellar medium in the central regions of AGN are essential, since the interstellar matter provides the ”fuel” for star formation as well as the central engine. Consequently, there are large numbers of high resolution observations available for nearby objects. These observations have revealed the presence of circumnuclear starburst rings in a large number of (nearby) active and IR luminous galaxies (e.g. NGC 1068, Planesas et al., 1991; NGC7469, Genzel et al., 1995; BIMA SoNG, Helfer et al., 2003). The extension of high angular resolution observations of molecular gas emission lines to QSO hosts is imperative in order to understand the connection between local active galaxies and high-z QSOs. The results can be used to refine model predictions of the physical conditions in high z- QSOs (such as used e.g. in Combes et al., 1999).
Due to the limited angular resolution of single dish mm-wavelength telescopes, only interferometric observations at these wavelengths allow insight into the morphology and into the kinematics of molecular clouds in the nuclear region of QSO host galaxies with sufficient angular resolution. High resolution molecular line observations allow for detailed kinematic studies of the cold interstellar medium and the derivation of important parameters such as gas masses, surface mass densities and star formation efficiencies. Observations of multiple CO transitions reveal excitation conditions and thus can be used to constrain the physical conditions in an observed region. They can be used to better constrain the contribution of star formation to the total observed infrared luminosities.
1.1 The nearby QSO I Zw 1
The radio-quiet QSO I Zw 1 is regarded as the closest QSO which can be used for detailed studies of its host galaxy (Tab. 1). I Zw 1 has a systemic velocity of 18,290 km s-1, which corresponds to a redshift of 0.0611 (Condon et al., 1985), or a distance of 255 Mpc (, Spergel et al., 2003). The nucleus of I Zw 1 is extremely bright in the optical ( of -23.45 mag, Schmidt & Green, 1983; Barvainis et al., 1989)) and also has very bright X-ray emission (Kruper et al., 1990). I Zw 1 belongs to the class of infrared luminous galaxies (, Haas et al., 2003), however its QSO nature is not apparent in the FIR. There is a strong indication for interaction between I Zw 1 and a neighboring companion (e.g. Lim & Ho, 1999; Scharwächter et al., 2003).
A direct comparison between the FIR emission and CO molecular line emission in the host galaxy reveals that the FIR continuum emission of I Zw 1 is predominantly thermal in nature (Barvainis et al., 1989). The FIR to 12CO(1-0) ratio shows a star formation efficiency of about 30 in the nuclear region (Eckart et al., 1994). Schinnerer et al. (1998) show that the molecular gas mass in the central (3.7 kpc) is 2/3 of the total observed mass of . A kinematic analysis of their 1.9” resolution PdBI 12CO(1-0) observations suggests that the central molecular gas is distributed in a ring of ( kpc) diameter. However the observations do not spatially resolve this ring. High resolution NIR observations show that the nuclear NIR spectrum is dominated by emission from the AGN, nevertheless about 25% of the NIR emission can be attributed to a nuclear starburst (Schinnerer et al., 1998), which might be located in the molecular gas ring. The star formation activity in the host galaxy of I Zw 1 underlines the important role of starbursts in the evolution of QSOs.
Only sub-arcsecond molecular line observations would allow actual imaging of this possible starburst ring. The extension of BIMA’s longest baselines up to a maximum of almost 2 km makes the array the millimeter instrument with the highest angular resolution currently available. Here we present 12CO(1-0) angular resolution observations of the QSO I Zw 1. This corresponds to a spatial resolution of roughly 850 pc. We also present new observations with the IRAM PdBI in 12CO(2-1) and 13CO(1-0) line at and resolution, respectively.
| Property | Value |
|---|---|
| Right ascension (J2000.0) | 00h53m34s.9 |
| Declination (J2000.0) | +12 |
| Inclination (deg) | 38 |
| Position angle (deg) | 135 |
| Systemic velocity (km s-1) | 18,290 |
| Distance (Mpc) | 255 |
| 1.24 kpc |
2 Observations and data reduction
2.1 BIMA observations
The data presented here were taken in December 1999 in the compact A array configuration (A-) of the ten element BIMA array (Welch et al., 1996) with baselines between 80 and 1310 m. Four more tracks of A array observations were obtained in February 2000, December 2001, and January 2002, but all of those yielded only poor quality data, demonstrating that this project poses requirements which are at the limit of what can be done with long baseline mm-interferometry to-date. The digital correlator was configured to cover two 800 MHz bands with the upper sideband centered at the redshifted 12CO(1-0) frequency of 108.633 GHz. The sky opacity is significantly lower at the frequency of redshifted 12CO(1-0) transition than at the rest frequency. System temperatures during the observations ranged from 180 to 400 K, single-sideband. We flagged data such that most observations with system temperatures above 300 K were rejected. The data were reduced with the MIRIAD software package (Sault et al., 1995).
The fluctuations in the atmosphere follow a Kolmogorov power law distribution up to the maximum baseline of 2 km in the A array configuration of the BIMA array. This means that phase variations increase with baseline length, and therefore long baseline observations require a particularly careful phase calibration. We employed fast phase referencing: the observations were switched between the source, the phase calibrator (0108+015, distance from I Zw 1 ) and an additional point source, the quasar 0121+118 (angular distance from I Zw 1 ) which serves as a test source to determine the accuracy of the solutions for the phases. One complete cycle takes less than two minutes in order to follow closely the atmospheric phase (Holdaway & Owens, 1993).
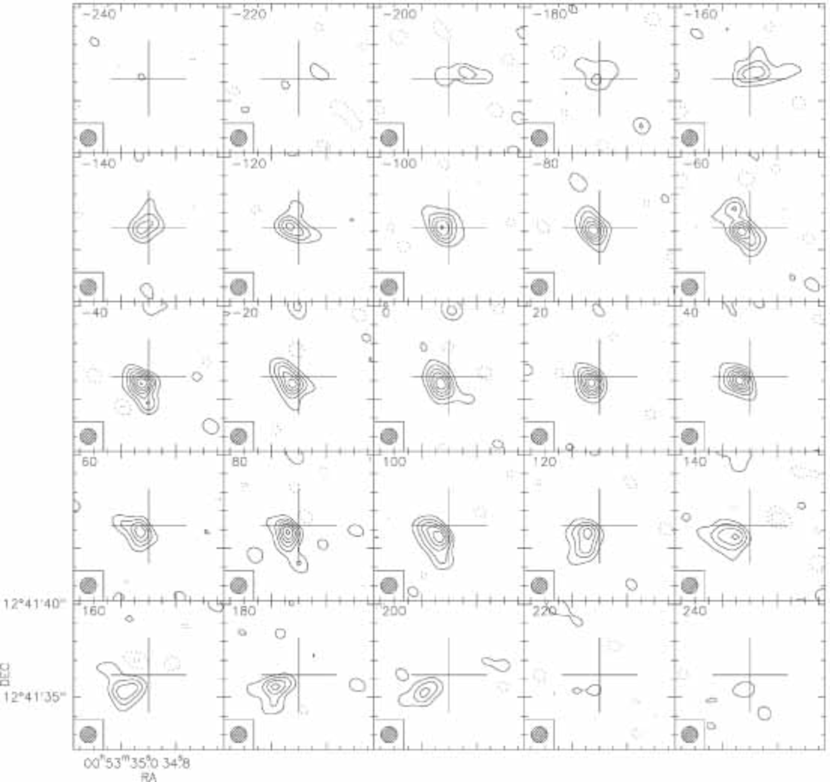
The test calibrator was used to select the best quality data: only observing cycles for which the test source maps to a point source down to the 20% level of its peak flux were selected (Fig. 1). This criterion was chosen to allow for a good quality image of the source. The reverse check, using 0121+118 as phase calibrator and 0108+015 as the test source, verified that the phase solutions derived from the test calibrator are of the same accuracy. Only the data taken in December 1999 have sufficient phase coherence to yield sub-arcsecond resolution observations. The data presented here are only from this observing track. The phase solutions derived from the test source 0121+118 were used for the images shown here, since this source is closer to I Zw 1 and therefore provides the best phase coherence. 0121+118 has a very flat spectrum with a flux of 1.1 Jy at 3.7 cm, 2 cm, and 7 mm (VLA calibrator list) and we use the same value for our 3 mm band. We estimate the uncertainty in the amplitude calibration to be better than 30%. In order to increase the signal to noise ratio in the data, we smoothed them to an effective angular resolution of .
2.2 IRAM PdBI observations
I Zw 1 was observed simultaneously in the 12CO(2-1) and 13CO(1-0) line in August 1996 with the four-element IRAM Plateau de Bure millimeter interferometer (PdBI) in the C configuration. Further dual-frequency observations in the B configuration were obtained in January 1997 and January/February 1998 with the then five-element array. The correlator was centered on the redshifted 12CO(2-1) frequency of 217.26321 GHz at 1 mm and the redshifted 13CO(1-0) frequency of 103.85578 GHz at 3 mm. With baselines between 40 and 280 m the data have a spatial resolution of with uniform weighting for the 12CO(2-1) line (Fig. 2), and with natural weighting for the 13CO(1-0) line. The noise per 20(40) km s-1 wide channel is mJy beam-1 in the combined data for the 12CO(2-1)(13CO(1-0)) line. The quasar 3C454.3 served as a passband calibrator, while standard IRAM PdBI phase calibrators were observed every 20 minutes. The data were calibrated and mapped using the IRAM GILDAS software package (Guilloteau & Lucas, 2000).
3 Results
| Region | ||||
|---|---|---|---|---|
| [km s-1] | [K] | [K km s-1] | [ cm-2] | |
| Disk () aafrom Schinnerer et al. (1998) | 310 | 0.03 | 10 | 2 |
| Nucleus () | 400 | 1.8 | 720 | 144 |
| kpc ring () | 100 | 12 | 1200 | 240 |
3.1 Spatial distribution of the 12CO(1-0) line emission
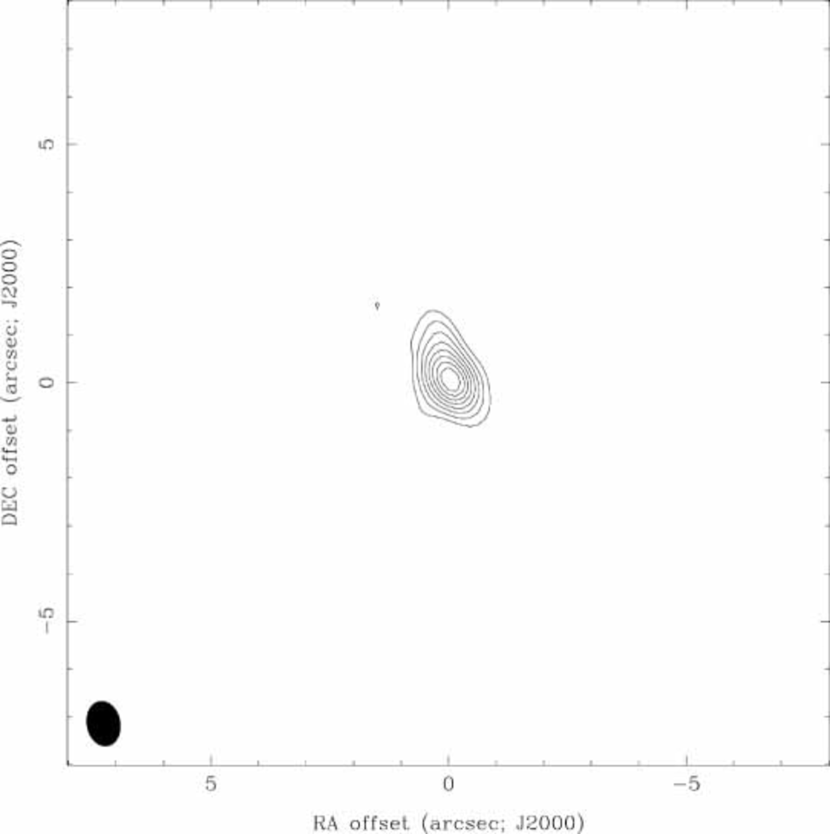
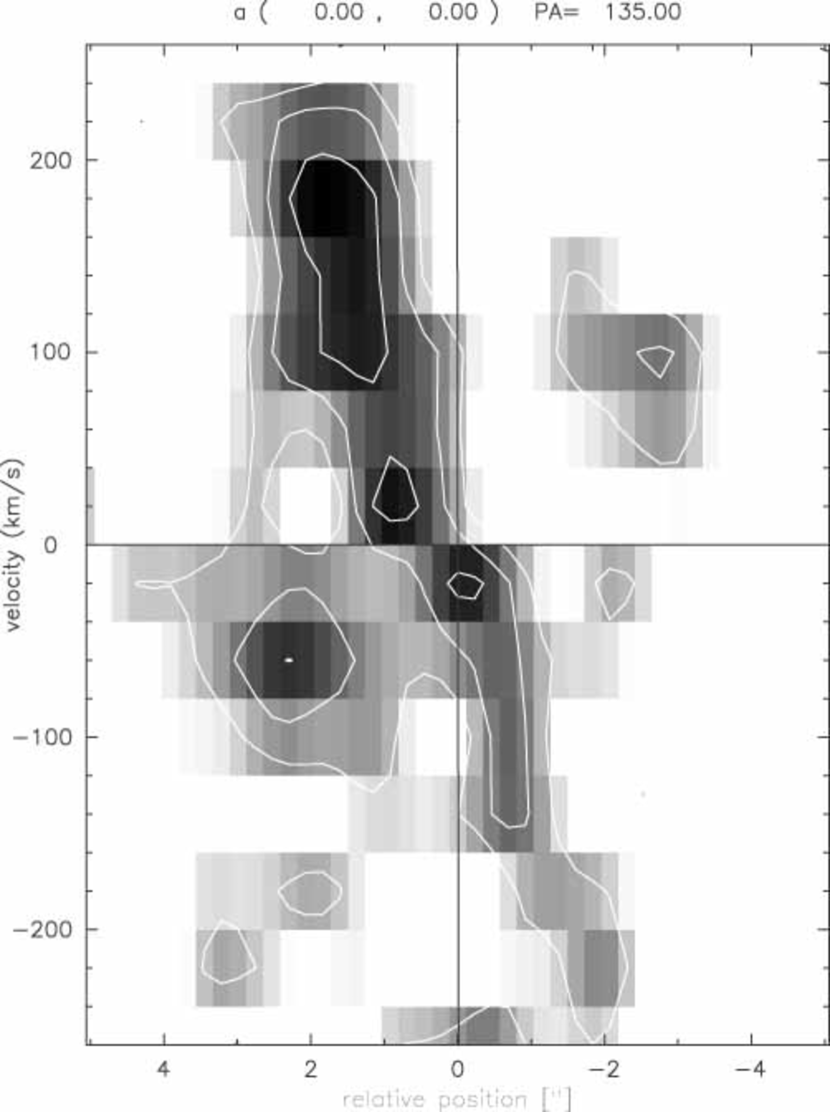
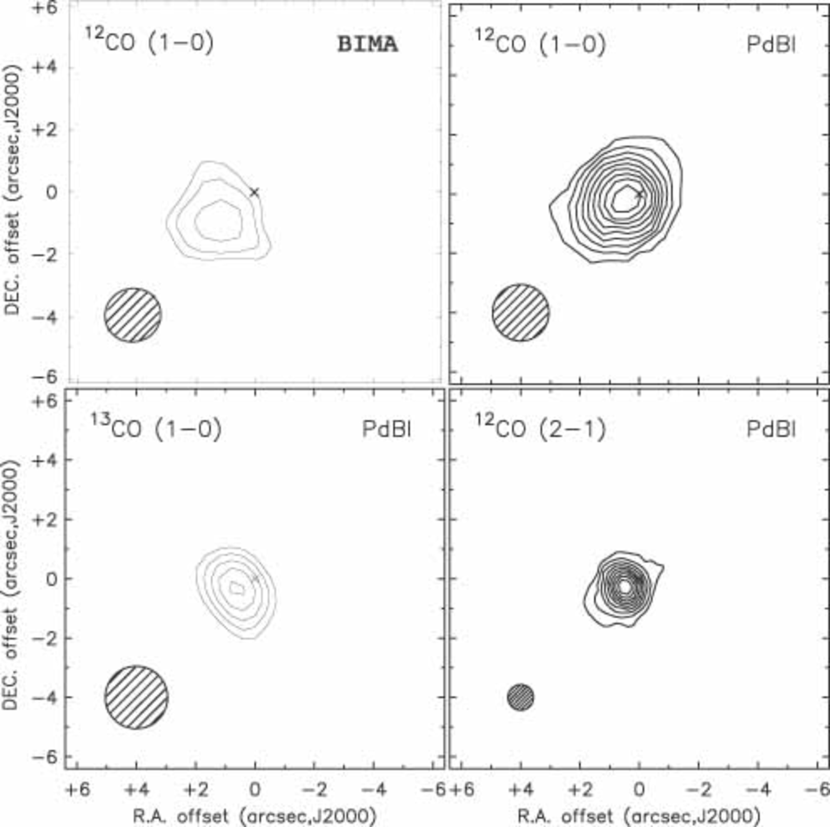
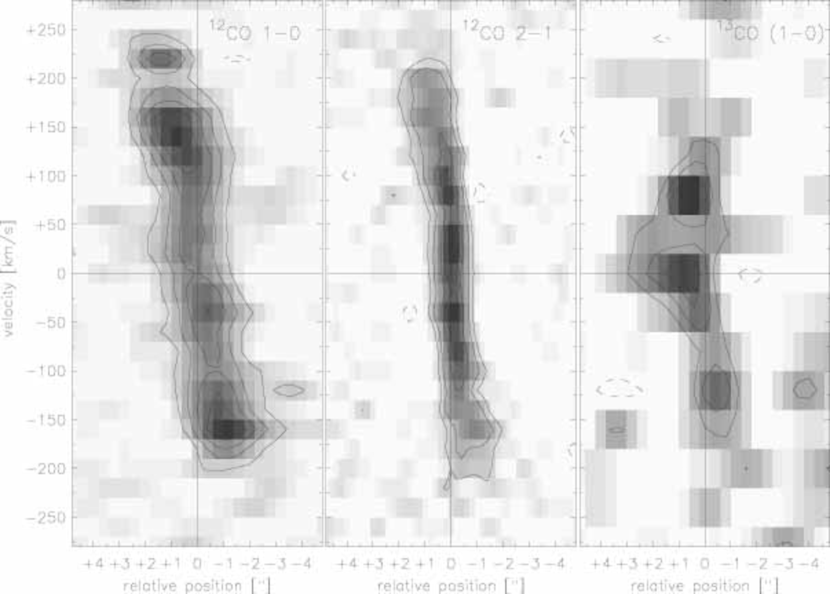
The gas disk of I Zw 1 is clearly resolved in its 12CO(1-0) line emission at resolution (Fig. 3). These are the first molecular line observations which resolve the emission in the nuclear region and show that the emission is not centrally peaked: the strongest molecular line emission is not coincident with the optical center of the galaxy, but situated at a distance between and , mainly to the South and East of the galaxy center. This corresponds to a distance of between 1.2 kpc and 3.7 kpc from the nucleus. This emission, which occurs at positive offsets in R.A. with respect to the major axis, has predominantly positive velocities (see position-velocity () diagram in Figure 4). When the velocity integrated BIMA 12CO(1-0) data are smoothed to a resolution of (Fig. 5, top left), which corresponds to the resolution of the corresponding 12CO(1-0) PdBI observations (Fig. 5, top right), we find a positional offset of in the center of emission of both images with respect to each other. The measured peak flux in the BIMA image, which is smoothed to a resolution of (Fig. 5, top left), is 28 mJy beam-1 or 11 Jy beam, slightly larger than the 12CO(1-0) peak flux of 8 Jy beam, at the same angular resolution observed with the PdBI. The difference of is still within the expected range, if we assume an uncertainty of the PdBI calibration of %.
This significant spatial offset of the 12CO(1-0) center of emission in the BIMA and PdBI observations can not be due to a pointing error of the BIMA observations, since a pointing error of this magnitude is not visible in the image of the test quasar (Fig. 1). The fact that the negative velocity components in the BIMA observations (Fig. 4) are less pronounced than in the lower resolution PdBI data (Fig. 6, left) indicates that the molecular emission at these velocities has a more extended distribution and therefore is partially resolved out in the high resolution BIMA data. This effect naturally explains the shift of the observed center in the BIMA data. Probably the most convincing indication that the denser, and therefore probably more spatially confined, molecular clouds are situated to the South-East of the nucleus comes from the 13CO(1-0) observations we obtained with the PdBI (Fig. 5, bottom left): the center of emission in these data is also shifted towards the South-East. It is worthwile to note that the peak of the line emission in all CO transitions is shifted by to the South-East of the nominal optical center. This could be due to the fact that the distribution of the CO line intensity is asymmetric with respect to the AGN. This assumption could be tested if the position of the dynamical center could be accurately determined; however, even the resolution of our 12CO(2-1) data is not adequate to do so.
3.2 Properties of the molecular gas
The observed diagram along the major axis at resolution (Fig. 4) shows a circular rotation which is consistent with the lower resolution PdBI 12CO(1-0) observations (Fig. 6, left; see also Scharwächter et al., 2003). The consistency of the observed diagrams in the BIMA and PdBI observations strongly supports the interpretation that the spatial offset of the peak emission in the BIMA image is not an artifact due to calibration errors. The peak emission of 35 mJy beam-1 in the BIMA diagram, which is observed over a velocity interval of about 100 km s-1, corresponds to an average brightness temperature of K in this velocity interval. This indicates a large beam filling factor, respectively a significant amount of molecular gas within a region of 600 pc2. Schinnerer et al. (1998) show that the standard conversion factor can be applied to the observed 12CO(1-0) line emission from I Zw 1.
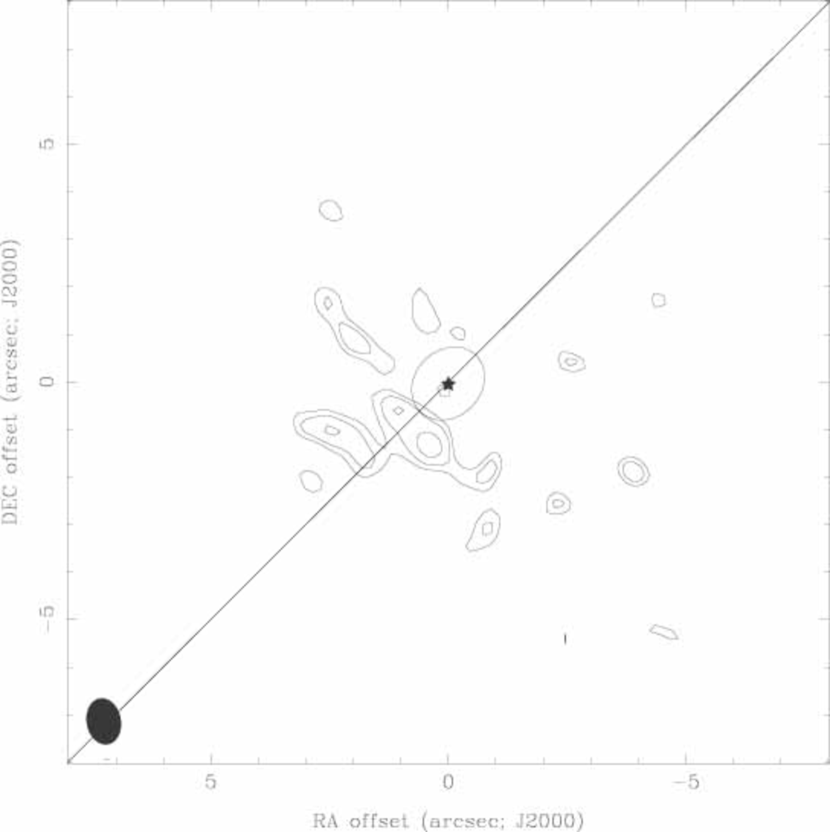
The peak flux of 18 mJy beam-1 in the velocity integrated resolution image (Fig. 3) translates into a molecular hydrogen column density of cm-2. About 50% of this emission has a velocity consistent with its origin being in a circumnuclear ring at a distance of . The corresponding column density of cm-2 in the molecular ring is two orders of magnitude larger than the average molecular gas column density of cm-2 in the disk region, and roughly a factor of two larger than the average column density of cm-2 in the nuclear region (the innermost region: see Table 2 for a summary of the observed 12CO(1-0) molecular line properties).
3.3 Multi-transition analysis of the molecular line emission
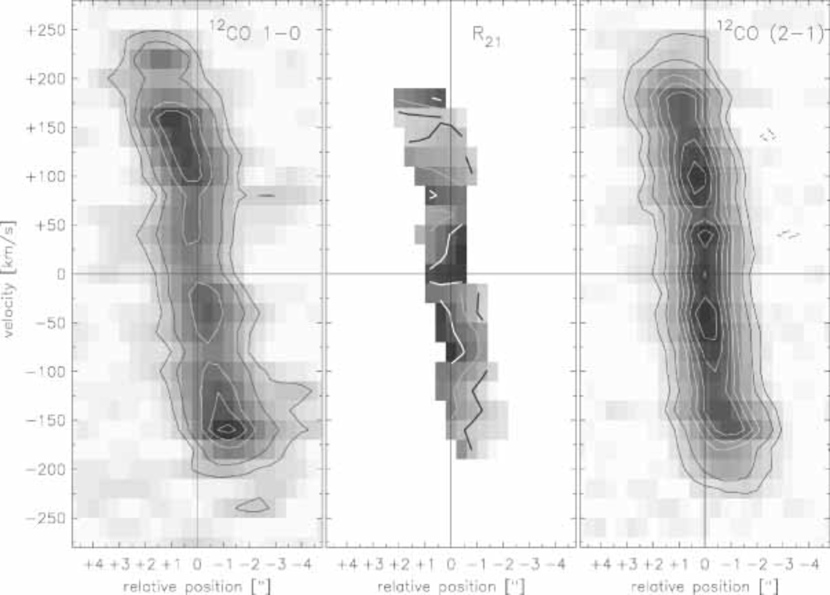
Our PdBI observations of the 12CO(2-1) and 13CO(1-0) line detect an integrated line flux ICO of 18 Jy km s-1 and 0.5 Jy km s-1, respectively. Thus they recover only about 30% (15-20%) of the observed IRAM 30m single dish flux of 61 Jy km s-1 (3.1 Jy km s-1) for the 12CO(2-1) (13CO(1-0)) line (Eckart et al., 1994). In contrast to the BIMA 12CO(1-0) observations, the resolution PdBI 12CO(2-1) observations (Fig. 5, bottom right) do not show any particular spatial structure in the nuclear region. This discrepancy can only be explained by a difference in the excitation of the molecular gas in the nucleus (innermost ) and the emission from molecular clouds which are situated further out. This interpretation is supported by both the PdBI and BIMA 12CO(1-0) observations: A comparison of the diagrams from the PdBI 12CO(1-0) observations from Schinnerer et al. (1998) (here chosen for the better signal to noise) and our new PdBI 12CO(2-1) and 13CO(1-0) observations can be seen in Figure 6. The peaks of the line intensity are shifted from km s-1 in the 12CO(1-0) line to lower velocities of km s-1 in the 12CO(2-1) line. This difference becomes even more obvious in the line peak ratio map of the major kinematic axis diagram shown in Figure 7. For these ratios the resolution of the 12CO(2-1) observations was smoothed to match the PdBI 12CO(1-0) observations. The line peak brightness ratio in the inner of I Zw 1 is . This drops by almost a factor of two to at the position of the 12CO(1-0) line peaks at km. This suggests that the outer 12CO(1-0) clouds, which are apparently not resolved out by the BIMA observations with a similar angular resolution as the PdBI 12CO(2-1) observations, are more subthermally excited than the molecular gas in the innermost region of I Zw 1. The fact that the denser and more thermalized molecular material breaks up into several distinct velocity components in the 12CO(2-1) emission (Figure 6) strongly suggests that circumnuclear star formation and not the central AGN is exciting the molecular line emission.
The derived line peak brightness ratio for the three 13CO(1-0) line peaks above (see Figure 6, right) is about 15. This value can probably be regarded only as an upper limit due to the large amount of missing flux which has been resolved out by our interferometric observations, in particular in the 13CO(1-0) observations (see above). We therefore avoid further interpretation of these ratios.
NIR spectra of the inner of I Zw 1 indicate the presence of circumnuclear star formation (Schinnerer et al. 1998). The millimeter line ratios for the inner suggest that these GMCs could be the site of this massive star formation. However, the BIMA observed 12CO(1-0) GMCs, which are further out, are also likely candidates for the observed starburst due to their high column densities. A starburst in these clouds might be triggered by the interaction of I Zw 1 with the companion galaxy (see Scharwächter et al., 2003).
3.4 Molecular gas kinematics
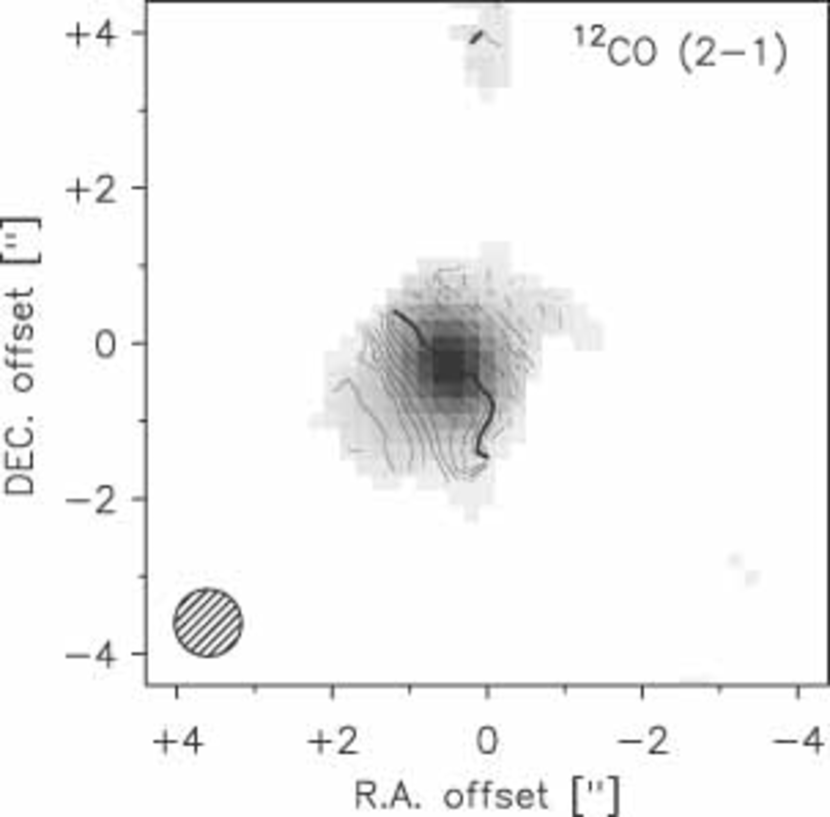
There is some enhanced emission in the BIMA diagram (Fig. 4) at velocities which are ”forbidden” with respect to circular motion, most prominently at a positive angular offset of along the major axis between and km s-1. Other than the emission from the circular rotation, it is pronounced only in one bin of the p-v diagram, and with a signal to noise ratio of its significance is not sufficient to be considered a clear detection. The 12CO(2-1) velocity field (Fig. 8) also shows indications of deviation from pure circular rotation for radii of , as is evident in the change in the line of nodes. Due to the lack of emission, this potential non-circular motion can not be followed to larger radii. Together with the “forbidden” 12CO(1-0) it can be seen as circumstantial evidence that some transportation mechanism for the molecular gas is active in the disk of I Zw 1. However, data of higher angular resolution and improved sensitivity will be needed to confirm this. A more detailed analysis of the observed rotational pattern can be found in Scharwächter et al. (2003).
4 Summary and Conclusions
Our BIMA 12CO(1-0) observations represent the first molecular line observations of the host galaxy of a QSO with sub-kpc resolution. The molecular gas disk of a QSO is for the first time spatially resolved into individual giant molecular cloud complexes. We observe giant molecular clouds with peak molecular hydrogen column densities of cm-2 at a distance between and from the nucleus. With such high column densities these clouds could be actively forming stars.
The combination of BIMA observations with new and previously published PdBI CO data allows for the first interferometric multi-transition study in the disk of I Zw 1. The line brightness ratios in the inner are consistent with moderately dense cold GMCs, and they are not peaked at the center. This strongly suggests that the AGN has no significant effect on the central molecular material.
The exact location of the circumnuclear starburst very likely seen in nuclear NIR spectra (Schinnerer et al. 1998) is still not identified. Possible candidates are the resolved 12CO(1-0) molecular clouds seen by BIMA as well as the more thermalized material traced by the higher line ratios inside the inner . However, any of these molecular clouds are likely sites of a massive starburst which contributes to the observed far-infrared luminosity of .
The distribution and properties of the molecular gas in the host galaxy of the nearby QSO I Zw 1 are quite similar to what is observed in nearby low luminosity AGNs (e.g. Paglione et al., 2001; NUGA Survey, Garc a-Burillo et al., 2003). This suggests that the ISM in QSO at high redshift might be similar to nearby low luminosity AGN as well.
Four additional attempts to re-observe I Zw 1 in 12CO(1-0) with BIMA in the A configuration all failed to provide useful data, due to insufficient phase coherence of the observations. This demonstrates that the observations presented here are on the limit of what can be done without active phase correction systems, at least from a site such as Hat Creek where the BIMA array is situated.
References
- Barvainis et al. (1989) Barvainis, R., Alloin, D., and Antonucci, R. 1989, ApJ, 337L, 69
- Combes et al. (1999) Combes, F., Maoli, R., and Omont, A. 1999, A&A, 345, 369
- Condon et al. (1985) Condon, J.J, Hutchings, J.B., Gower, J.C. 1985, AJ, 90, 1642)
- Courvoisier (1998) Courvoisie, T.J.L. 1998, ARA&A, 9, 1
- Eckart et al. (1994) Eckart, A., van der Werf, P. P., Hofmann, R., and Harris, A. I. 1994, ApJ, 424, 627
- NUGA Survey, Garc a-Burillo et al. (2003) Garc a-Burillo, S., Combes, F., Hunt, L. K., Boone, F., Baker, A. J., Tacconi, L. J., Eckart, A., Neri, R. 2003, A&A407, 485 Leon, S.; Schinnerer, E.; Englmaier, P.
- NGC7469, Genzel et al. (1995) Genzel, R., Weitzel, L., Tacconi-Garman, L. E., Blietz, M., Krabbe, A., Lutz, D., and Sternberg, A. 1995, ApJ, 444, 129
- Genzel et al. (1998) Genzel, R., Lutz, D., Sturm, E., Egami, E., Kunze, D., Moorwood, A. F. M., Rigopoulou, D., Spoon, H. W. W., Sternberg, A., Tacconi-Garman, L. E., Tacconi, L., and Thatte, N. 1998, ApJ, 498, 579
- Guilloteau & Lucas (2000) Guilloteau, S., Lucas, R. 2000, in Imaging at Radio through Submillimeter Wavelengths, ed. J.G. Mangum, S.J.E. Radford, ASP Conf. Ser., 299
- Haas et al. (2003) Haas, M., Klaas, U., M ller, S. A. H., Bertoldi, F., Camenzind, M., Chini, R., Krause, O., Lemke, D., Meisenheimer, K., Richards, P. J., Wilkes, B. J. 2003, A&A, 402, 87
- BIMA SoNG, Helfer et al. (2003) Helfer, T.T., Thornley, M.D., Regan, M.W., Wong, T., Sheth, K., Vogel, S.N., Blitz, L., Bock, D.C.-J. 2003, ApJS, 145, 259
- Holdaway & Owens (1993) Holdaway, M.A., and Owens, F.N. 1993, ALMA Memo Series, 126
- Kruper et al. (1990) Kruper, J. S., Canizares, C. R., and Urry, C. M. 1990, ApJS, 74, 347
- Lim & Ho (1999) Lim, J., and Ho, P.T.P 1999, ApJ, 510, 7
- McLeod & Rieke (1994) McLeod, K. K., and Rieke, G. H. 1994, ApJ, 431, 137
- McLeod et al. (1999) McLeod, K. K., Rieke, G. H., and Storrie-Lombardi, L. J. 1999, ApJ, 511L, 67
- Norman & Scoville (1988) Norman, C., and Scoville, N. 1988, ApJ, 332, 124
- Paglione et al. (2001) Paglione, T.A. D., Wall, W. F., Young, J. S., Heyer, M. H.; Richard, M., Goldstein, M., Kaufman, Z., Nantais, J., and Perry, G. 2001, ApJS, 135 183
- Planesas et al. (1991) Planesas, P., Scoville, N., and Myers, S. T 1991, ApJ, 369, 364
- Sanders et al. (1988) Sanders, D. B., Soifer, B. T., Elias, J. H., Madore, B. F., Matthews, K., Neugebauer, G., and Scoville, N. 1988, ApJ, 325, 74
- Sault et al. (1995) Sault, R. J., Teuben, P. J., and Wright, M. C. H. 1995, PASPConf. Ser. 77, 433
- Scharwächter et al. (2003) Scharwächter, J., Eckart, A., Pfalzner, S., Moultaka, J., Straubmeier, C., and Staguhn, J. G. 2003, A&A, 405, 959
- Schinnerer et al. (1998) Schinnerer, E., Eckart, A., and Tacconi, L. J. 1998, ApJ, 500, 147
- Schmidt & Green (1983) Schmidt, M., and Green, R. F. 1983, ApJ, 269, 352
- Spergel et al. (2003) Spergel, D.N., Verde, L., Peiris, H.V., Komatsu, E., Nolta, M.R., Bennett, C.L., Halpern, M., Hinshaw, G., Jarosik, N., Kogut, A., Limon, M., Meyer, S.S., Page, L., Tucker, G.S., Weiland, J.L., Wollack, E., and Wright, E. L. 2003, ApJS, 148, 175
- Rieke et al. (1988) Rieke, G. H., Lebofsky, M. J., and Walker, C. E. 1988, ApJ, 325, 679
- Welch et al. (1996) Welch, W. J., et al. 1996, PASP, 108, 93