Detection of D2H+ in the Dense Interstellar Medium
Abstract
The 692 GHz para ground-state line of D2H+ has been detected at the Caltech Submillimeter Observatory towards the pre-stellar core 16293E. The derived D2H+ abundance is comparable to that of H2D+, as determined by observations of the 372 GHz line of ortho-H2D+. This is an observational verification of recent theoretical predictions (Roberts, Herbst & Millar 2003), developed to explain the large deuteration ratios observed in cold, high-density regions of the interstellar medium associated with low mass pre-stellar cores and protostars. This detection confirms expectations that the multiply deuterated forms of H3+ were missing factors of earlier models. The inclusion of D2H+ and D3+ in the models leads to predictions of higher values of the D/H ratio in the gas phase.
1 Introduction
Recently, millimeter and submillimeter spectroscopy of the dense interstellar medium has shown that, in cold dense regions, deuterated molecular species are highly abundant, sometimes more than 10-1 of the H version. Amazingly, doubly and triply deuterated species can be observed, e.g. D2CO (Ceccarelli et al., 1998), NHD2 (Roueff et al., 2000), CHD2OH (Parise et al., 2002), D2S (Vastel et al., 2003), ND3 (Lis et al., 2002; van der Tak et al., 2002), CD3OH (Parise et al., 2004). Several models have been developed to account for such high levels of deuteration (Tielens, 1983; Roberts & Millar, 2000a, b). Phillips & Vastel (2002) have pointed out that the deuteration of H3+ will be extended beyond H2D+, to D2H+ and D3+, and that detection of D2H+ might be possible. A calculation taking a high degree of deuteration into account has been carried out by Roberts, Herbst & Millar (2003) and Walmsley, Flower & Pineau des Fôrets (2004), confirming the expectation that, in dense depleted regions, the abundance of D2H+ will be similar to that of H2D+, and that D3+ will be abundant.
The key enabling work in the astronomical search for D2H+ is the laboratory measurement of
the para ground-state transition (110-101) by Hirao and Amano (2003). We report here the first
astronomical detection of that transition.
Chemical reactions go in the direction to minimize energy. The chemical fractionation process favors the production of the heavier more deuterated species, because of the mass dependence of the zero-point vibration energies of the isotopic variants. Gas phase species are expected to be depleted at the centers of cold, dark clouds, since they accrete on the dust grains (see, e.g., Charnley, 1997). A series of observations has shown that the abundances of molecules like CO decrease in many pre-stellar cores (Bacmann et al., 2002). The removal of these reactive species affects the gas-phase chemistry and particularly the deuterium fractionation within the cloud. Indeed, the removal of species that would normally destroy H3+ (e.g. CO; Roberts & Millar, 2000a) means that H3+ is more likely to react with HD and produce H2D+. For example, if [CO/H2] 5 10-6 (Bacmann et al., 2002), this leaves HD at [HD/H2] 5 10-5 as the most abundant molecule available for reaction with H and H2D+, and favors the production of high deuterium content molecules:
| (1) |
| (2) |
| (3) |
where Ea, Eb and Ec are the released energies of the exothermic reactions. Using the zero-point energies computed by Ramanlal, Polyanski & Tennyson (2003), and the energy of the first allowed rotational state of the H molecule permitted by the Pauli exclusion principle ( 92 K), these values are: Ea = 230 K, Eb = 180 K and Ec = 230 K.
After a long frustrating search (Phillips et al., 1985; Pagani et al., 1992; van Dishoeck et al., 1992; Boreiko & Betz, 1993), and with the advent of new submillimeter receivers, H2D+ was detected toward two young stellar objects, NGC 1333 IRAS 4A (Stark et al. 1999) and IRAS 16293-2422A (Stark et al. 2004), although with relatively low signal strength. The H2D+ search has now been extended to pre-stellar cores, and has been detected with relatively strong emission (Caselli et al. 2003; Caselli et al. 2004, in preparation; Vastel et al. 2004, in preparation) confirming that H2D+ is dramatically enhanced in a gas depleted of most molecules.
The ammonia and DCO+ emission around the proto-binary system IRAS16293-2422 (Wootten & Loren, 1987; Mizuno et al., 1990; Lis et al., 2002) does not only peak on IRAS16293-2422 itself but shows a second peak, about 90′′ to the southeast, in a condensation called 16293E. Lis et al. (2002) found that CO in this region is depleted by a factor of 7. It is known to be a region where deuterium fractionation is strong and was chosen to be searched for D2H+.
2 Observations and results
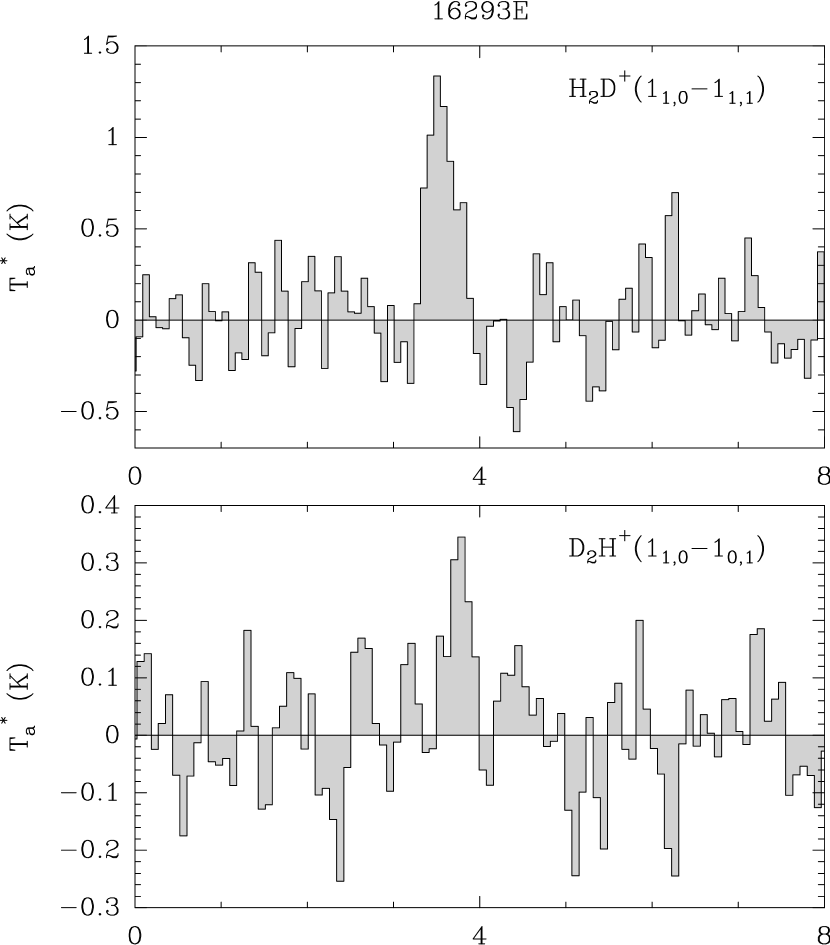
The pure rotational transition (110-101) of D2H+ has been measured in the laboratory by Hirao and Amano (2003). Spectroscopic observations of 16293E, presented here, were carried out in February 2004 using the facility receivers and spectrometers of the Caltech Submillimeter Observatory (CSO) on Mauna Kea, Hawaii. The position chosen was the DCO+ peak emission (=16h32m29.4s, =-24o28′52.6′′, Lis et al. 2002). We observed both the 110-111 transition of ortho-H2D+ ( = 372.42134(20) GHz, Bogey et al., 1984) and the 110-101 transition of para-D2H+ ( = 691.660440(19) GHz, Hirao and Amano, 2003) (see Figures 1 and 2) which are the only lines currently available for these species. The data were taken under good weather conditions (225 GHz zenith opacity between 0.03 and 0.05). The CSO main beam efficiencies are 60% for the 345 GHz receiver and 40% for the 650 GHz receiver, determined from total power observations of Mars and Saturn. If the emission is extended compared to the beam size of CSO, as appears to be the case for DCO+ (Lis et al., 2002), then the efficiency is about 70% at 372 GHz and 60% at 692 GHz. The FWHM beam size at 372 GHz is about 20′′, compared to 11′′ at 692 GHz. Typical calibration uncertainties are 24%. The pointing of the telescope was determined from observations of Jupiter, and was stable about 2′′ (rms). We used both the 50 MHz and 500 MHz bandwidth acousto-optical facility spectrometers. The 500 MHz system was used to check system performance and calibration with the CO (6 5) line, which is offset by 82 km s-1 from D2H+. There are no known lines of other interstellar molecules within 50 MHz, likely to emit from such a cold region. In Table 1 we report the frequency, the antenna temperature, the linewidth and the velocity relative to the local standard of rest, for the two lines. In Figure 3, we present 8.2 and 4.4 detections of H2D+ and D2H+ respectively, obtained in 23 minutes and 103 minutes on-source integration time, respectively.
Since the para ground-state transition for D2H+ is the only line available to existing telescope facilities, it is not possible to obtain confirmation of the identification. However, the situation is very different from molecule detection in hot core regions, such as OMC-1, where line confusion is rampant. At the 692 GHz transition frequency, any heavy molecule would need to be in a high J state, but the 10 K excitation temperature means that any such state cannot be occupied. Of course, CO (6 5) is observable, but only at Ta∗ = 2.3 K. No U-lines have been observed in this source. The identification rests on the comparison of the deduced VLSR for D2H+ with that for other deuterated molecules, and also the line width and line strength. Note that the quoted uncertainty for the line frequency is about 0.16 km s-1 for H2D+ and 0.008 km s-1 for D2H+. The very slight difference in the observed Vlsr for these two lines ( 0.2 km s-1) could be due, in part, to the uncertainty in the line frequencies, particularly H2D+. Also the accuracy of the astronomical measurement is limited by the resolution of the acousto-optic spectrometer at about 0.1 km s-1.
3 Discussion
From the observed line strengths, given in column 3 of Table 1, we estimate the H2D+ and D2H+ column densities (see Table 2) for an excitation temperature Tex of 10 K, assuming a 25% calibration uncertainty (3 ). The column density is given by:
| (4) |
where Q(Tex) is the partition function, Assuming LTE conditions, we can estimate the optical depth from the observed line intensity:
| (5) |
where is the radiation temperature of a blackbody at a temperature T, and Tbg is the cosmic background temperature of 2.7 K. In the case of the H2D+ transition, gu = 9, Aul = 1.04 10-4 s-1, Eul = 17.9 K; in the case of the D2H+ transition, gu = 9, Aul = 4.55 10-4 s-1, Eul = 33.2 K. The derived column densities depend on the assumed value of the excitation temperature. Using NH3, Mizuno et al. (1990) estimate the gas temperature to be 12 K. Using D2CO line ratios, Loinard et al. (2001) obtained a rotational temperature of 8-10 K. Thus we quote, in Table 2, the values obtained for an excitation temperature of 10 K. Figure 4 presents the evolution of the ortho-H2D+ and para-D2H+ column densities as well as the para-D2H+/ortho-H2D+ ratio, as a function of temperature between 9 and 15 K. Figure 4 and Table 2 represent the case where the source emission is extended compared to the beam size. If the source emission is comparable to or smaller than the CSO beam size, the para-D2H+/ortho-H2D+ ratio is then increased by a factor of 1.5 at the average excitation temperature of 10 K. At thermal equilibrium, the ortho to para (respectively para to ortho) concentration ratio for H2D+ (respectively D2H+) is equal to 9 exp(-86.4/T) (respectively 9/6 exp(-50.2/T)), so that at 10 K, this ratio would be 2 10-3 (respectively 10-2). However, taking into account the limited rates of the spin allowed collisions with H2, it is found that at these low temperatures, the ortho to para H2D+ concentration ratio is close to unity (Gerlich, Herbst & Roueff, 2002). The para to ortho D2H+ ratio is estimated by Walmsley, Flower & Pineau des Fôrets (2004) to be about one, for the same conditions. The para-D2H+/ortho-H2D+ ratio presented in Figure 4 should then approximately represent the actual D2H+/H2D+ ratio.
The 1.3 mm dust continuum strength (see Lis et al., 2002) is 0.3 Jy in a 11′′ beam and 1.3 Jy in a 20′′ beam corresponding to the angular resolution of the H2D+ and D2H+ data. Assuming a dust temperature of 12 K and a mass opacity coefficient of 0.005 cm2 g-1 (appropriate for pre-stellar cores), we derive an H2 column density of 5 1023 cm-2. We then derive the H2D+ and D2H+ abundances to range between 10-10 (at 10 K) and 10-11 (at 15 K) compatible with abundances found by Roberts, Herbst & Millar (2003) for a cloud at 10 K and n(H2)=3 106 cm-3.
The main result of this work is the detection of D2H+, with an abundance comparable to that of H2D+. This is a remarkable verification of recent theoretical predictions, aimed at explaining the large deuteration ratios observed in low mass pre-stellar cores and protostars. Two models, Roberts, Herbst & Millar (2003) and Walmsley, Flower & Pineau des Fôrets (2004), have recently considered the effect of including all possible deuterated isotopomers of H in the chemical networks, as suggested by Phillips & Vastel (2002). Roberts, Herbst & Millar (2003) studied the temporal evolution of a cold and dense cloud, and found that at late times ( 104 yr), when CO is severely depleted in the gas phase (more than a factor of 1000), the D2H+/H2D+ ratio reaches unity. Walmsley, Flower & Pineau des Fôrets (2004) studied the evolution of gas, depleted in CO, as a function of gas density and grain size distribution. For densities larger than 106 cm-3, they also found that D3+ can be the most abundant ion and that the D2H+/H2D+ ratio reaches unity (see their figure 2). Both models need an extreme CO depletion to account for such a ratio. As discussed in the Introduction, the measured CO depletion in 16293E is a factor 7 (Lis et al., 2002), rather than the extreme CO depletion needed by the models. However, the CO was measured in a large region (31”) compared with that probed by the present observations: 20′′ for the H2D+ and 11′′ for the D2H+ observations. Also, regions containing CO will not contain much H2D+ and D2H+ and vice-versa, so the inevitable inhomogeneities in the region inhibit a clear result.
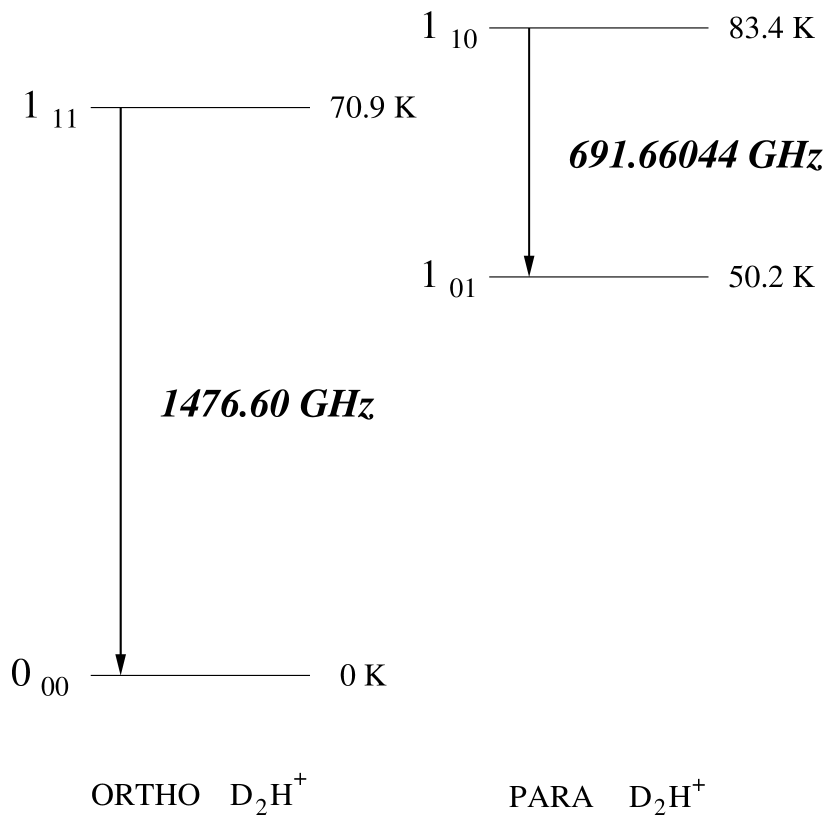
In summary, after some years of inconclusive results for theoretical models in understanding the observed high deuteration ratios of doubly and triply deuterated molecules, the present observation seems to suggest that the basic process is now almost completely understood: the large deuteration is due to extreme CO depletion, and the factor that was previously missing in the models is the multiply deuterated forms of H. This is quite an achievement, and one remaining step will be to verify that the last prediction, a significant abundance of D, is also fulfilled. At present, the lines detected here are the only ones available for H2D+ and D2H+. Knowledge of the ortho to para ratios and abundances of H2D+ and D2H+ would be considerably improved if the ground state transitions of para-H2D+ (at 1370.15 GHz) and ortho-D2H+ (at 1476.60 GHz) were available. These lines could be detected from space telescopes such as Herschel with the Heterodyne Instrument for the Far-Infrared and also possibly from the stratospheric observatory SOFIA. However, D3+, like H3+ has no permanent dipole moment. Therefore this molecule probably can only be detected in absorption in the near-infrared.
References
- Bacmann et al. (2002) Bacmann, A., Leffloch, B., Ceccarelli, C., Castets, A., et al., 2002, A&A 389, 6
- Bogey et al. (1984) Bogey, M., Demuynck, C., Denis, M., Destombes, J.L., Lemoine, L., 1984, A&A 137, L15
- Boreiko & Betz (1993) Boreiko, R.T., Betz, A.L., 1993, ApJ 405, L39
- Caselli et al. (2003) Caselli, P., van der Tak, F., Ceccarelli, C., Bacmann, A., 2003, A&A 403, L37
- (5) Caselli, P., et al., in preparation
- Ceccarelli et al. (1998) Ceccarelli, C., Castets, A., Loinard, L., Caux, E., Tielens, A.G.G.M., 1998, A&A 338, 43
- Charnley (1997) Charnley, S.B., 1997, MNRAS 291, 455
- Gerlich, Herbst & Roueff (2002) Gerlich, D., Herbst, E., Roueff, E., 2002, P&SS 50, 1275
- Hirao and Amano (2003) Hirao, T., Amano, T, 2003, ApJ 597, 85
- Lis et al. (2002) Lis, D.C., Roueff, E., Gerin, M., et al., 2002, ApJ571, L55
- Loinard et al. (2001) Loinard, L., Castets, A., Ceccarelli, C., Caux, E., Tielens, A., 2001, ApJ 552, L163
- Mizuno et al. (1990) Mizuno, A., Fukui, Y., Iwata, T., Nozawa, S., Takano, T., 1990, ApJ 356, 184
- Pagani et al. (1992) Pagani, L., Wannier, P., Frerking, M., et al. 1992, A&A 258, 472
- Parise et al. (2002) Parise, B., Ceccarelli, C., Tielens, A.G.G.M., Hersbt, E., et al., 2002, A&A 393, L49
- Parise et al. (2004) Parise, B., Castets, A., Herbst, E., Caux, E., et al., 2004, A&A 416, 159
- Phillips & Vastel (2002) Phillips, T.G. and Vastel, C., 2002, in Chemistry as a Diagnostic of Star Formation, ed. C.L. Curry & M. Fish, astro-ph/0211610
- Phillips et al. (1985) Phillips, T.G., Blake, G., Keene, J., Woods, R., Churchwell, E., 1985, ApJ 294, L45
- Ramanlal, Polyanski & Tennyson (2003) Ramanlal, J., Polyansky, O.L., Tennyson, J., 2003, A&A 406, 383
- Roberts, Herbst & Millar (2003) Roberts, H., Herbst, E., Millar, T.G., 2003, ApJ 591, 41
- Roberts & Millar (2000a) Roberts, H. & Millar, T.J., 2000a, A&A 361, 388
- Roberts & Millar (2000b) Roberts, H. & Millar, T.J., 2000b, A&A 364, 780
- Roueff et al. (2000) Roueff, E., Tiné, S., Coudert, L., Pineau des Fôrets, G., et al., 2000, A&A 354, 63
- Stark, van der Tak & van Dishoeck (1999) Stark, R., van der Tak, F., van Dishoeck, E., 1999, ApJ 521, L67
- Stark et al. (2004) Stark, R., Sandell, G., Beck, S., Hogerheijde, M., et al., 2004, astro-ph/0402604
- Tielens (1983) Tielens, A.G.G.M., 1983, ApJ 119, 177
- van der Tak et al. (2002) van der Tak, F., Schilke, P., Muller, H., Lis, D., et al., 2002, A&A 388, L53
- van Dishoeck et al. (1992) van Dishoeck, E., Phillips, T.G., Keene, J., Blake, G., 1992, A&A 261, L13
- Vastel et al. (2003) Vastel, C., Phillips, T.G., Ceccarelli, C., Pearson, J., 2003, ApJ 593, L97
- (29) Vastel, C., Phillips, T.G., et al., in preparation
- Walmsley, Flower & Pineau des Fôrets (2004) Walmsley, M., Flower, D.R., Pineau des Fôrets, G., 2004, accepted in A&A
- Wootten & Loren (1987) Wootten, A., Loren, R., 1984, ApJ 317, 220


| Line | Ta∗ | v | VLSR | |
|---|---|---|---|---|
| (GHz) | (K) | (km s-1) | (km s-1) | |
| H2D+ (110-111) | 372.42134(20)aaMeasured frequency by Bogey et al. (1984). | 1.31 | 0.36 0.04 | 3.55 0.02 |
| D2H+ (110-101) | 691.660440(19)bbMeasured frequency by Hirao and Amano (2003). | 0.34 | 0.29 0.07 | 3.76 0.03 |
| Tex = 10 K | ||
|---|---|---|
| N(1013 cm-2) | ||
| o-H2D+ | 0.74 | 1.73 0.43 |
| p-D2H+ | 0.61 | 1.29 0.32 |
| p-D2H+/o-H2D+ | 0.75 0.37 | |